Crow Married-couple Households

COMPARE

Crow
Race
Ancestry
AfghanAfricanAlaska NativeAlaskan AthabascanAlbanianAleutAlsatianAmericanApacheArabArapahoArgentineanArmenianAssyrian/Chaldean/SyriacAustralianAustrianBahamianBangladeshiBarbadianBasqueBelgianBelizeanBermudanBhutaneseBlackfeetBolivianBrazilianBritishBritish West IndianBulgarianBurmeseCajunCambodianCanadianCape VerdeanCarpatho RusynCelticCentral AmericanCentral American IndianCherokeeCheyenneChickasawChileanChineseChippewaChoctawColombianColvilleComancheCosta RicanCreeCreekCroatianCrowCubanCypriotCzechCzechoslovakianDanishDelawareDominicanDutchDutch West IndianEastern EuropeanEcuadorianEgyptianEnglishEstonianEthiopianEuropeanFijianFilipinoFinnishFrenchFrench American IndianFrench CanadianGermanGerman RussianGhanaianGreekGuamanian/ChamorroGuatemalanGuyaneseHaitianHmongHonduranHopiHoumaHungarianIcelanderIndian (Asian)IndonesianInupiatIranianIraqiIrishIroquoisIsraeliItalianJamaicanJapaneseJordanianKenyanKiowaKoreanLaotianLatvianLebaneseLiberianLithuanianLumbeeLuxembourgerMacedonianMalaysianMalteseMarshalleseMenomineeMexicanMexican American IndianMongolianMoroccanNative HawaiianNavajoNepaleseNew ZealanderNicaraguanNigerianNorthern EuropeanNorwegianOkinawanOsageOttawaPaiutePakistaniPalestinianPanamanianParaguayanPennsylvania GermanPeruvianPimaPolishPortuguesePotawatomiPuebloPuerto RicanPuget Sound SalishRomanianRussianSalvadoranSamoanScandinavianScotch-IrishScottishSeminoleSenegaleseSerbianShoshoneSierra LeoneanSiouxSlavicSlovakSloveneSomaliSouth AfricanSouth AmericanSouth American IndianSoviet UnionSpaniardSpanishSpanish AmericanSpanish American IndianSri LankanSubsaharan AfricanSudaneseSwedishSwissSyrianTaiwaneseThaiTlingit-HaidaTohono O'OdhamTonganTrinidadian and TobagonianTsimshianTurkishU.S. Virgin IslanderUgandanUkrainianUruguayanUteVenezuelanVietnameseWelshWest IndianYakamaYaquiYugoslavianYumanYup'ikZimbabwean
Immigration
NonimmigrantsImmigrantsAfghanistanAfricaAlbaniaArgentinaArmeniaAsiaAustraliaAustriaBahamasBangladeshBarbadosBelarusBelgiumBelizeBoliviaBosnia and HerzegovinaBrazilBulgariaBurma/MyanmarCabo VerdeCambodiaCameroonCanadaCaribbeanCentral AmericaChileChinaColombiaCongoCosta RicaCroatiaCubaCzechoslovakiaDenmarkDominicaDominican RepublicEastern AfricaEastern AsiaEastern EuropeEcuadorEgyptEl SalvadorEnglandEritreaEthiopiaEuropeFijiFranceGermanyGhanaGreeceGrenadaGuatemalaGuyanaHaitiHondurasHong KongHungaryIndiaIndonesiaIranIraqIrelandIsraelItalyJamaicaJapanJordanKazakhstanKenyaKoreaKuwaitLaosLatin AmericaLatviaLebanonLiberiaLithuaniaMalaysiaMexicoMicronesiaMiddle AfricaMoldovaMoroccoNepalNetherlandsNicaraguaNigeriaNorth AmericaNorth MacedoniaNorthern AfricaNorthern EuropeNorwayOceaniaPakistanPanamaPeruPhilippinesPolandPortugalRomaniaRussiaSaudi ArabiaScotlandSenegalSerbiaSierra LeoneSingaporeSomaliaSouth AfricaSouth AmericaSouth Central AsiaSouth Eastern AsiaSouthern EuropeSpainSri LankaSt. Vincent and the GrenadinesSudanSwedenSwitzerlandSyriaTaiwanThailandTrinidad and TobagoTurkeyUgandaUkraineUruguayUzbekistanVenezuelaVietnamWest IndiesWestern AfricaWestern AsiaWestern EuropeYemenZaireZimbabweAzores
Select to Compare
Race
Ancestry
AfghanAfricanAlaska NativeAlaskan AthabascanAlbanianAleutAlsatianAmericanApacheArabArapahoArgentineanArmenianAssyrian/Chaldean/SyriacAustralianAustrianBahamianBangladeshiBarbadianBasqueBelgianBelizeanBermudanBhutaneseBlackfeetBolivianBrazilianBritishBritish West IndianBulgarianBurmeseCajunCambodianCanadianCape VerdeanCarpatho RusynCelticCentral AmericanCentral American IndianCherokeeCheyenneChickasawChileanChineseChippewaChoctawColombianColvilleComancheCosta RicanCreeCreekCroatianCubanCypriotCzechCzechoslovakianDanishDelawareDominicanDutchDutch West IndianEastern EuropeanEcuadorianEgyptianEnglishEstonianEthiopianEuropeanFijianFilipinoFinnishFrenchFrench American IndianFrench CanadianGermanGerman RussianGhanaianGreekGuamanian/ChamorroGuatemalanGuyaneseHaitianHmongHonduranHopiHoumaHungarianIcelanderIndian (Asian)IndonesianInupiatIranianIraqiIrishIroquoisIsraeliItalianJamaicanJapaneseJordanianKenyanKiowaKoreanLaotianLatvianLebaneseLiberianLithuanianLumbeeLuxembourgerMacedonianMalaysianMalteseMarshalleseMenomineeMexicanMexican American IndianMongolianMoroccanNative HawaiianNavajoNepaleseNew ZealanderNicaraguanNigerianNorthern EuropeanNorwegianOkinawanOsageOttawaPaiutePakistaniPalestinianPanamanianParaguayanPennsylvania GermanPeruvianPimaPolishPortuguesePotawatomiPuebloPuerto RicanPuget Sound SalishRomanianRussianSalvadoranSamoanScandinavianScotch-IrishScottishSeminoleSenegaleseSerbianShoshoneSierra LeoneanSiouxSlavicSlovakSloveneSomaliSouth AfricanSouth AmericanSouth American IndianSoviet UnionSpaniardSpanishSpanish AmericanSpanish American IndianSri LankanSubsaharan AfricanSudaneseSwedishSwissSyrianTaiwaneseThaiTlingit-HaidaTohono O'OdhamTonganTrinidadian and TobagonianTsimshianTurkishU.S. Virgin IslanderUgandanUkrainianUruguayanUteVenezuelanVietnameseWelshWest IndianYakamaYaquiYugoslavianYumanYup'ikZimbabwean
Immigration
NonimmigrantsImmigrantsAfghanistanAfricaAlbaniaArgentinaArmeniaAsiaAustraliaAustriaBahamasBangladeshBarbadosBelarusBelgiumBelizeBoliviaBosnia and HerzegovinaBrazilBulgariaBurma/MyanmarCabo VerdeCambodiaCameroonCanadaCaribbeanCentral AmericaChileChinaColombiaCongoCosta RicaCroatiaCubaCzechoslovakiaDenmarkDominicaDominican RepublicEastern AfricaEastern AsiaEastern EuropeEcuadorEgyptEl SalvadorEnglandEritreaEthiopiaEuropeFijiFranceGermanyGhanaGreeceGrenadaGuatemalaGuyanaHaitiHondurasHong KongHungaryIndiaIndonesiaIranIraqIrelandIsraelItalyJamaicaJapanJordanKazakhstanKenyaKoreaKuwaitLaosLatin AmericaLatviaLebanonLiberiaLithuaniaMalaysiaMexicoMicronesiaMiddle AfricaMoldovaMoroccoNepalNetherlandsNicaraguaNigeriaNorth AmericaNorth MacedoniaNorthern AfricaNorthern EuropeNorwayOceaniaPakistanPanamaPeruPhilippinesPolandPortugalRomaniaRussiaSaudi ArabiaScotlandSenegalSerbiaSierra LeoneSingaporeSomaliaSouth AfricaSouth AmericaSouth Central AsiaSouth Eastern AsiaSouthern EuropeSpainSri LankaSt. Vincent and the GrenadinesSudanSwedenSwitzerlandSyriaTaiwanThailandTrinidad and TobagoTurkeyUgandaUkraineUruguayUzbekistanVenezuelaVietnamWest IndiesWestern AfricaWestern AsiaWestern EuropeYemenZaireZimbabweAzores
Married-couple Households
Income
Poverty
Unemployment
Labor Participation
Family Structure
Vehicle Availability
Education Level
Disability

Crow Married-couple Households
Tragic

41.4%
MARRIED-COUPLE HOUSEHOLDS
0.0/ 100
METRIC RATING
308th/ 347
METRIC RANK

Crow Married-couple Households Correlation Chart

The statistical analysis conducted on geographies consisting of 59,202,817 people shows a poor negative correlation between the proportion of Crow and percentage of married-couple family households in the United States with a correlation coefficient (R) of -0.186 and weighted average of 41.4%. On average, for every 1% (one percent) increase in Crow within a typical geography, there is a decrease of 0.071% in percentage of married-couple family households.
Crow Married-couple Households
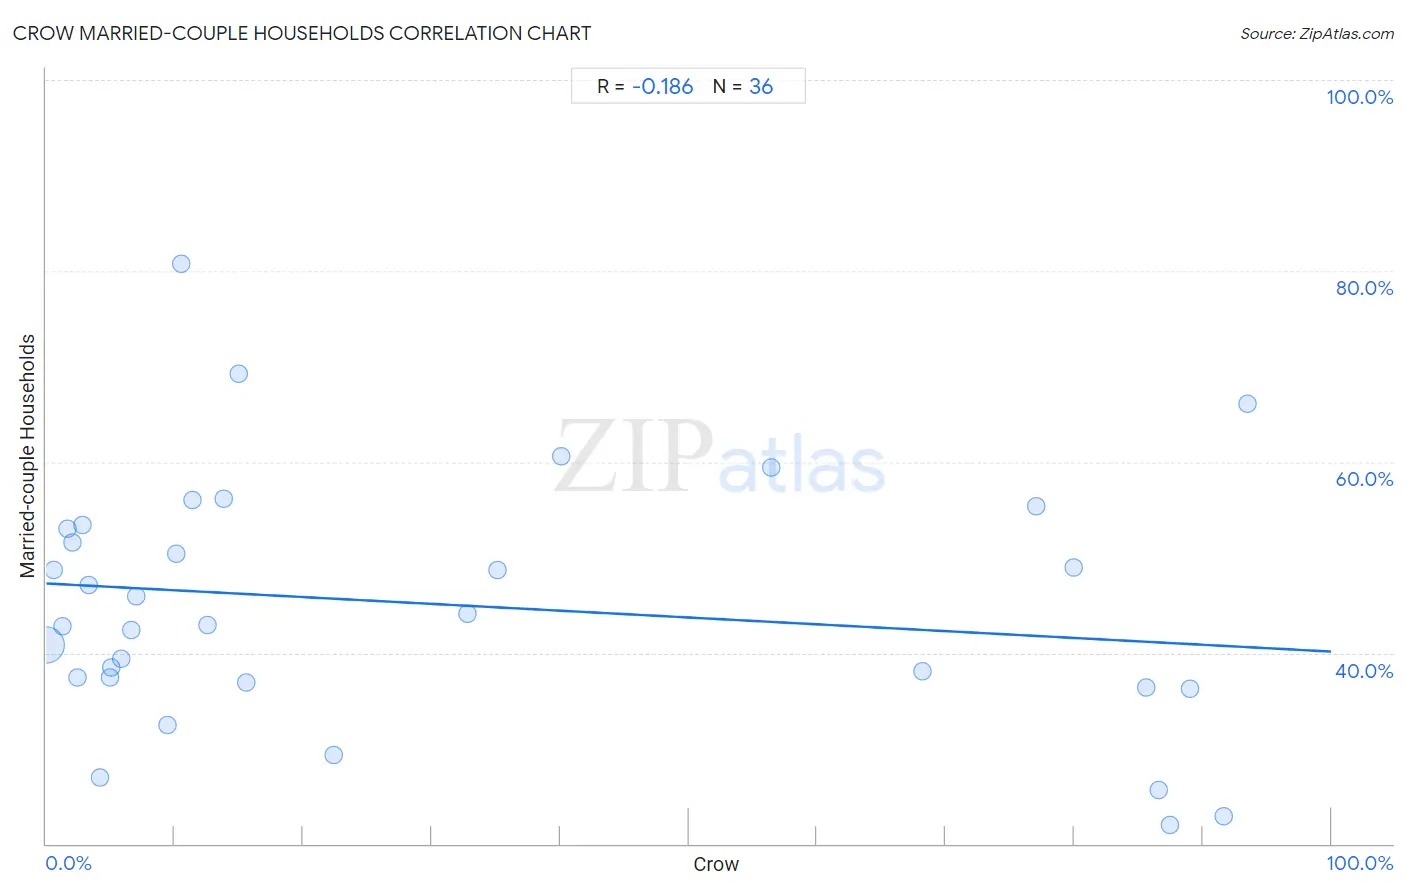
It is essential to understand that the correlation between the percentage of Crow and percentage of married-couple family households does not imply a direct cause-and-effect relationship. It remains uncertain whether the presence of Crow influences an upward or downward trend in the level of percentage of married-couple family households within an area, or if Crow simply ended up residing in those areas with higher or lower levels of percentage of married-couple family households due to other factors.

Demographics Similar to Crow by Married-couple Households

In terms of married-couple households, the demographic groups most similar to Crow are Guyanese (41.4%, a difference of 0.010%), Immigrants from Western Africa (41.4%, a difference of 0.010%), Immigrants from Trinidad and Tobago (41.2%, a difference of 0.35%), Sioux (41.5%, a difference of 0.38%), and Haitian (41.2%, a difference of 0.42%).
DemographicsRating | RankMarried-couple Households
Immigrants from Bahamas
0.0
/100
|
#301
Tragic
41.7%
Immigrants from Honduras
0.0
/100
|
#302
Tragic
41.6%
Sub-Saharan Africans
0.0
/100
|
#303
Tragic
41.6%
Immigrants from Guyana
0.0
/100
|
#304
Tragic
41.6%
Sioux
0.0
/100
|
#305
Tragic
41.5%
Guyanese
0.0
/100
|
#306
Tragic
41.4%
Immigrants from Western Africa
0.0
/100
|
#307
Tragic
41.4%
Crow
0.0
/100
|
#308
Tragic
41.4%
Immigrants from Trinidad and Tobago
0.0
/100
|
#309
Tragic
41.2%
Haitians
0.0
/100
|
#310
Tragic
41.2%
Colville
0.0
/100
|
#311
Tragic
41.0%
Africans
0.0
/100
|
#312
Tragic
40.9%
Immigrants from Haiti
0.0
/100
|
#313
Tragic
40.9%
Jamaicans
0.0
/100
|
#314
Tragic
40.9%
Trinidadians and Tobagonians
0.0
/100
|
#315
Tragic
40.9%

Crow Married-couple Households Correlation Summary

MeasurementCrow DataMarried-couple Households Data
Minimum0.023%21.9%
Maximum93.4%80.8%
Range93.4%58.9%
Mean30.3%45.1%
Median11.9%43.5%
Interquartile 25% (IQ1)4.6%37.1%
Interquartile 75% (IQ3)62.3%53.2%
Interquartile Range (IQR)57.7%16.0%
Standard Deviation (Sample)34.0%13.1%
Standard Deviation (Population)33.5%12.9%

Correlation Details

Crow PercentileSample SizeMarried-couple Households
[
0.0%
-
0.5%
]
0.023%
58,539,70240.8%
[
0.5%
-
1.0%
]
0.59%
293,50948.7%
[
1.0%
-
1.5%
]
1.26%
166,10342.8%
[
1.5%
-
2.0%
]
1.61%
92,76153.0%
[
2.0%
-
2.5%
]
2.07%
7,19251.5%
[
2.0%
-
2.5%
]
2.45%
49,25337.4%
[
2.5%
-
3.0%
]
2.87%
2,12953.4%
[
3.0%
-
3.5%
]
3.26%
11,59847.1%
[
4.0%
-
4.5%
]
4.23%
1,56027.0%
[
4.5%
-
5.0%
]
4.97%
5,27637.4%
[
5.0%
-
5.5%
]
5.10%
1,01938.4%
[
5.5%
-
6.0%
]
5.79%
1,79639.4%
[
6.5%
-
7.0%
]
6.61%
4,22342.4%
[
7.0%
-
7.5%
]
7.01%
78545.9%
[
9.0%
-
9.5%
]
9.45%
2,06432.4%
[
10.0%
-
10.5%
]
10.08%
2,81750.4%
[
10.5%
-
11.0%
]
10.53%
19080.8%
[
11.0%
-
11.5%
]
11.36%
17656.1%
[
12.0%
-
12.5%
]
12.50%
4842.9%
[
13.5%
-
14.0%
]
13.79%
42856.1%
[
15.0%
-
15.5%
]
15.00%
4069.2%
[
15.5%
-
16.0%
]
15.56%
1,12536.9%
[
22.0%
-
22.5%
]
22.35%
78329.3%
[
32.5%
-
33.0%
]
32.75%
3,98544.1%
[
35.0%
-
35.5%
]
35.12%
5,19948.7%
[
40.0%
-
40.5%
]
40.12%
17260.6%
[
56.0%
-
56.5%
]
56.41%
7859.4%
[
68.0%
-
68.5%
]
68.23%
57638.1%
[
77.0%
-
77.5%
]
77.09%
1,60255.3%
[
79.5%
-
80.0%
]
79.96%
45948.9%
[
85.5%
-
86.0%
]
85.61%
66036.4%
[
86.5%
-
87.0%
]
86.61%
2,18025.6%
[
87.0%
-
87.5%
]
87.40%
26221.9%
[
89.0%
-
89.5%
]
89.03%
62936.2%
[
91.5%
-
92.0%
]
91.65%
1,96522.9%
[
93.0%
-
93.5%
]
93.45%
47366.2%