Immigrants from Jordan Married-couple Households
COMPARE
Immigrants from Jordan
Select to Compare
Married-couple Households
Immigrants from Jordan Married-couple Households
47.7%
MARRIED-COUPLE HOUSEHOLDS
94.1/ 100
METRIC RATING
109th/ 347
METRIC RANK
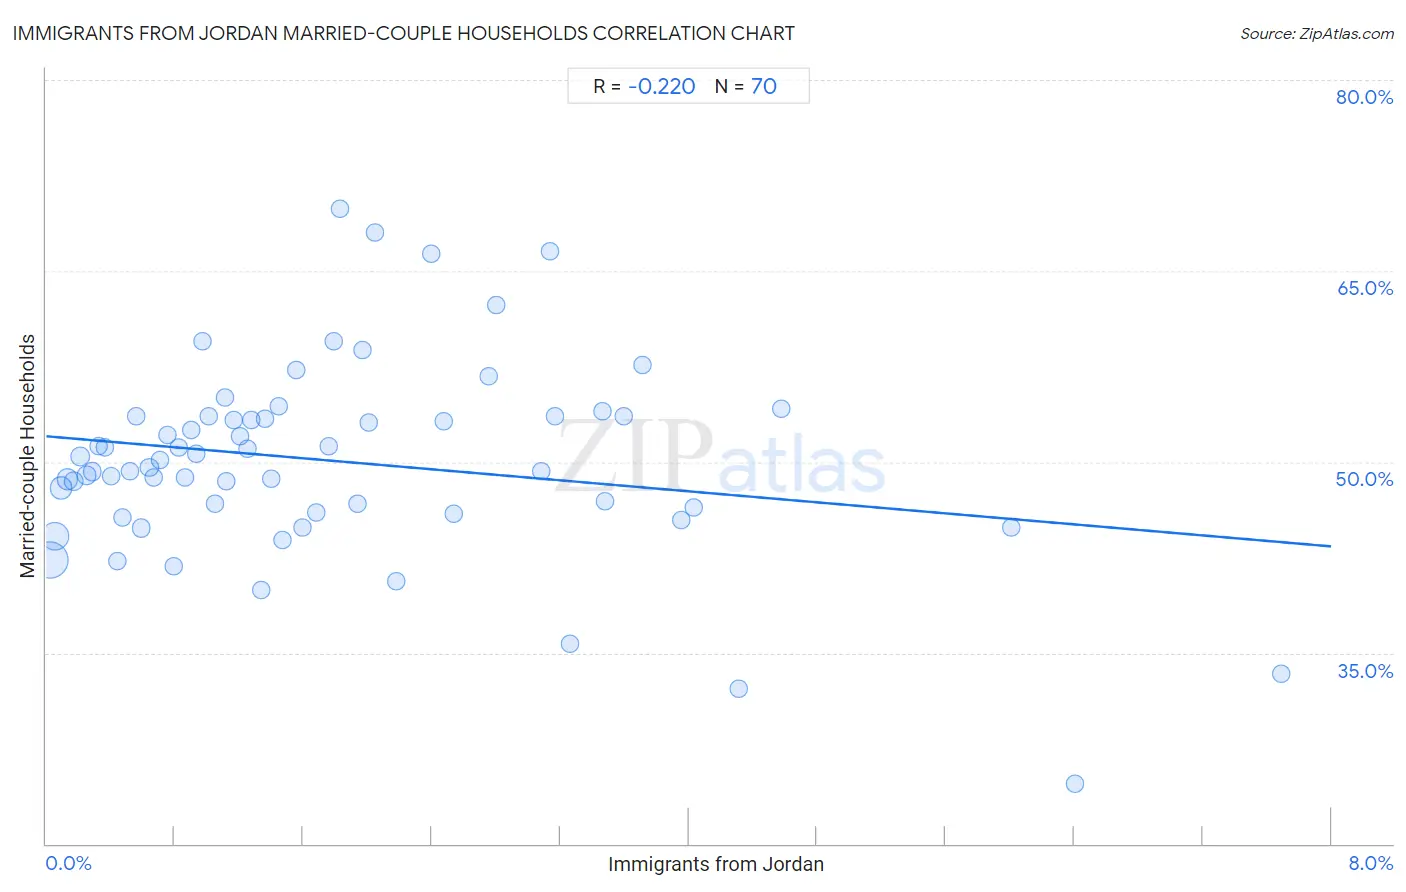
Immigrants from Jordan Married-couple Households Correlation Chart
The statistical analysis conducted on geographies consisting of 181,252,999 people shows a weak negative correlation between the proportion of Immigrants from Jordan and percentage of married-couple family households in the United States with a correlation coefficient (R) of -0.220 and weighted average of 47.7%. On average, for every 1% (one percent) increase in Immigrants from Jordan within a typical geography, there is a decrease of 1.1% in percentage of married-couple family households.
It is essential to understand that the correlation between the percentage of Immigrants from Jordan and percentage of married-couple family households does not imply a direct cause-and-effect relationship. It remains uncertain whether the presence of Immigrants from Jordan influences an upward or downward trend in the level of percentage of married-couple family households within an area, or if Immigrants from Jordan simply ended up residing in those areas with higher or lower levels of percentage of married-couple family households due to other factors.
Demographics Similar to Immigrants from Jordan by Married-couple Households
In terms of married-couple households, the demographic groups most similar to Immigrants from Jordan are Macedonian (47.6%, a difference of 0.020%), Syrian (47.6%, a difference of 0.030%), Peruvian (47.6%, a difference of 0.040%), Immigrants from Japan (47.7%, a difference of 0.050%), and Venezuelan (47.6%, a difference of 0.050%).
| Demographics | Rating | Rank | Married-couple Households |
| Slavs | 96.0 /100 | #102 | Exceptional 47.8% |
| Hawaiians | 96.0 /100 | #103 | Exceptional 47.8% |
| Immigrants from South Africa | 96.0 /100 | #104 | Exceptional 47.8% |
| Immigrants from Czechoslovakia | 95.5 /100 | #105 | Exceptional 47.8% |
| Portuguese | 95.5 /100 | #106 | Exceptional 47.8% |
| Estonians | 94.7 /100 | #107 | Exceptional 47.7% |
| Immigrants from Japan | 94.4 /100 | #108 | Exceptional 47.7% |
| Immigrants from Jordan | 94.1 /100 | #109 | Exceptional 47.7% |
| Macedonians | 93.9 /100 | #110 | Exceptional 47.6% |
| Syrians | 93.9 /100 | #111 | Exceptional 47.6% |
| Peruvians | 93.8 /100 | #112 | Exceptional 47.6% |
| Venezuelans | 93.8 /100 | #113 | Exceptional 47.6% |
| Immigrants from Europe | 93.7 /100 | #114 | Exceptional 47.6% |
| Slovaks | 92.9 /100 | #115 | Exceptional 47.6% |
| Argentineans | 92.5 /100 | #116 | Exceptional 47.5% |
Immigrants from Jordan Married-couple Households Correlation Summary
| Measurement | Immigrants from Jordan Data | Married-couple Households Data |
| Minimum | 0.021% | 24.7% |
| Maximum | 7.7% | 69.8% |
| Range | 7.7% | 45.1% |
| Mean | 1.8% | 50.1% |
| Median | 1.3% | 49.9% |
| Interquartile 25% (IQ1) | 0.67% | 46.0% |
| Interquartile 75% (IQ3) | 2.5% | 53.6% |
| Interquartile Range (IQR) | 1.9% | 7.5% |
| Standard Deviation (Sample) | 1.6% | 7.7% |
| Standard Deviation (Population) | 1.6% | 7.7% |
Correlation Details
| Immigrants from Jordan Percentile | Sample Size | Married-couple Households |
[ 0.0% - 0.5% ] 0.021% | 83,069,791 | 42.3% |
[ 0.0% - 0.5% ] 0.057% | 44,505,930 | 44.1% |
[ 0.0% - 0.5% ] 0.094% | 18,173,093 | 48.0% |
[ 0.0% - 0.5% ] 0.13% | 11,969,970 | 48.6% |
[ 0.0% - 0.5% ] 0.17% | 6,007,812 | 48.5% |
[ 0.0% - 0.5% ] 0.21% | 3,675,120 | 50.4% |
[ 0.0% - 0.5% ] 0.25% | 2,755,180 | 49.0% |
[ 0.0% - 0.5% ] 0.29% | 2,191,677 | 49.2% |
[ 0.0% - 0.5% ] 0.33% | 1,221,782 | 51.2% |
[ 0.0% - 0.5% ] 0.36% | 1,138,839 | 51.2% |
[ 0.0% - 0.5% ] 0.40% | 805,480 | 48.9% |
[ 0.0% - 0.5% ] 0.44% | 1,243,678 | 42.2% |
[ 0.0% - 0.5% ] 0.48% | 337,325 | 45.7% |
[ 0.5% - 1.0% ] 0.52% | 469,065 | 49.3% |
[ 0.5% - 1.0% ] 0.56% | 422,672 | 53.6% |
[ 0.5% - 1.0% ] 0.59% | 423,170 | 44.8% |
[ 0.5% - 1.0% ] 0.64% | 360,990 | 49.6% |
[ 0.5% - 1.0% ] 0.67% | 277,337 | 48.8% |
[ 0.5% - 1.0% ] 0.71% | 160,740 | 50.1% |
[ 0.5% - 1.0% ] 0.75% | 282,201 | 52.1% |
[ 0.5% - 1.0% ] 0.79% | 167,823 | 41.8% |
[ 0.5% - 1.0% ] 0.83% | 48,630 | 51.2% |
[ 0.5% - 1.0% ] 0.86% | 110,348 | 48.8% |
[ 0.5% - 1.0% ] 0.90% | 176,938 | 52.5% |
[ 0.5% - 1.0% ] 0.93% | 85,562 | 50.6% |
[ 0.5% - 1.0% ] 0.98% | 7,782 | 59.4% |
[ 1.0% - 1.5% ] 1.01% | 74,840 | 53.6% |
[ 1.0% - 1.5% ] 1.05% | 14,982 | 46.7% |
[ 1.0% - 1.5% ] 1.11% | 138,607 | 55.0% |
[ 1.0% - 1.5% ] 1.12% | 82,468 | 48.5% |
[ 1.0% - 1.5% ] 1.17% | 52,627 | 53.3% |
[ 1.0% - 1.5% ] 1.21% | 92,277 | 52.1% |
[ 1.0% - 1.5% ] 1.25% | 83,024 | 51.0% |
[ 1.0% - 1.5% ] 1.28% | 64,439 | 53.2% |
[ 1.0% - 1.5% ] 1.33% | 44,281 | 40.0% |
[ 1.0% - 1.5% ] 1.36% | 37,601 | 53.4% |
[ 1.0% - 1.5% ] 1.40% | 54,590 | 48.7% |
[ 1.0% - 1.5% ] 1.44% | 28,464 | 54.4% |
[ 1.0% - 1.5% ] 1.47% | 14,894 | 43.8% |
[ 1.5% - 2.0% ] 1.56% | 8,220 | 57.2% |
[ 1.5% - 2.0% ] 1.59% | 36,930 | 44.8% |
[ 1.5% - 2.0% ] 1.68% | 12,525 | 46.0% |
[ 1.5% - 2.0% ] 1.76% | 16,613 | 51.2% |
[ 1.5% - 2.0% ] 1.79% | 51,537 | 59.5% |
[ 1.5% - 2.0% ] 1.83% | 25,489 | 69.8% |
[ 1.5% - 2.0% ] 1.94% | 21,760 | 46.8% |
[ 1.5% - 2.0% ] 1.97% | 6,496 | 58.8% |
[ 2.0% - 2.5% ] 2.01% | 14,915 | 53.1% |
[ 2.0% - 2.5% ] 2.05% | 6,549 | 68.0% |
[ 2.0% - 2.5% ] 2.18% | 2,160 | 40.7% |
[ 2.0% - 2.5% ] 2.40% | 8,171 | 66.4% |
[ 2.0% - 2.5% ] 2.47% | 7,763 | 53.2% |
[ 2.5% - 3.0% ] 2.54% | 13,291 | 45.9% |
[ 2.5% - 3.0% ] 2.76% | 15,452 | 56.7% |
[ 2.5% - 3.0% ] 2.80% | 9,960 | 62.3% |
[ 3.0% - 3.5% ] 3.08% | 29,883 | 49.3% |
[ 3.0% - 3.5% ] 3.14% | 3,317 | 66.6% |
[ 3.0% - 3.5% ] 3.16% | 8,535 | 53.6% |
[ 3.0% - 3.5% ] 3.26% | 889 | 35.7% |
[ 3.0% - 3.5% ] 3.46% | 7,804 | 54.0% |
[ 3.0% - 3.5% ] 3.48% | 28,568 | 46.9% |
[ 3.5% - 4.0% ] 3.60% | 8,919 | 53.6% |
[ 3.5% - 4.0% ] 3.71% | 2,453 | 57.6% |
[ 3.5% - 4.0% ] 3.95% | 11,084 | 45.4% |
[ 4.0% - 4.5% ] 4.03% | 11,259 | 46.4% |
[ 4.0% - 4.5% ] 4.31% | 371 | 32.1% |
[ 4.5% - 5.0% ] 4.58% | 1,289 | 54.2% |
[ 6.0% - 6.5% ] 6.01% | 8,024 | 44.8% |
[ 6.0% - 6.5% ] 6.41% | 562 | 24.7% |
[ 7.5% - 8.0% ] 7.69% | 182 | 33.3% |