Moroccan Married-couple Households

COMPARE

Moroccan
Race
Ancestry
AfghanAfricanAlaska NativeAlaskan AthabascanAlbanianAleutAlsatianAmericanApacheArabArapahoArgentineanArmenianAssyrian/Chaldean/SyriacAustralianAustrianBahamianBangladeshiBarbadianBasqueBelgianBelizeanBermudanBhutaneseBlackfeetBolivianBrazilianBritishBritish West IndianBulgarianBurmeseCajunCambodianCanadianCape VerdeanCarpatho RusynCelticCentral AmericanCentral American IndianCherokeeCheyenneChickasawChileanChineseChippewaChoctawColombianColvilleComancheCosta RicanCreeCreekCroatianCrowCubanCypriotCzechCzechoslovakianDanishDelawareDominicanDutchDutch West IndianEastern EuropeanEcuadorianEgyptianEnglishEstonianEthiopianEuropeanFijianFilipinoFinnishFrenchFrench American IndianFrench CanadianGermanGerman RussianGhanaianGreekGuamanian/ChamorroGuatemalanGuyaneseHaitianHmongHonduranHopiHoumaHungarianIcelanderIndian (Asian)IndonesianInupiatIranianIraqiIrishIroquoisIsraeliItalianJamaicanJapaneseJordanianKenyanKiowaKoreanLaotianLatvianLebaneseLiberianLithuanianLumbeeLuxembourgerMacedonianMalaysianMalteseMarshalleseMenomineeMexicanMexican American IndianMongolianMoroccanNative HawaiianNavajoNepaleseNew ZealanderNicaraguanNigerianNorthern EuropeanNorwegianOkinawanOsageOttawaPaiutePakistaniPalestinianPanamanianParaguayanPennsylvania GermanPeruvianPimaPolishPortuguesePotawatomiPuebloPuerto RicanPuget Sound SalishRomanianRussianSalvadoranSamoanScandinavianScotch-IrishScottishSeminoleSenegaleseSerbianShoshoneSierra LeoneanSiouxSlavicSlovakSloveneSomaliSouth AfricanSouth AmericanSouth American IndianSoviet UnionSpaniardSpanishSpanish AmericanSpanish American IndianSri LankanSubsaharan AfricanSudaneseSwedishSwissSyrianTaiwaneseThaiTlingit-HaidaTohono O'OdhamTonganTrinidadian and TobagonianTsimshianTurkishU.S. Virgin IslanderUgandanUkrainianUruguayanUteVenezuelanVietnameseWelshWest IndianYakamaYaquiYugoslavianYumanYup'ikZimbabwean
Immigration
NonimmigrantsImmigrantsAfghanistanAfricaAlbaniaArgentinaArmeniaAsiaAustraliaAustriaBahamasBangladeshBarbadosBelarusBelgiumBelizeBoliviaBosnia and HerzegovinaBrazilBulgariaBurma/MyanmarCabo VerdeCambodiaCameroonCanadaCaribbeanCentral AmericaChileChinaColombiaCongoCosta RicaCroatiaCubaCzechoslovakiaDenmarkDominicaDominican RepublicEastern AfricaEastern AsiaEastern EuropeEcuadorEgyptEl SalvadorEnglandEritreaEthiopiaEuropeFijiFranceGermanyGhanaGreeceGrenadaGuatemalaGuyanaHaitiHondurasHong KongHungaryIndiaIndonesiaIranIraqIrelandIsraelItalyJamaicaJapanJordanKazakhstanKenyaKoreaKuwaitLaosLatin AmericaLatviaLebanonLiberiaLithuaniaMalaysiaMexicoMicronesiaMiddle AfricaMoldovaMoroccoNepalNetherlandsNicaraguaNigeriaNorth AmericaNorth MacedoniaNorthern AfricaNorthern EuropeNorwayOceaniaPakistanPanamaPeruPhilippinesPolandPortugalRomaniaRussiaSaudi ArabiaScotlandSenegalSerbiaSierra LeoneSingaporeSomaliaSouth AfricaSouth AmericaSouth Central AsiaSouth Eastern AsiaSouthern EuropeSpainSri LankaSt. Vincent and the GrenadinesSudanSwedenSwitzerlandSyriaTaiwanThailandTrinidad and TobagoTurkeyUgandaUkraineUruguayUzbekistanVenezuelaVietnamWest IndiesWestern AfricaWestern AsiaWestern EuropeYemenZaireZimbabweAzores
Select to Compare
Race
Ancestry
AfghanAfricanAlaska NativeAlaskan AthabascanAlbanianAleutAlsatianAmericanApacheArabArapahoArgentineanArmenianAssyrian/Chaldean/SyriacAustralianAustrianBahamianBangladeshiBarbadianBasqueBelgianBelizeanBermudanBhutaneseBlackfeetBolivianBrazilianBritishBritish West IndianBulgarianBurmeseCajunCambodianCanadianCape VerdeanCarpatho RusynCelticCentral AmericanCentral American IndianCherokeeCheyenneChickasawChileanChineseChippewaChoctawColombianColvilleComancheCosta RicanCreeCreekCroatianCrowCubanCypriotCzechCzechoslovakianDanishDelawareDominicanDutchDutch West IndianEastern EuropeanEcuadorianEgyptianEnglishEstonianEthiopianEuropeanFijianFilipinoFinnishFrenchFrench American IndianFrench CanadianGermanGerman RussianGhanaianGreekGuamanian/ChamorroGuatemalanGuyaneseHaitianHmongHonduranHopiHoumaHungarianIcelanderIndian (Asian)IndonesianInupiatIranianIraqiIrishIroquoisIsraeliItalianJamaicanJapaneseJordanianKenyanKiowaKoreanLaotianLatvianLebaneseLiberianLithuanianLumbeeLuxembourgerMacedonianMalaysianMalteseMarshalleseMenomineeMexicanMexican American IndianMongolianNative HawaiianNavajoNepaleseNew ZealanderNicaraguanNigerianNorthern EuropeanNorwegianOkinawanOsageOttawaPaiutePakistaniPalestinianPanamanianParaguayanPennsylvania GermanPeruvianPimaPolishPortuguesePotawatomiPuebloPuerto RicanPuget Sound SalishRomanianRussianSalvadoranSamoanScandinavianScotch-IrishScottishSeminoleSenegaleseSerbianShoshoneSierra LeoneanSiouxSlavicSlovakSloveneSomaliSouth AfricanSouth AmericanSouth American IndianSoviet UnionSpaniardSpanishSpanish AmericanSpanish American IndianSri LankanSubsaharan AfricanSudaneseSwedishSwissSyrianTaiwaneseThaiTlingit-HaidaTohono O'OdhamTonganTrinidadian and TobagonianTsimshianTurkishU.S. Virgin IslanderUgandanUkrainianUruguayanUteVenezuelanVietnameseWelshWest IndianYakamaYaquiYugoslavianYumanYup'ikZimbabwean
Immigration
NonimmigrantsImmigrantsAfghanistanAfricaAlbaniaArgentinaArmeniaAsiaAustraliaAustriaBahamasBangladeshBarbadosBelarusBelgiumBelizeBoliviaBosnia and HerzegovinaBrazilBulgariaBurma/MyanmarCabo VerdeCambodiaCameroonCanadaCaribbeanCentral AmericaChileChinaColombiaCongoCosta RicaCroatiaCubaCzechoslovakiaDenmarkDominicaDominican RepublicEastern AfricaEastern AsiaEastern EuropeEcuadorEgyptEl SalvadorEnglandEritreaEthiopiaEuropeFijiFranceGermanyGhanaGreeceGrenadaGuatemalaGuyanaHaitiHondurasHong KongHungaryIndiaIndonesiaIranIraqIrelandIsraelItalyJamaicaJapanJordanKazakhstanKenyaKoreaKuwaitLaosLatin AmericaLatviaLebanonLiberiaLithuaniaMalaysiaMexicoMicronesiaMiddle AfricaMoldovaMoroccoNepalNetherlandsNicaraguaNigeriaNorth AmericaNorth MacedoniaNorthern AfricaNorthern EuropeNorwayOceaniaPakistanPanamaPeruPhilippinesPolandPortugalRomaniaRussiaSaudi ArabiaScotlandSenegalSerbiaSierra LeoneSingaporeSomaliaSouth AfricaSouth AmericaSouth Central AsiaSouth Eastern AsiaSouthern EuropeSpainSri LankaSt. Vincent and the GrenadinesSudanSwedenSwitzerlandSyriaTaiwanThailandTrinidad and TobagoTurkeyUgandaUkraineUruguayUzbekistanVenezuelaVietnamWest IndiesWestern AfricaWestern AsiaWestern EuropeYemenZaireZimbabweAzores
Married-couple Households
Income
Poverty
Unemployment
Labor Participation
Family Structure
Vehicle Availability
Education Level
Disability

Moroccan Married-couple Households
Tragic

43.5%
MARRIED-COUPLE HOUSEHOLDS
0.1/ 100
METRIC RATING
265th/ 347
METRIC RANK

Moroccan Married-couple Households Correlation Chart

The statistical analysis conducted on geographies consisting of 201,755,880 people shows a substantial negative correlation between the proportion of Moroccans and percentage of married-couple family households in the United States with a correlation coefficient (R) of -0.510 and weighted average of 43.5%. On average, for every 1% (one percent) increase in Moroccans within a typical geography, there is a decrease of 1.2% in percentage of married-couple family households.
Moroccan Married-couple Households
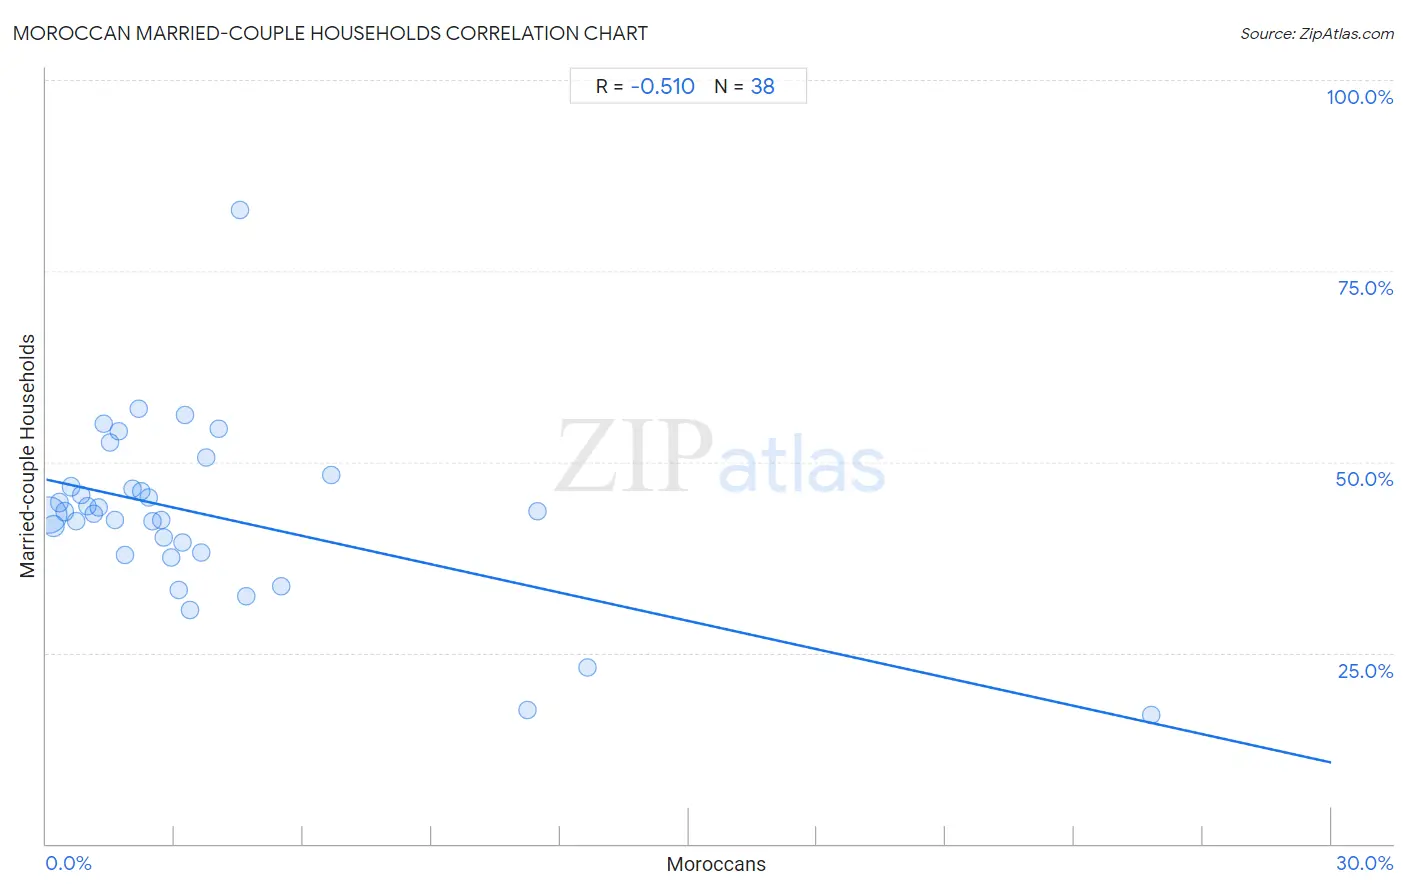
It is essential to understand that the correlation between the percentage of Moroccans and percentage of married-couple family households does not imply a direct cause-and-effect relationship. It remains uncertain whether the presence of Moroccans influences an upward or downward trend in the level of percentage of married-couple family households within an area, or if Moroccans simply ended up residing in those areas with higher or lower levels of percentage of married-couple family households due to other factors.

Demographics Similar to Moroccans by Married-couple Households

In terms of married-couple households, the demographic groups most similar to Moroccans are Ecuadorian (43.5%, a difference of 0.040%), Bangladeshi (43.5%, a difference of 0.080%), Native/Alaskan (43.5%, a difference of 0.090%), Cree (43.6%, a difference of 0.19%), and Immigrants from Burma/Myanmar (43.4%, a difference of 0.20%).
DemographicsRating | RankMarried-couple Households
Central American Indians
0.2
/100
|
#258
Tragic
43.8%
Iroquois
0.2
/100
|
#259
Tragic
43.7%
Immigrants from Cameroon
0.2
/100
|
#260
Tragic
43.7%
Alaskan Athabascans
0.2
/100
|
#261
Tragic
43.6%
Vietnamese
0.2
/100
|
#262
Tragic
43.6%
Cree
0.1
/100
|
#263
Tragic
43.6%
Bangladeshis
0.1
/100
|
#264
Tragic
43.5%
Moroccans
0.1
/100
|
#265
Tragic
43.5%
Ecuadorians
0.1
/100
|
#266
Tragic
43.5%
Natives/Alaskans
0.1
/100
|
#267
Tragic
43.5%
Immigrants from Burma/Myanmar
0.1
/100
|
#268
Tragic
43.4%
Immigrants from Sierra Leone
0.1
/100
|
#269
Tragic
43.3%
Yuman
0.1
/100
|
#270
Tragic
43.3%
Guatemalans
0.1
/100
|
#271
Tragic
43.3%
Immigrants from Nigeria
0.1
/100
|
#272
Tragic
43.2%

Moroccan Married-couple Households Correlation Summary

MeasurementMoroccan DataMarried-couple Households Data
Minimum0.046%16.8%
Maximum25.8%83.0%
Range25.7%66.2%
Mean3.7%43.1%
Median2.4%43.3%
Interquartile 25% (IQ1)1.2%38.2%
Interquartile 75% (IQ3)3.7%46.7%
Interquartile Range (IQR)2.5%8.5%
Standard Deviation (Sample)4.7%11.5%
Standard Deviation (Population)4.7%11.3%

Correlation Details

Moroccan PercentileSample SizeMarried-couple Households
[
0.0%
-
0.5%
]
0.046%
147,564,61443.0%
[
0.0%
-
0.5%
]
0.17%
33,403,61041.6%
[
0.0%
-
0.5%
]
0.31%
8,865,45244.6%
[
0.0%
-
0.5%
]
0.44%
4,347,88143.5%
[
0.5%
-
1.0%
]
0.57%
2,425,87546.7%
[
0.5%
-
1.0%
]
0.70%
1,635,22642.2%
[
0.5%
-
1.0%
]
0.82%
1,060,81345.7%
[
0.5%
-
1.0%
]
0.95%
560,52144.2%
[
1.0%
-
1.5%
]
1.10%
298,70443.2%
[
1.0%
-
1.5%
]
1.22%
472,51244.1%
[
1.0%
-
1.5%
]
1.34%
148,61555.0%
[
1.0%
-
1.5%
]
1.48%
250,43152.5%
[
1.5%
-
2.0%
]
1.60%
132,66442.4%
[
1.5%
-
2.0%
]
1.70%
19,22754.1%
[
1.5%
-
2.0%
]
1.85%
115,69637.8%
[
2.0%
-
2.5%
]
2.02%
16,51646.4%
[
2.0%
-
2.5%
]
2.15%
64,96356.9%
[
2.0%
-
2.5%
]
2.23%
213,40046.2%
[
2.0%
-
2.5%
]
2.39%
37,06545.3%
[
2.0%
-
2.5%
]
2.48%
13,60342.2%
[
2.5%
-
3.0%
]
2.70%
6,37942.4%
[
2.5%
-
3.0%
]
2.73%
31,77140.2%
[
2.5%
-
3.0%
]
2.91%
9,65637.5%
[
3.0%
-
3.5%
]
3.09%
5,91733.3%
[
3.0%
-
3.5%
]
3.19%
18839.5%
[
3.0%
-
3.5%
]
3.24%
5,37156.1%
[
3.0%
-
3.5%
]
3.37%
19,53130.6%
[
3.5%
-
4.0%
]
3.63%
8,20738.2%
[
3.5%
-
4.0%
]
3.74%
93550.6%
[
4.0%
-
4.5%
]
4.02%
1,02054.3%
[
4.5%
-
5.0%
]
4.52%
6,12383.0%
[
4.5%
-
5.0%
]
4.67%
2,50832.3%
[
5.0%
-
5.5%
]
5.48%
2,49933.7%
[
6.5%
-
7.0%
]
6.67%
46548.3%
[
11.0%
-
11.5%
]
11.23%
6,96217.5%
[
11.0%
-
11.5%
]
11.46%
31443.5%
[
12.5%
-
13.0%
]
12.65%
33223.0%
[
25.5%
-
26.0%
]
25.80%
31416.8%