Immigrants from Denmark Married-couple Households

COMPARE

Immigrants from Denmark
Race
Ancestry
AfghanAfricanAlaska NativeAlaskan AthabascanAlbanianAleutAlsatianAmericanApacheArabArapahoArgentineanArmenianAssyrian/Chaldean/SyriacAustralianAustrianBahamianBangladeshiBarbadianBasqueBelgianBelizeanBermudanBhutaneseBlackfeetBolivianBrazilianBritishBritish West IndianBulgarianBurmeseCajunCambodianCanadianCape VerdeanCarpatho RusynCelticCentral AmericanCentral American IndianCherokeeCheyenneChickasawChileanChineseChippewaChoctawColombianColvilleComancheCosta RicanCreeCreekCroatianCrowCubanCypriotCzechCzechoslovakianDanishDelawareDominicanDutchDutch West IndianEastern EuropeanEcuadorianEgyptianEnglishEstonianEthiopianEuropeanFijianFilipinoFinnishFrenchFrench American IndianFrench CanadianGermanGerman RussianGhanaianGreekGuamanian/ChamorroGuatemalanGuyaneseHaitianHmongHonduranHopiHoumaHungarianIcelanderIndian (Asian)IndonesianInupiatIranianIraqiIrishIroquoisIsraeliItalianJamaicanJapaneseJordanianKenyanKiowaKoreanLaotianLatvianLebaneseLiberianLithuanianLumbeeLuxembourgerMacedonianMalaysianMalteseMarshalleseMenomineeMexicanMexican American IndianMongolianMoroccanNative HawaiianNavajoNepaleseNew ZealanderNicaraguanNigerianNorthern EuropeanNorwegianOkinawanOsageOttawaPaiutePakistaniPalestinianPanamanianParaguayanPennsylvania GermanPeruvianPimaPolishPortuguesePotawatomiPuebloPuerto RicanPuget Sound SalishRomanianRussianSalvadoranSamoanScandinavianScotch-IrishScottishSeminoleSenegaleseSerbianShoshoneSierra LeoneanSiouxSlavicSlovakSloveneSomaliSouth AfricanSouth AmericanSouth American IndianSoviet UnionSpaniardSpanishSpanish AmericanSpanish American IndianSri LankanSubsaharan AfricanSudaneseSwedishSwissSyrianTaiwaneseThaiTlingit-HaidaTohono O'OdhamTonganTrinidadian and TobagonianTsimshianTurkishU.S. Virgin IslanderUgandanUkrainianUruguayanUteVenezuelanVietnameseWelshWest IndianYakamaYaquiYugoslavianYumanYup'ikZimbabwean
Immigration
NonimmigrantsImmigrantsAfghanistanAfricaAlbaniaArgentinaArmeniaAsiaAustraliaAustriaBahamasBangladeshBarbadosBelarusBelgiumBelizeBoliviaBosnia and HerzegovinaBrazilBulgariaBurma/MyanmarCabo VerdeCambodiaCameroonCanadaCaribbeanCentral AmericaChileChinaColombiaCongoCosta RicaCroatiaCubaCzechoslovakiaDenmarkDominicaDominican RepublicEastern AfricaEastern AsiaEastern EuropeEcuadorEgyptEl SalvadorEnglandEritreaEthiopiaEuropeFijiFranceGermanyGhanaGreeceGrenadaGuatemalaGuyanaHaitiHondurasHong KongHungaryIndiaIndonesiaIranIraqIrelandIsraelItalyJamaicaJapanJordanKazakhstanKenyaKoreaKuwaitLaosLatin AmericaLatviaLebanonLiberiaLithuaniaMalaysiaMexicoMicronesiaMiddle AfricaMoldovaMoroccoNepalNetherlandsNicaraguaNigeriaNorth AmericaNorth MacedoniaNorthern AfricaNorthern EuropeNorwayOceaniaPakistanPanamaPeruPhilippinesPolandPortugalRomaniaRussiaSaudi ArabiaScotlandSenegalSerbiaSierra LeoneSingaporeSomaliaSouth AfricaSouth AmericaSouth Central AsiaSouth Eastern AsiaSouthern EuropeSpainSri LankaSt. Vincent and the GrenadinesSudanSwedenSwitzerlandSyriaTaiwanThailandTrinidad and TobagoTurkeyUgandaUkraineUruguayUzbekistanVenezuelaVietnamWest IndiesWestern AfricaWestern AsiaWestern EuropeYemenZaireZimbabweAzores
Select to Compare
Race
Ancestry
AfghanAfricanAlaska NativeAlaskan AthabascanAlbanianAleutAlsatianAmericanApacheArabArapahoArgentineanArmenianAssyrian/Chaldean/SyriacAustralianAustrianBahamianBangladeshiBarbadianBasqueBelgianBelizeanBermudanBhutaneseBlackfeetBolivianBrazilianBritishBritish West IndianBulgarianBurmeseCajunCambodianCanadianCape VerdeanCarpatho RusynCelticCentral AmericanCentral American IndianCherokeeCheyenneChickasawChileanChineseChippewaChoctawColombianColvilleComancheCosta RicanCreeCreekCroatianCrowCubanCypriotCzechCzechoslovakianDanishDelawareDominicanDutchDutch West IndianEastern EuropeanEcuadorianEgyptianEnglishEstonianEthiopianEuropeanFijianFilipinoFinnishFrenchFrench American IndianFrench CanadianGermanGerman RussianGhanaianGreekGuamanian/ChamorroGuatemalanGuyaneseHaitianHmongHonduranHopiHoumaHungarianIcelanderIndian (Asian)IndonesianInupiatIranianIraqiIrishIroquoisIsraeliItalianJamaicanJapaneseJordanianKenyanKiowaKoreanLaotianLatvianLebaneseLiberianLithuanianLumbeeLuxembourgerMacedonianMalaysianMalteseMarshalleseMenomineeMexicanMexican American IndianMongolianMoroccanNative HawaiianNavajoNepaleseNew ZealanderNicaraguanNigerianNorthern EuropeanNorwegianOkinawanOsageOttawaPaiutePakistaniPalestinianPanamanianParaguayanPennsylvania GermanPeruvianPimaPolishPortuguesePotawatomiPuebloPuerto RicanPuget Sound SalishRomanianRussianSalvadoranSamoanScandinavianScotch-IrishScottishSeminoleSenegaleseSerbianShoshoneSierra LeoneanSiouxSlavicSlovakSloveneSomaliSouth AfricanSouth AmericanSouth American IndianSoviet UnionSpaniardSpanishSpanish AmericanSpanish American IndianSri LankanSubsaharan AfricanSudaneseSwedishSwissSyrianTaiwaneseThaiTlingit-HaidaTohono O'OdhamTonganTrinidadian and TobagonianTsimshianTurkishU.S. Virgin IslanderUgandanUkrainianUruguayanUteVenezuelanVietnameseWelshWest IndianYakamaYaquiYugoslavianYumanYup'ikZimbabwean
Immigration
NonimmigrantsImmigrantsAfghanistanAfricaAlbaniaArgentinaArmeniaAsiaAustraliaAustriaBahamasBangladeshBarbadosBelarusBelgiumBelizeBoliviaBosnia and HerzegovinaBrazilBulgariaBurma/MyanmarCabo VerdeCambodiaCameroonCanadaCaribbeanCentral AmericaChileChinaColombiaCongoCosta RicaCroatiaCubaCzechoslovakiaDominicaDominican RepublicEastern AfricaEastern AsiaEastern EuropeEcuadorEgyptEl SalvadorEnglandEritreaEthiopiaEuropeFijiFranceGermanyGhanaGreeceGrenadaGuatemalaGuyanaHaitiHondurasHong KongHungaryIndiaIndonesiaIranIraqIrelandIsraelItalyJamaicaJapanJordanKazakhstanKenyaKoreaKuwaitLaosLatin AmericaLatviaLebanonLiberiaLithuaniaMalaysiaMexicoMicronesiaMiddle AfricaMoldovaMoroccoNepalNetherlandsNicaraguaNigeriaNorth AmericaNorth MacedoniaNorthern AfricaNorthern EuropeNorwayOceaniaPakistanPanamaPeruPhilippinesPolandPortugalRomaniaRussiaSaudi ArabiaScotlandSenegalSerbiaSierra LeoneSingaporeSomaliaSouth AfricaSouth AmericaSouth Central AsiaSouth Eastern AsiaSouthern EuropeSpainSri LankaSt. Vincent and the GrenadinesSudanSwedenSwitzerlandSyriaTaiwanThailandTrinidad and TobagoTurkeyUgandaUkraineUruguayUzbekistanVenezuelaVietnamWest IndiesWestern AfricaWestern AsiaWestern EuropeYemenZaireZimbabweAzores
Married-couple Households
Income
Poverty
Unemployment
Labor Participation
Family Structure
Vehicle Availability
Education Level
Disability

Immigrants from Denmark Married-couple Households
Excellent

47.3%
MARRIED-COUPLE HOUSEHOLDS
87.5/ 100
METRIC RATING
131st/ 347
METRIC RANK

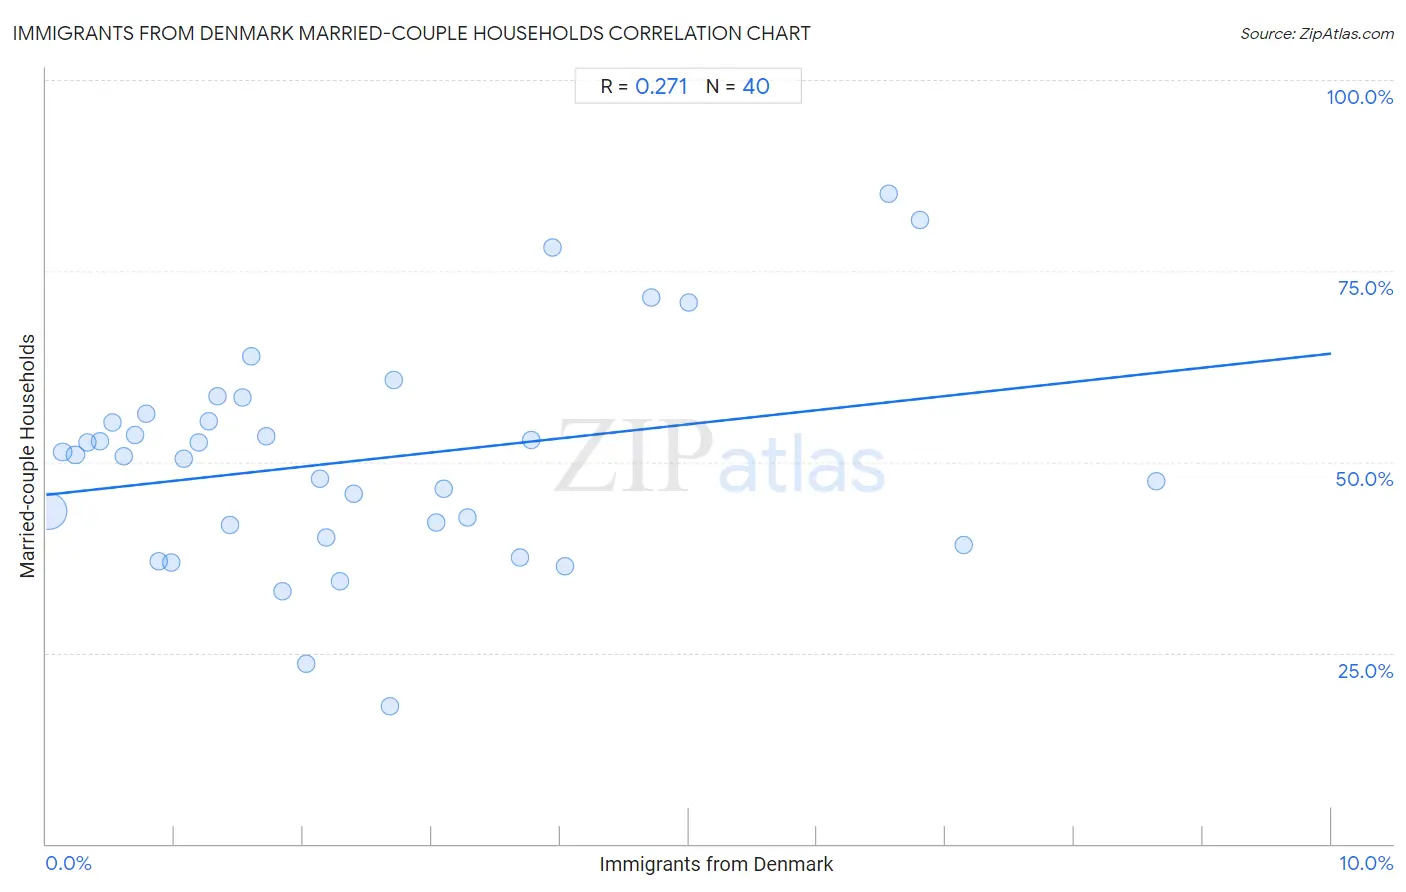
Immigrants from Denmark Married-couple Households Correlation Chart

The statistical analysis conducted on geographies consisting of 136,404,996 people shows a weak positive correlation between the proportion of Immigrants from Denmark and percentage of married-couple family households in the United States with a correlation coefficient (R) of 0.271 and weighted average of 47.3%. On average, for every 1% (one percent) increase in Immigrants from Denmark within a typical geography, there is an increase of 1.9% in percentage of married-couple family households.
Immigrants from Denmark Married-couple Households
It is essential to understand that the correlation between the percentage of Immigrants from Denmark and percentage of married-couple family households does not imply a direct cause-and-effect relationship. It remains uncertain whether the presence of Immigrants from Denmark influences an upward or downward trend in the level of percentage of married-couple family households within an area, or if Immigrants from Denmark simply ended up residing in those areas with higher or lower levels of percentage of married-couple family households due to other factors.

Demographics Similar to Immigrants from Denmark by Married-couple Households

In terms of married-couple households, the demographic groups most similar to Immigrants from Denmark are Immigrants from Iraq (47.3%, a difference of 0.020%), Immigrants from Hungary (47.3%, a difference of 0.020%), Immigrants from Peru (47.3%, a difference of 0.030%), Celtic (47.3%, a difference of 0.050%), and Immigrants from Ukraine (47.3%, a difference of 0.070%).
DemographicsRating | RankMarried-couple Households
Zimbabweans
89.2
/100
|
#124
Excellent
47.4%
Australians
89.0
/100
|
#125
Excellent
47.4%
Pakistanis
88.6
/100
|
#126
Excellent
47.3%
Celtics
88.1
/100
|
#127
Excellent
47.3%
Immigrants from Peru
87.9
/100
|
#128
Excellent
47.3%
Immigrants from Iraq
87.8
/100
|
#129
Excellent
47.3%
Immigrants from Hungary
87.8
/100
|
#130
Excellent
47.3%
Immigrants from Denmark
87.5
/100
|
#131
Excellent
47.3%
Immigrants from Ukraine
86.7
/100
|
#132
Excellent
47.3%
South Africans
86.4
/100
|
#133
Excellent
47.3%
Immigrants from Greece
86.0
/100
|
#134
Excellent
47.2%
Immigrants from Argentina
86.0
/100
|
#135
Excellent
47.2%
New Zealanders
85.3
/100
|
#136
Excellent
47.2%
Immigrants from Malaysia
85.2
/100
|
#137
Excellent
47.2%
Immigrants from Afghanistan
85.1
/100
|
#138
Excellent
47.2%

Immigrants from Denmark Married-couple Households Correlation Summary

MeasurementImmigrants from Denmark DataMarried-couple Households Data
Minimum0.022%18.0%
Maximum8.6%85.1%
Range8.6%67.1%
Mean2.5%50.2%
Median1.9%50.8%
Interquartile 25% (IQ1)0.92%40.9%
Interquartile 75% (IQ3)3.5%55.8%
Interquartile Range (IQR)2.6%14.9%
Standard Deviation (Sample)2.1%14.3%
Standard Deviation (Population)2.1%14.1%

Correlation Details

Immigrants from Denmark PercentileSample SizeMarried-couple Households
[
0.0%
-
0.5%
]
0.022%
125,394,53043.5%
[
0.0%
-
0.5%
]
0.13%
6,846,34851.3%
[
0.0%
-
0.5%
]
0.23%
2,338,29650.9%
[
0.0%
-
0.5%
]
0.32%
663,23352.5%
[
0.0%
-
0.5%
]
0.42%
361,79552.6%
[
0.5%
-
1.0%
]
0.52%
259,81555.2%
[
0.5%
-
1.0%
]
0.60%
245,41950.8%
[
0.5%
-
1.0%
]
0.69%
64,22653.5%
[
0.5%
-
1.0%
]
0.78%
27,81856.4%
[
0.5%
-
1.0%
]
0.88%
28,97136.9%
[
0.5%
-
1.0%
]
0.97%
17,06336.8%
[
1.0%
-
1.5%
]
1.07%
55,56650.5%
[
1.0%
-
1.5%
]
1.19%
6,66552.5%
[
1.0%
-
1.5%
]
1.27%
30,87155.3%
[
1.0%
-
1.5%
]
1.33%
8,33358.6%
[
1.0%
-
1.5%
]
1.43%
10,23341.7%
[
1.5%
-
2.0%
]
1.52%
11,23158.5%
[
1.5%
-
2.0%
]
1.60%
2,50563.8%
[
1.5%
-
2.0%
]
1.71%
8,11853.3%
[
1.5%
-
2.0%
]
1.84%
54433.1%
[
2.0%
-
2.5%
]
2.02%
9923.5%
[
2.0%
-
2.5%
]
2.13%
2,48947.7%
[
2.0%
-
2.5%
]
2.18%
1,37740.2%
[
2.0%
-
2.5%
]
2.28%
3,89634.3%
[
2.0%
-
2.5%
]
2.40%
2,21145.8%
[
2.5%
-
3.0%
]
2.67%
56118.0%
[
2.5%
-
3.0%
]
2.70%
29660.7%
[
3.0%
-
3.5%
]
3.03%
6642.1%
[
3.0%
-
3.5%
]
3.09%
3,74946.4%
[
3.0%
-
3.5%
]
3.28%
39642.8%
[
3.5%
-
4.0%
]
3.69%
21737.5%
[
3.5%
-
4.0%
]
3.77%
2,04052.9%
[
3.5%
-
4.0%
]
3.94%
2,71478.1%
[
4.0%
-
4.5%
]
4.04%
9936.4%
[
4.5%
-
5.0%
]
4.70%
1,23371.5%
[
5.0%
-
5.5%
]
5.00%
4070.8%
[
6.5%
-
7.0%
]
6.56%
12285.1%
[
6.5%
-
7.0%
]
6.80%
1,13281.7%
[
7.0%
-
7.5%
]
7.14%
37839.0%
[
8.5%
-
9.0%
]
8.64%
30147.5%