Black/African American Married-couple Households
COMPARE
Black/African American
Select to Compare
Married-couple Households
Black/African American Married-couple Households
38.5%
MARRIED-COUPLE HOUSEHOLDS
0.0/ 100
METRIC RATING
336th/ 347
METRIC RANK
Black/African American Married-couple Households Correlation Chart
The statistical analysis conducted on geographies consisting of 565,301,242 people shows a near-perfect negative correlation between the proportion of Blacks/African Americans and percentage of married-couple family households in the United States with a correlation coefficient (R) of -0.929 and weighted average of 38.5%. On average, for every 1% (one percent) increase in Blacks/African Americans within a typical geography, there is a decrease of 0.28% in percentage of married-couple family households.
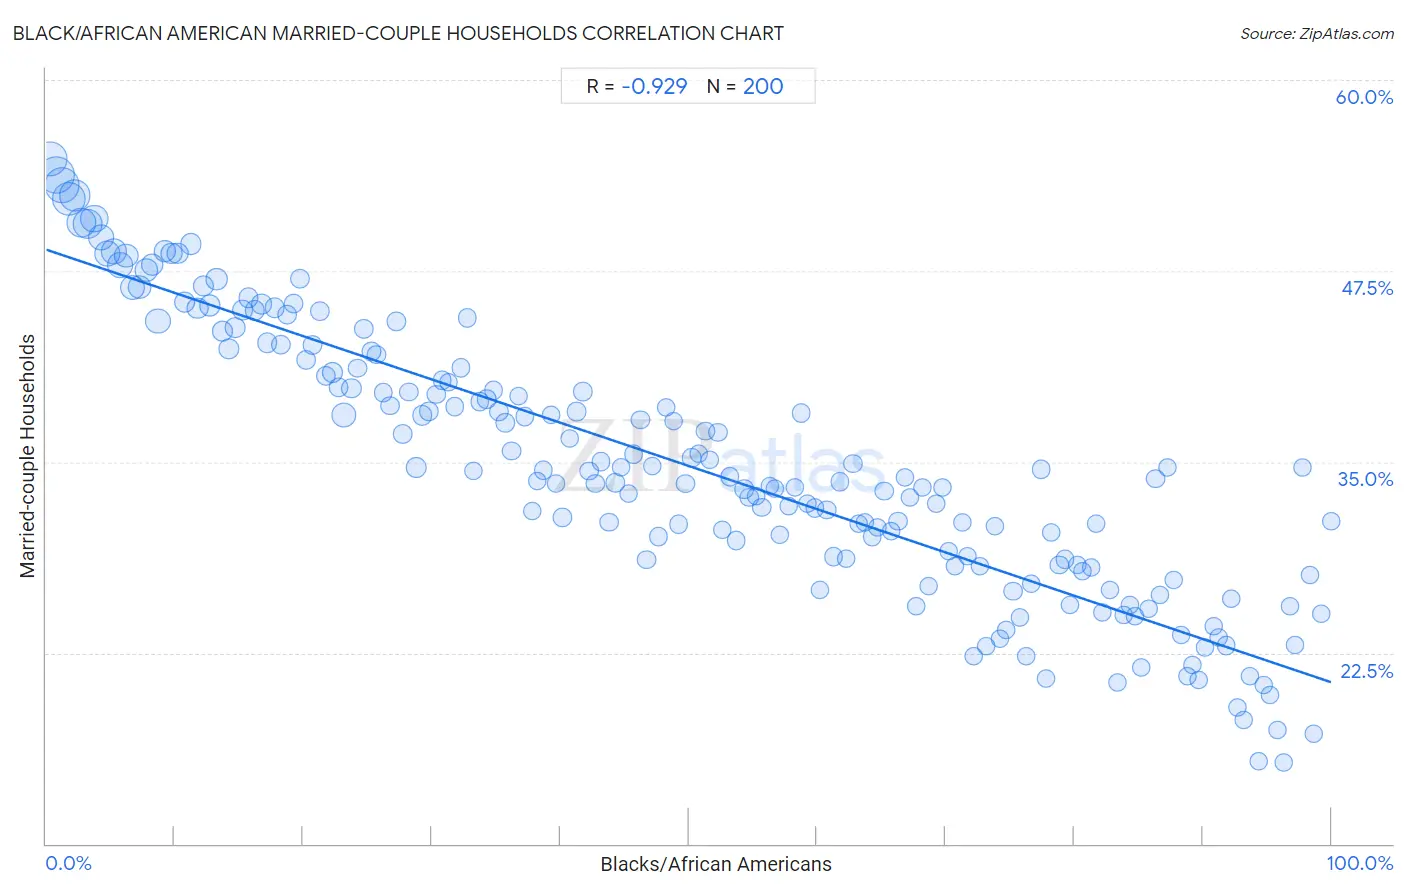
It is essential to understand that the correlation between the percentage of Blacks/African Americans and percentage of married-couple family households does not imply a direct cause-and-effect relationship. It remains uncertain whether the presence of Blacks/African Americans influences an upward or downward trend in the level of percentage of married-couple family households within an area, or if Blacks/African Americans simply ended up residing in those areas with higher or lower levels of percentage of married-couple family households due to other factors.
Demographics Similar to Blacks/African Americans by Married-couple Households
In terms of married-couple households, the demographic groups most similar to Blacks/African Americans are Immigrants from Somalia (38.4%, a difference of 0.14%), Senegalese (38.6%, a difference of 0.18%), Immigrants from Senegal (38.4%, a difference of 0.30%), British West Indian (38.3%, a difference of 0.43%), and Immigrants from St. Vincent and the Grenadines (38.7%, a difference of 0.51%).
| Demographics | Rating | Rank | Married-couple Households |
| Immigrants from Dominica | 0.0 /100 | #329 | Tragic 39.4% |
| Immigrants from Barbados | 0.0 /100 | #330 | Tragic 39.2% |
| Immigrants from Congo | 0.0 /100 | #331 | Tragic 39.0% |
| Somalis | 0.0 /100 | #332 | Tragic 39.0% |
| Immigrants from West Indies | 0.0 /100 | #333 | Tragic 39.0% |
| Immigrants from St. Vincent and the Grenadines | 0.0 /100 | #334 | Tragic 38.7% |
| Senegalese | 0.0 /100 | #335 | Tragic 38.6% |
| Blacks/African Americans | 0.0 /100 | #336 | Tragic 38.5% |
| Immigrants from Somalia | 0.0 /100 | #337 | Tragic 38.4% |
| Immigrants from Senegal | 0.0 /100 | #338 | Tragic 38.4% |
| British West Indians | 0.0 /100 | #339 | Tragic 38.3% |
| Dominicans | 0.0 /100 | #340 | Tragic 38.2% |
| Cape Verdeans | 0.0 /100 | #341 | Tragic 38.1% |
| Tohono O'odham | 0.0 /100 | #342 | Tragic 37.9% |
| Immigrants from Grenada | 0.0 /100 | #343 | Tragic 37.5% |
Black/African American Married-couple Households Correlation Summary
| Measurement | Black/African American Data | Married-couple Households Data |
| Minimum | 0.26% | 15.3% |
| Maximum | 100.0% | 54.8% |
| Range | 99.7% | 39.5% |
| Mean | 50.0% | 34.7% |
| Median | 50.0% | 34.0% |
| Interquartile 25% (IQ1) | 25.0% | 28.3% |
| Interquartile 75% (IQ3) | 75.0% | 41.0% |
| Interquartile Range (IQR) | 49.9% | 12.7% |
| Standard Deviation (Sample) | 28.9% | 8.8% |
| Standard Deviation (Population) | 28.9% | 8.8% |
Correlation Details
| Black/African American Percentile | Sample Size | Married-couple Households |
[ 0.0% - 0.5% ] 0.26% | 30,322,194 | 54.8% |
[ 0.5% - 1.0% ] 0.74% | 35,442,451 | 53.8% |
[ 1.0% - 1.5% ] 1.23% | 32,425,081 | 53.1% |
[ 1.5% - 2.0% ] 1.74% | 28,011,499 | 52.2% |
[ 2.0% - 2.5% ] 2.24% | 24,410,552 | 52.4% |
[ 2.5% - 3.0% ] 2.75% | 20,774,564 | 50.7% |
[ 3.0% - 3.5% ] 3.25% | 20,752,783 | 50.6% |
[ 3.5% - 4.0% ] 3.74% | 16,821,535 | 50.9% |
[ 4.0% - 4.5% ] 4.25% | 14,644,881 | 49.7% |
[ 4.5% - 5.0% ] 4.74% | 14,905,517 | 48.6% |
[ 5.0% - 5.5% ] 5.24% | 13,607,105 | 48.8% |
[ 5.5% - 6.0% ] 5.76% | 13,818,063 | 47.9% |
[ 6.0% - 6.5% ] 6.23% | 11,809,817 | 48.5% |
[ 6.5% - 7.0% ] 6.72% | 11,731,455 | 46.4% |
[ 7.0% - 7.5% ] 7.26% | 11,005,749 | 46.4% |
[ 7.5% - 8.0% ] 7.75% | 9,110,118 | 47.6% |
[ 8.0% - 8.5% ] 8.24% | 8,302,771 | 47.9% |
[ 8.5% - 9.0% ] 8.69% | 12,402,727 | 44.2% |
[ 9.0% - 9.5% ] 9.24% | 7,622,355 | 48.8% |
[ 9.5% - 10.0% ] 9.75% | 5,930,065 | 48.7% |
[ 10.0% - 10.5% ] 10.26% | 6,428,514 | 48.6% |
[ 10.5% - 11.0% ] 10.76% | 6,042,774 | 45.5% |
[ 11.0% - 11.5% ] 11.27% | 6,007,651 | 49.2% |
[ 11.5% - 12.0% ] 11.75% | 6,650,918 | 45.1% |
[ 12.0% - 12.5% ] 12.24% | 5,839,495 | 46.5% |
[ 12.5% - 13.0% ] 12.73% | 5,231,300 | 45.2% |
[ 13.0% - 13.5% ] 13.26% | 5,607,021 | 47.0% |
[ 13.5% - 14.0% ] 13.72% | 4,989,425 | 43.6% |
[ 14.0% - 14.5% ] 14.23% | 4,362,077 | 42.4% |
[ 14.5% - 15.0% ] 14.73% | 4,189,341 | 43.8% |
[ 15.0% - 15.5% ] 15.25% | 4,399,559 | 44.9% |
[ 15.5% - 16.0% ] 15.75% | 3,602,402 | 45.8% |
[ 16.0% - 16.5% ] 16.25% | 3,266,236 | 44.9% |
[ 16.5% - 17.0% ] 16.75% | 3,400,909 | 45.3% |
[ 17.0% - 17.5% ] 17.22% | 3,511,692 | 42.8% |
[ 17.5% - 18.0% ] 17.77% | 3,689,398 | 45.1% |
[ 18.0% - 18.5% ] 18.26% | 3,599,864 | 42.7% |
[ 18.5% - 19.0% ] 18.73% | 3,671,212 | 44.6% |
[ 19.0% - 19.5% ] 19.23% | 3,048,456 | 45.4% |
[ 19.5% - 20.0% ] 19.75% | 2,545,613 | 47.0% |
[ 20.0% - 20.5% ] 20.23% | 2,767,471 | 41.7% |
[ 20.5% - 21.0% ] 20.77% | 2,360,234 | 42.6% |
[ 21.0% - 21.5% ] 21.29% | 2,732,208 | 44.9% |
[ 21.5% - 22.0% ] 21.77% | 3,752,312 | 40.6% |
[ 22.0% - 22.5% ] 22.31% | 4,863,202 | 40.8% |
[ 22.5% - 23.0% ] 22.72% | 3,026,667 | 39.9% |
[ 23.0% - 23.5% ] 23.15% | 11,615,926 | 38.1% |
[ 23.5% - 24.0% ] 23.75% | 3,975,297 | 39.8% |
[ 24.0% - 24.5% ] 24.22% | 2,187,535 | 41.1% |
[ 24.5% - 25.0% ] 24.74% | 1,984,659 | 43.7% |
[ 25.0% - 25.5% ] 25.28% | 1,592,118 | 42.2% |
[ 25.5% - 26.0% ] 25.71% | 1,472,547 | 42.0% |
[ 26.0% - 26.5% ] 26.22% | 1,911,273 | 39.5% |
[ 26.5% - 27.0% ] 26.77% | 2,139,985 | 38.7% |
[ 27.0% - 27.5% ] 27.23% | 1,792,589 | 44.2% |
[ 27.5% - 28.0% ] 27.75% | 1,491,763 | 36.8% |
[ 28.0% - 28.5% ] 28.22% | 1,987,986 | 39.6% |
[ 28.5% - 29.0% ] 28.80% | 4,742,182 | 34.6% |
[ 29.0% - 29.5% ] 29.24% | 3,239,524 | 38.1% |
[ 29.5% - 30.0% ] 29.77% | 1,877,310 | 38.3% |
[ 30.0% - 30.5% ] 30.35% | 2,246,851 | 39.4% |
[ 30.5% - 31.0% ] 30.81% | 1,193,769 | 40.3% |
[ 31.0% - 31.5% ] 31.29% | 966,175 | 40.2% |
[ 31.5% - 32.0% ] 31.79% | 1,019,831 | 38.6% |
[ 32.0% - 32.5% ] 32.27% | 1,275,625 | 41.1% |
[ 32.5% - 33.0% ] 32.74% | 742,247 | 44.4% |
[ 33.0% - 33.5% ] 33.25% | 1,254,323 | 34.4% |
[ 33.5% - 34.0% ] 33.75% | 914,676 | 39.0% |
[ 34.0% - 34.5% ] 34.28% | 833,081 | 39.1% |
[ 34.5% - 35.0% ] 34.79% | 922,089 | 39.7% |
[ 35.0% - 35.5% ] 35.24% | 1,761,843 | 38.3% |
[ 35.5% - 36.0% ] 35.74% | 1,284,696 | 37.6% |
[ 36.0% - 36.5% ] 36.23% | 1,185,532 | 35.7% |
[ 36.5% - 37.0% ] 36.75% | 565,477 | 39.3% |
[ 37.0% - 37.5% ] 37.25% | 923,508 | 38.0% |
[ 37.5% - 38.0% ] 37.80% | 835,939 | 31.8% |
[ 38.0% - 38.5% ] 38.19% | 957,669 | 33.7% |
[ 38.5% - 39.0% ] 38.70% | 1,453,770 | 34.5% |
[ 39.0% - 39.5% ] 39.31% | 537,884 | 38.1% |
[ 39.5% - 40.0% ] 39.68% | 914,534 | 33.6% |
[ 40.0% - 40.5% ] 40.16% | 2,716,360 | 31.4% |
[ 40.5% - 41.0% ] 40.73% | 1,184,209 | 36.6% |
[ 41.0% - 41.5% ] 41.26% | 1,038,664 | 38.3% |
[ 41.5% - 42.0% ] 41.76% | 965,214 | 39.6% |
[ 42.0% - 42.5% ] 42.25% | 887,803 | 34.4% |
[ 42.5% - 43.0% ] 42.73% | 1,022,789 | 33.6% |
[ 43.0% - 43.5% ] 43.19% | 1,016,654 | 35.0% |
[ 43.5% - 44.0% ] 43.82% | 1,002,085 | 31.1% |
[ 44.0% - 44.5% ] 44.29% | 1,188,031 | 33.6% |
[ 44.5% - 45.0% ] 44.74% | 675,983 | 34.6% |
[ 45.0% - 45.5% ] 45.34% | 696,499 | 32.9% |
[ 45.5% - 46.0% ] 45.74% | 601,832 | 35.5% |
[ 46.0% - 46.5% ] 46.24% | 747,675 | 37.7% |
[ 46.5% - 47.0% ] 46.72% | 1,077,043 | 28.6% |
[ 47.0% - 47.5% ] 47.16% | 749,610 | 34.7% |
[ 47.5% - 48.0% ] 47.65% | 1,075,322 | 30.1% |
[ 48.0% - 48.5% ] 48.26% | 305,491 | 38.6% |
[ 48.5% - 49.0% ] 48.84% | 491,308 | 37.7% |
[ 49.0% - 49.5% ] 49.23% | 487,662 | 30.9% |
[ 49.5% - 50.0% ] 49.74% | 552,293 | 33.6% |
[ 50.0% - 50.5% ] 50.24% | 941,781 | 35.3% |
[ 50.5% - 51.0% ] 50.77% | 202,827 | 35.5% |
[ 51.0% - 51.5% ] 51.29% | 576,643 | 37.0% |
[ 51.5% - 52.0% ] 51.63% | 661,242 | 35.2% |
[ 52.0% - 52.5% ] 52.28% | 538,807 | 36.9% |
[ 52.5% - 53.0% ] 52.63% | 675,996 | 30.6% |
[ 53.0% - 53.5% ] 53.22% | 700,323 | 34.0% |
[ 53.5% - 54.0% ] 53.72% | 388,718 | 29.9% |
[ 54.0% - 54.5% ] 54.32% | 689,790 | 33.2% |
[ 54.5% - 55.0% ] 54.71% | 357,838 | 32.7% |
[ 55.0% - 55.5% ] 55.28% | 449,249 | 32.8% |
[ 55.5% - 56.0% ] 55.69% | 469,176 | 32.0% |
[ 56.0% - 56.5% ] 56.31% | 565,649 | 33.4% |
[ 56.5% - 57.0% ] 56.67% | 515,797 | 33.2% |
[ 57.0% - 57.5% ] 57.10% | 688,301 | 30.2% |
[ 57.5% - 58.0% ] 57.77% | 317,872 | 32.1% |
[ 58.0% - 58.5% ] 58.25% | 369,284 | 33.3% |
[ 58.5% - 59.0% ] 58.76% | 288,938 | 38.2% |
[ 59.0% - 59.5% ] 59.21% | 338,353 | 32.3% |
[ 59.5% - 60.0% ] 59.79% | 366,465 | 32.0% |
[ 60.0% - 60.5% ] 60.22% | 272,392 | 26.6% |
[ 60.5% - 61.0% ] 60.74% | 455,585 | 31.9% |
[ 61.0% - 61.5% ] 61.26% | 881,467 | 28.8% |
[ 61.5% - 62.0% ] 61.73% | 425,819 | 33.7% |
[ 62.0% - 62.5% ] 62.27% | 437,646 | 28.6% |
[ 62.5% - 63.0% ] 62.78% | 517,897 | 34.9% |
[ 63.0% - 63.5% ] 63.24% | 302,198 | 30.9% |
[ 63.5% - 64.0% ] 63.75% | 418,331 | 31.0% |
[ 64.0% - 64.5% ] 64.30% | 1,054,728 | 30.1% |
[ 64.5% - 65.0% ] 64.71% | 329,795 | 30.7% |
[ 65.0% - 65.5% ] 65.21% | 552,042 | 33.1% |
[ 65.5% - 66.0% ] 65.77% | 281,184 | 30.4% |
[ 66.0% - 66.5% ] 66.29% | 270,593 | 31.1% |
[ 66.5% - 67.0% ] 66.83% | 340,782 | 34.0% |
[ 67.0% - 67.5% ] 67.20% | 242,769 | 32.6% |
[ 67.5% - 68.0% ] 67.68% | 192,505 | 25.5% |
[ 68.0% - 68.5% ] 68.16% | 157,947 | 33.3% |
[ 68.5% - 69.0% ] 68.63% | 498,971 | 26.9% |
[ 69.0% - 69.5% ] 69.27% | 207,399 | 32.3% |
[ 69.5% - 70.0% ] 69.77% | 133,688 | 33.3% |
[ 70.0% - 70.5% ] 70.26% | 277,248 | 29.2% |
[ 70.5% - 71.0% ] 70.70% | 389,240 | 28.2% |
[ 71.0% - 71.5% ] 71.27% | 304,156 | 31.0% |
[ 71.5% - 72.0% ] 71.71% | 226,310 | 28.8% |
[ 72.0% - 72.5% ] 72.20% | 237,316 | 22.3% |
[ 72.5% - 73.0% ] 72.65% | 183,039 | 28.2% |
[ 73.0% - 73.5% ] 73.16% | 265,369 | 22.9% |
[ 73.5% - 74.0% ] 73.78% | 357,875 | 30.8% |
[ 74.0% - 74.5% ] 74.25% | 250,538 | 23.4% |
[ 74.5% - 75.0% ] 74.67% | 279,597 | 24.0% |
[ 75.0% - 75.5% ] 75.24% | 180,741 | 26.6% |
[ 75.5% - 76.0% ] 75.77% | 256,101 | 24.8% |
[ 76.0% - 76.5% ] 76.30% | 238,911 | 22.3% |
[ 76.5% - 77.0% ] 76.66% | 115,725 | 27.0% |
[ 77.0% - 77.5% ] 77.38% | 232,771 | 34.5% |
[ 77.5% - 78.0% ] 77.78% | 840,919 | 20.8% |
[ 78.0% - 78.5% ] 78.22% | 231,093 | 30.3% |
[ 78.5% - 79.0% ] 78.83% | 262,828 | 28.3% |
[ 79.0% - 79.5% ] 79.27% | 273,552 | 28.6% |
[ 79.5% - 80.0% ] 79.70% | 131,846 | 25.6% |
[ 80.0% - 80.5% ] 80.21% | 288,612 | 28.3% |
[ 80.5% - 81.0% ] 80.65% | 233,365 | 27.9% |
[ 81.0% - 81.5% ] 81.29% | 241,640 | 28.1% |
[ 81.5% - 82.0% ] 81.68% | 300,828 | 31.0% |
[ 82.0% - 82.5% ] 82.19% | 444,388 | 25.2% |
[ 82.5% - 83.0% ] 82.75% | 167,206 | 26.7% |
[ 83.0% - 83.5% ] 83.34% | 88,676 | 20.6% |
[ 83.5% - 84.0% ] 83.87% | 65,425 | 24.9% |
[ 84.0% - 84.5% ] 84.33% | 187,741 | 25.6% |
[ 84.5% - 85.0% ] 84.73% | 167,312 | 24.9% |
[ 85.0% - 85.5% ] 85.25% | 144,530 | 21.6% |
[ 85.5% - 86.0% ] 85.78% | 143,948 | 25.4% |
[ 86.0% - 86.5% ] 86.33% | 145,273 | 33.9% |
[ 86.5% - 87.0% ] 86.65% | 271,251 | 26.3% |
[ 87.0% - 87.5% ] 87.27% | 177,423 | 34.7% |
[ 87.5% - 88.0% ] 87.74% | 209,877 | 27.3% |
[ 88.0% - 88.5% ] 88.28% | 150,038 | 23.7% |
[ 88.5% - 89.0% ] 88.77% | 205,121 | 21.0% |
[ 89.0% - 89.5% ] 89.16% | 154,571 | 21.7% |
[ 89.5% - 90.0% ] 89.70% | 226,619 | 20.7% |
[ 90.0% - 90.5% ] 90.19% | 89,807 | 22.9% |
[ 90.5% - 91.0% ] 90.87% | 107,897 | 24.3% |
[ 91.0% - 91.5% ] 91.23% | 372,370 | 23.5% |
[ 91.5% - 92.0% ] 91.80% | 140,920 | 23.0% |
[ 92.0% - 92.5% ] 92.26% | 98,833 | 26.1% |
[ 92.5% - 93.0% ] 92.70% | 162,398 | 18.9% |
[ 93.0% - 93.5% ] 93.22% | 188,401 | 18.1% |
[ 93.5% - 94.0% ] 93.70% | 269,491 | 21.0% |
[ 94.0% - 94.5% ] 94.37% | 118,711 | 15.4% |
[ 94.5% - 95.0% ] 94.72% | 106,931 | 20.4% |
[ 95.0% - 95.5% ] 95.23% | 87,287 | 19.7% |
[ 95.5% - 96.0% ] 95.80% | 80,782 | 17.5% |
[ 96.0% - 96.5% ] 96.26% | 46,388 | 15.3% |
[ 96.5% - 97.0% ] 96.82% | 15,684 | 25.5% |
[ 97.0% - 97.5% ] 97.19% | 4,949 | 23.0% |
[ 97.5% - 98.0% ] 97.81% | 4,701 | 34.7% |
[ 98.0% - 98.5% ] 98.32% | 10,639 | 27.6% |
[ 98.5% - 99.0% ] 98.63% | 16,256 | 17.2% |
[ 99.0% - 99.5% ] 99.22% | 15,089 | 25.0% |
[ 99.5% - 100.0% ] 99.96% | 17,929 | 31.1% |