Yuman Married-couple Households

COMPARE

Yuman
Race
Ancestry
AfghanAfricanAlaska NativeAlaskan AthabascanAlbanianAleutAlsatianAmericanApacheArabArapahoArgentineanArmenianAssyrian/Chaldean/SyriacAustralianAustrianBahamianBangladeshiBarbadianBasqueBelgianBelizeanBermudanBhutaneseBlackfeetBolivianBrazilianBritishBritish West IndianBulgarianBurmeseCajunCambodianCanadianCape VerdeanCarpatho RusynCelticCentral AmericanCentral American IndianCherokeeCheyenneChickasawChileanChineseChippewaChoctawColombianColvilleComancheCosta RicanCreeCreekCroatianCrowCubanCypriotCzechCzechoslovakianDanishDelawareDominicanDutchDutch West IndianEastern EuropeanEcuadorianEgyptianEnglishEstonianEthiopianEuropeanFijianFilipinoFinnishFrenchFrench American IndianFrench CanadianGermanGerman RussianGhanaianGreekGuamanian/ChamorroGuatemalanGuyaneseHaitianHmongHonduranHopiHoumaHungarianIcelanderIndian (Asian)IndonesianInupiatIranianIraqiIrishIroquoisIsraeliItalianJamaicanJapaneseJordanianKenyanKiowaKoreanLaotianLatvianLebaneseLiberianLithuanianLumbeeLuxembourgerMacedonianMalaysianMalteseMarshalleseMenomineeMexicanMexican American IndianMongolianMoroccanNative HawaiianNavajoNepaleseNew ZealanderNicaraguanNigerianNorthern EuropeanNorwegianOkinawanOsageOttawaPaiutePakistaniPalestinianPanamanianParaguayanPennsylvania GermanPeruvianPimaPolishPortuguesePotawatomiPuebloPuerto RicanPuget Sound SalishRomanianRussianSalvadoranSamoanScandinavianScotch-IrishScottishSeminoleSenegaleseSerbianShoshoneSierra LeoneanSiouxSlavicSlovakSloveneSomaliSouth AfricanSouth AmericanSouth American IndianSoviet UnionSpaniardSpanishSpanish AmericanSpanish American IndianSri LankanSubsaharan AfricanSudaneseSwedishSwissSyrianTaiwaneseThaiTlingit-HaidaTohono O'OdhamTonganTrinidadian and TobagonianTsimshianTurkishU.S. Virgin IslanderUgandanUkrainianUruguayanUteVenezuelanVietnameseWelshWest IndianYakamaYaquiYugoslavianYumanYup'ikZimbabwean
Immigration
NonimmigrantsImmigrantsAfghanistanAfricaAlbaniaArgentinaArmeniaAsiaAustraliaAustriaBahamasBangladeshBarbadosBelarusBelgiumBelizeBoliviaBosnia and HerzegovinaBrazilBulgariaBurma/MyanmarCabo VerdeCambodiaCameroonCanadaCaribbeanCentral AmericaChileChinaColombiaCongoCosta RicaCroatiaCubaCzechoslovakiaDenmarkDominicaDominican RepublicEastern AfricaEastern AsiaEastern EuropeEcuadorEgyptEl SalvadorEnglandEritreaEthiopiaEuropeFijiFranceGermanyGhanaGreeceGrenadaGuatemalaGuyanaHaitiHondurasHong KongHungaryIndiaIndonesiaIranIraqIrelandIsraelItalyJamaicaJapanJordanKazakhstanKenyaKoreaKuwaitLaosLatin AmericaLatviaLebanonLiberiaLithuaniaMalaysiaMexicoMicronesiaMiddle AfricaMoldovaMoroccoNepalNetherlandsNicaraguaNigeriaNorth AmericaNorth MacedoniaNorthern AfricaNorthern EuropeNorwayOceaniaPakistanPanamaPeruPhilippinesPolandPortugalRomaniaRussiaSaudi ArabiaScotlandSenegalSerbiaSierra LeoneSingaporeSomaliaSouth AfricaSouth AmericaSouth Central AsiaSouth Eastern AsiaSouthern EuropeSpainSri LankaSt. Vincent and the GrenadinesSudanSwedenSwitzerlandSyriaTaiwanThailandTrinidad and TobagoTurkeyUgandaUkraineUruguayUzbekistanVenezuelaVietnamWest IndiesWestern AfricaWestern AsiaWestern EuropeYemenZaireZimbabweAzores
Select to Compare
Race
Ancestry
AfghanAfricanAlaska NativeAlaskan AthabascanAlbanianAleutAlsatianAmericanApacheArabArapahoArgentineanArmenianAssyrian/Chaldean/SyriacAustralianAustrianBahamianBangladeshiBarbadianBasqueBelgianBelizeanBermudanBhutaneseBlackfeetBolivianBrazilianBritishBritish West IndianBulgarianBurmeseCajunCambodianCanadianCape VerdeanCarpatho RusynCelticCentral AmericanCentral American IndianCherokeeCheyenneChickasawChileanChineseChippewaChoctawColombianColvilleComancheCosta RicanCreeCreekCroatianCrowCubanCypriotCzechCzechoslovakianDanishDelawareDominicanDutchDutch West IndianEastern EuropeanEcuadorianEgyptianEnglishEstonianEthiopianEuropeanFijianFilipinoFinnishFrenchFrench American IndianFrench CanadianGermanGerman RussianGhanaianGreekGuamanian/ChamorroGuatemalanGuyaneseHaitianHmongHonduranHopiHoumaHungarianIcelanderIndian (Asian)IndonesianInupiatIranianIraqiIrishIroquoisIsraeliItalianJamaicanJapaneseJordanianKenyanKiowaKoreanLaotianLatvianLebaneseLiberianLithuanianLumbeeLuxembourgerMacedonianMalaysianMalteseMarshalleseMenomineeMexicanMexican American IndianMongolianMoroccanNative HawaiianNavajoNepaleseNew ZealanderNicaraguanNigerianNorthern EuropeanNorwegianOkinawanOsageOttawaPaiutePakistaniPalestinianPanamanianParaguayanPennsylvania GermanPeruvianPimaPolishPortuguesePotawatomiPuebloPuerto RicanPuget Sound SalishRomanianRussianSalvadoranSamoanScandinavianScotch-IrishScottishSeminoleSenegaleseSerbianShoshoneSierra LeoneanSiouxSlavicSlovakSloveneSomaliSouth AfricanSouth AmericanSouth American IndianSoviet UnionSpaniardSpanishSpanish AmericanSpanish American IndianSri LankanSubsaharan AfricanSudaneseSwedishSwissSyrianTaiwaneseThaiTlingit-HaidaTohono O'OdhamTonganTrinidadian and TobagonianTsimshianTurkishU.S. Virgin IslanderUgandanUkrainianUruguayanUteVenezuelanVietnameseWelshWest IndianYakamaYaquiYugoslavianYup'ikZimbabwean
Immigration
NonimmigrantsImmigrantsAfghanistanAfricaAlbaniaArgentinaArmeniaAsiaAustraliaAustriaBahamasBangladeshBarbadosBelarusBelgiumBelizeBoliviaBosnia and HerzegovinaBrazilBulgariaBurma/MyanmarCabo VerdeCambodiaCameroonCanadaCaribbeanCentral AmericaChileChinaColombiaCongoCosta RicaCroatiaCubaCzechoslovakiaDenmarkDominicaDominican RepublicEastern AfricaEastern AsiaEastern EuropeEcuadorEgyptEl SalvadorEnglandEritreaEthiopiaEuropeFijiFranceGermanyGhanaGreeceGrenadaGuatemalaGuyanaHaitiHondurasHong KongHungaryIndiaIndonesiaIranIraqIrelandIsraelItalyJamaicaJapanJordanKazakhstanKenyaKoreaKuwaitLaosLatin AmericaLatviaLebanonLiberiaLithuaniaMalaysiaMexicoMicronesiaMiddle AfricaMoldovaMoroccoNepalNetherlandsNicaraguaNigeriaNorth AmericaNorth MacedoniaNorthern AfricaNorthern EuropeNorwayOceaniaPakistanPanamaPeruPhilippinesPolandPortugalRomaniaRussiaSaudi ArabiaScotlandSenegalSerbiaSierra LeoneSingaporeSomaliaSouth AfricaSouth AmericaSouth Central AsiaSouth Eastern AsiaSouthern EuropeSpainSri LankaSt. Vincent and the GrenadinesSudanSwedenSwitzerlandSyriaTaiwanThailandTrinidad and TobagoTurkeyUgandaUkraineUruguayUzbekistanVenezuelaVietnamWest IndiesWestern AfricaWestern AsiaWestern EuropeYemenZaireZimbabweAzores
Married-couple Households
Income
Poverty
Unemployment
Labor Participation
Family Structure
Vehicle Availability
Education Level
Disability

Yuman Married-couple Households
Tragic

43.3%
MARRIED-COUPLE HOUSEHOLDS
0.1/ 100
METRIC RATING
270th/ 347
METRIC RANK

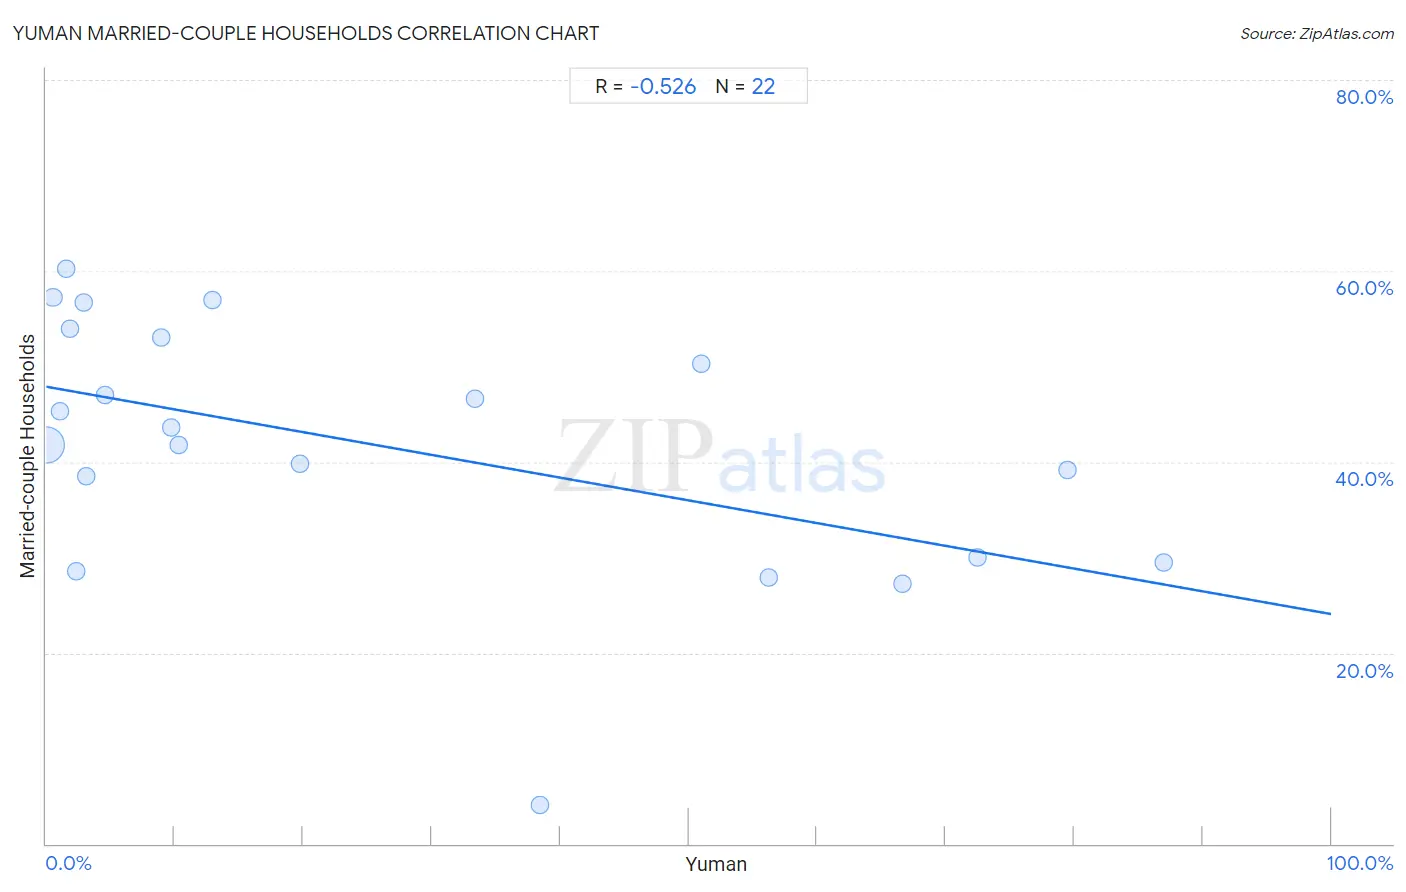
Yuman Married-couple Households Correlation Chart

The statistical analysis conducted on geographies consisting of 40,663,496 people shows a substantial negative correlation between the proportion of Yuman and percentage of married-couple family households in the United States with a correlation coefficient (R) of -0.526 and weighted average of 43.3%. On average, for every 1% (one percent) increase in Yuman within a typical geography, there is a decrease of 0.24% in percentage of married-couple family households.
Yuman Married-couple Households
It is essential to understand that the correlation between the percentage of Yuman and percentage of married-couple family households does not imply a direct cause-and-effect relationship. It remains uncertain whether the presence of Yuman influences an upward or downward trend in the level of percentage of married-couple family households within an area, or if Yuman simply ended up residing in those areas with higher or lower levels of percentage of married-couple family households due to other factors.

Demographics Similar to Yuman by Married-couple Households

In terms of married-couple households, the demographic groups most similar to Yuman are Immigrants from Sierra Leone (43.3%, a difference of 0.050%), Guatemalan (43.3%, a difference of 0.11%), Immigrants from Nigeria (43.2%, a difference of 0.21%), Immigrants from Burma/Myanmar (43.4%, a difference of 0.25%), and Ethiopian (43.2%, a difference of 0.31%).
DemographicsRating | RankMarried-couple Households
Cree
0.1
/100
|
#263
Tragic
43.6%
Bangladeshis
0.1
/100
|
#264
Tragic
43.5%
Moroccans
0.1
/100
|
#265
Tragic
43.5%
Ecuadorians
0.1
/100
|
#266
Tragic
43.5%
Natives/Alaskans
0.1
/100
|
#267
Tragic
43.5%
Immigrants from Burma/Myanmar
0.1
/100
|
#268
Tragic
43.4%
Immigrants from Sierra Leone
0.1
/100
|
#269
Tragic
43.3%
Yuman
0.1
/100
|
#270
Tragic
43.3%
Guatemalans
0.1
/100
|
#271
Tragic
43.3%
Immigrants from Nigeria
0.1
/100
|
#272
Tragic
43.2%
Ethiopians
0.1
/100
|
#273
Tragic
43.2%
Nigerians
0.1
/100
|
#274
Tragic
43.2%
Immigrants from Bangladesh
0.0
/100
|
#275
Tragic
43.1%
Immigrants from Ethiopia
0.0
/100
|
#276
Tragic
43.1%
Immigrants from Eastern Africa
0.0
/100
|
#277
Tragic
42.9%

Yuman Married-couple Households Correlation Summary

MeasurementYuman DataMarried-couple Households Data
Minimum0.022%4.1%
Maximum87.0%60.2%
Range86.9%56.2%
Mean25.6%41.8%
Median10.1%42.7%
Interquartile 25% (IQ1)2.3%30.0%
Interquartile 75% (IQ3)51.0%53.1%
Interquartile Range (IQR)48.6%23.0%
Standard Deviation (Sample)29.6%13.4%
Standard Deviation (Population)28.9%13.1%

Correlation Details

Yuman PercentileSample SizeMarried-couple Households
[
0.0%
-
0.5%
]
0.022%
40,016,77141.7%
[
0.5%
-
1.0%
]
0.52%
507,49357.2%
[
1.0%
-
1.5%
]
1.04%
48,66945.3%
[
1.5%
-
2.0%
]
1.60%
29,60960.2%
[
1.5%
-
2.0%
]
1.84%
3,52953.9%
[
2.0%
-
2.5%
]
2.32%
68928.5%
[
2.5%
-
3.0%
]
2.97%
19,48856.7%
[
3.0%
-
3.5%
]
3.14%
9,10638.4%
[
4.5%
-
5.0%
]
4.53%
9,11947.0%
[
8.5%
-
9.0%
]
8.92%
52753.1%
[
9.5%
-
10.0%
]
9.75%
5,44743.6%
[
10.0%
-
10.5%
]
10.35%
5,06241.7%
[
12.5%
-
13.0%
]
12.98%
36257.0%
[
19.5%
-
20.0%
]
19.71%
1,37039.8%
[
33.0%
-
33.5%
]
33.33%
12046.7%
[
38.0%
-
38.5%
]
38.46%
1044.1%
[
50.5%
-
51.0%
]
50.95%
63050.2%
[
56.0%
-
56.5%
]
56.23%
1,96727.9%
[
66.5%
-
67.0%
]
66.67%
3927.3%
[
72.0%
-
72.5%
]
72.47%
1,86730.0%
[
79.0%
-
79.5%
]
79.49%
1,48239.2%
[
86.5%
-
87.0%
]
86.96%
4629.4%