Immigrants from Cabo Verde Married-couple Households

COMPARE

Immigrants from Cabo Verde
Race
Ancestry
AfghanAfricanAlaska NativeAlaskan AthabascanAlbanianAleutAlsatianAmericanApacheArabArapahoArgentineanArmenianAssyrian/Chaldean/SyriacAustralianAustrianBahamianBangladeshiBarbadianBasqueBelgianBelizeanBermudanBhutaneseBlackfeetBolivianBrazilianBritishBritish West IndianBulgarianBurmeseCajunCambodianCanadianCape VerdeanCarpatho RusynCelticCentral AmericanCentral American IndianCherokeeCheyenneChickasawChileanChineseChippewaChoctawColombianColvilleComancheCosta RicanCreeCreekCroatianCrowCubanCypriotCzechCzechoslovakianDanishDelawareDominicanDutchDutch West IndianEastern EuropeanEcuadorianEgyptianEnglishEstonianEthiopianEuropeanFijianFilipinoFinnishFrenchFrench American IndianFrench CanadianGermanGerman RussianGhanaianGreekGuamanian/ChamorroGuatemalanGuyaneseHaitianHmongHonduranHopiHoumaHungarianIcelanderIndian (Asian)IndonesianInupiatIranianIraqiIrishIroquoisIsraeliItalianJamaicanJapaneseJordanianKenyanKiowaKoreanLaotianLatvianLebaneseLiberianLithuanianLumbeeLuxembourgerMacedonianMalaysianMalteseMarshalleseMenomineeMexicanMexican American IndianMongolianMoroccanNative HawaiianNavajoNepaleseNew ZealanderNicaraguanNigerianNorthern EuropeanNorwegianOkinawanOsageOttawaPaiutePakistaniPalestinianPanamanianParaguayanPennsylvania GermanPeruvianPimaPolishPortuguesePotawatomiPuebloPuerto RicanPuget Sound SalishRomanianRussianSalvadoranSamoanScandinavianScotch-IrishScottishSeminoleSenegaleseSerbianShoshoneSierra LeoneanSiouxSlavicSlovakSloveneSomaliSouth AfricanSouth AmericanSouth American IndianSoviet UnionSpaniardSpanishSpanish AmericanSpanish American IndianSri LankanSubsaharan AfricanSudaneseSwedishSwissSyrianTaiwaneseThaiTlingit-HaidaTohono O'OdhamTonganTrinidadian and TobagonianTsimshianTurkishU.S. Virgin IslanderUgandanUkrainianUruguayanUteVenezuelanVietnameseWelshWest IndianYakamaYaquiYugoslavianYumanYup'ikZimbabwean
Immigration
NonimmigrantsImmigrantsAfghanistanAfricaAlbaniaArgentinaArmeniaAsiaAustraliaAustriaBahamasBangladeshBarbadosBelarusBelgiumBelizeBoliviaBosnia and HerzegovinaBrazilBulgariaBurma/MyanmarCabo VerdeCambodiaCameroonCanadaCaribbeanCentral AmericaChileChinaColombiaCongoCosta RicaCroatiaCubaCzechoslovakiaDenmarkDominicaDominican RepublicEastern AfricaEastern AsiaEastern EuropeEcuadorEgyptEl SalvadorEnglandEritreaEthiopiaEuropeFijiFranceGermanyGhanaGreeceGrenadaGuatemalaGuyanaHaitiHondurasHong KongHungaryIndiaIndonesiaIranIraqIrelandIsraelItalyJamaicaJapanJordanKazakhstanKenyaKoreaKuwaitLaosLatin AmericaLatviaLebanonLiberiaLithuaniaMalaysiaMexicoMicronesiaMiddle AfricaMoldovaMoroccoNepalNetherlandsNicaraguaNigeriaNorth AmericaNorth MacedoniaNorthern AfricaNorthern EuropeNorwayOceaniaPakistanPanamaPeruPhilippinesPolandPortugalRomaniaRussiaSaudi ArabiaScotlandSenegalSerbiaSierra LeoneSingaporeSomaliaSouth AfricaSouth AmericaSouth Central AsiaSouth Eastern AsiaSouthern EuropeSpainSri LankaSt. Vincent and the GrenadinesSudanSwedenSwitzerlandSyriaTaiwanThailandTrinidad and TobagoTurkeyUgandaUkraineUruguayUzbekistanVenezuelaVietnamWest IndiesWestern AfricaWestern AsiaWestern EuropeYemenZaireZimbabweAzores
Select to Compare
Race
Ancestry
AfghanAfricanAlaska NativeAlaskan AthabascanAlbanianAleutAlsatianAmericanApacheArabArapahoArgentineanArmenianAssyrian/Chaldean/SyriacAustralianAustrianBahamianBangladeshiBarbadianBasqueBelgianBelizeanBermudanBhutaneseBlackfeetBolivianBrazilianBritishBritish West IndianBulgarianBurmeseCajunCambodianCanadianCape VerdeanCarpatho RusynCelticCentral AmericanCentral American IndianCherokeeCheyenneChickasawChileanChineseChippewaChoctawColombianColvilleComancheCosta RicanCreeCreekCroatianCrowCubanCypriotCzechCzechoslovakianDanishDelawareDominicanDutchDutch West IndianEastern EuropeanEcuadorianEgyptianEnglishEstonianEthiopianEuropeanFijianFilipinoFinnishFrenchFrench American IndianFrench CanadianGermanGerman RussianGhanaianGreekGuamanian/ChamorroGuatemalanGuyaneseHaitianHmongHonduranHopiHoumaHungarianIcelanderIndian (Asian)IndonesianInupiatIranianIraqiIrishIroquoisIsraeliItalianJamaicanJapaneseJordanianKenyanKiowaKoreanLaotianLatvianLebaneseLiberianLithuanianLumbeeLuxembourgerMacedonianMalaysianMalteseMarshalleseMenomineeMexicanMexican American IndianMongolianMoroccanNative HawaiianNavajoNepaleseNew ZealanderNicaraguanNigerianNorthern EuropeanNorwegianOkinawanOsageOttawaPaiutePakistaniPalestinianPanamanianParaguayanPennsylvania GermanPeruvianPimaPolishPortuguesePotawatomiPuebloPuerto RicanPuget Sound SalishRomanianRussianSalvadoranSamoanScandinavianScotch-IrishScottishSeminoleSenegaleseSerbianShoshoneSierra LeoneanSiouxSlavicSlovakSloveneSomaliSouth AfricanSouth AmericanSouth American IndianSoviet UnionSpaniardSpanishSpanish AmericanSpanish American IndianSri LankanSubsaharan AfricanSudaneseSwedishSwissSyrianTaiwaneseThaiTlingit-HaidaTohono O'OdhamTonganTrinidadian and TobagonianTsimshianTurkishU.S. Virgin IslanderUgandanUkrainianUruguayanUteVenezuelanVietnameseWelshWest IndianYakamaYaquiYugoslavianYumanYup'ikZimbabwean
Immigration
NonimmigrantsImmigrantsAfghanistanAfricaAlbaniaArgentinaArmeniaAsiaAustraliaAustriaBahamasBangladeshBarbadosBelarusBelgiumBelizeBoliviaBosnia and HerzegovinaBrazilBulgariaBurma/MyanmarCambodiaCameroonCanadaCaribbeanCentral AmericaChileChinaColombiaCongoCosta RicaCroatiaCubaCzechoslovakiaDenmarkDominicaDominican RepublicEastern AfricaEastern AsiaEastern EuropeEcuadorEgyptEl SalvadorEnglandEritreaEthiopiaEuropeFijiFranceGermanyGhanaGreeceGrenadaGuatemalaGuyanaHaitiHondurasHong KongHungaryIndiaIndonesiaIranIraqIrelandIsraelItalyJamaicaJapanJordanKazakhstanKenyaKoreaKuwaitLaosLatin AmericaLatviaLebanonLiberiaLithuaniaMalaysiaMexicoMicronesiaMiddle AfricaMoldovaMoroccoNepalNetherlandsNicaraguaNigeriaNorth AmericaNorth MacedoniaNorthern AfricaNorthern EuropeNorwayOceaniaPakistanPanamaPeruPhilippinesPolandPortugalRomaniaRussiaSaudi ArabiaScotlandSenegalSerbiaSierra LeoneSingaporeSomaliaSouth AfricaSouth AmericaSouth Central AsiaSouth Eastern AsiaSouthern EuropeSpainSri LankaSt. Vincent and the GrenadinesSudanSwedenSwitzerlandSyriaTaiwanThailandTrinidad and TobagoTurkeyUgandaUkraineUruguayUzbekistanVenezuelaVietnamWest IndiesWestern AfricaWestern AsiaWestern EuropeYemenZaireZimbabweAzores
Married-couple Households
Income
Poverty
Unemployment
Labor Participation
Family Structure
Vehicle Availability
Education Level
Disability

Immigrants from Cabo Verde Married-couple Households
Tragic

36.2%
MARRIED-COUPLE HOUSEHOLDS
0.0/ 100
METRIC RATING
346th/ 347
METRIC RANK

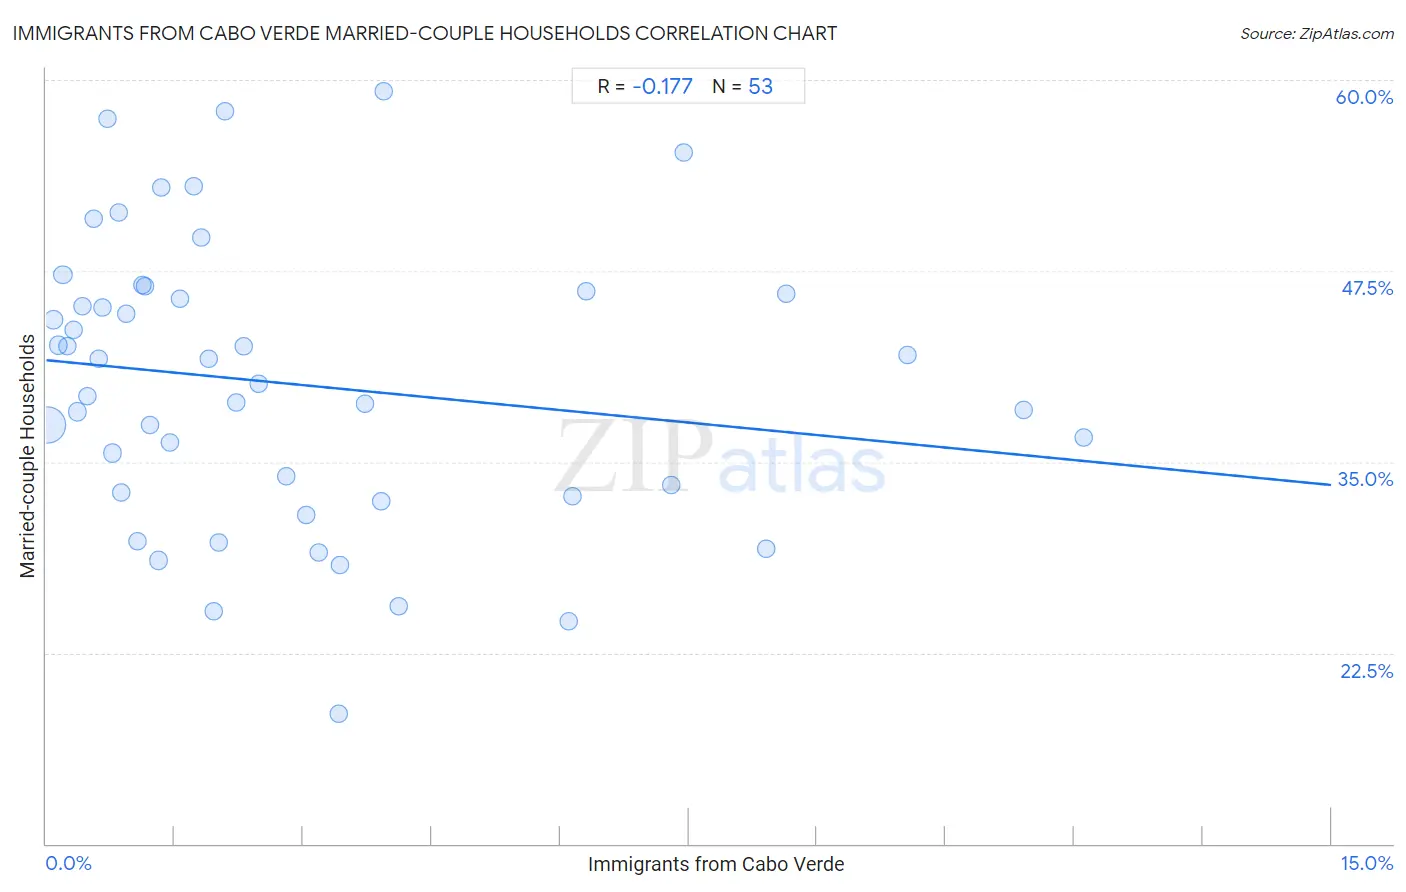
Immigrants from Cabo Verde Married-couple Households Correlation Chart

The statistical analysis conducted on geographies consisting of 38,131,070 people shows a poor negative correlation between the proportion of Immigrants from Cabo Verde and percentage of married-couple family households in the United States with a correlation coefficient (R) of -0.177 and weighted average of 36.2%. On average, for every 1% (one percent) increase in Immigrants from Cabo Verde within a typical geography, there is a decrease of 0.54% in percentage of married-couple family households.
Immigrants from Cabo Verde Married-couple Households
It is essential to understand that the correlation between the percentage of Immigrants from Cabo Verde and percentage of married-couple family households does not imply a direct cause-and-effect relationship. It remains uncertain whether the presence of Immigrants from Cabo Verde influences an upward or downward trend in the level of percentage of married-couple family households within an area, or if Immigrants from Cabo Verde simply ended up residing in those areas with higher or lower levels of percentage of married-couple family households due to other factors.

Demographics Similar to Immigrants from Cabo Verde by Married-couple Households

In terms of married-couple households, the demographic groups most similar to Immigrants from Cabo Verde are Hopi (36.7%, a difference of 1.2%), Pima (35.6%, a difference of 1.9%), Immigrants from Dominican Republic (37.3%, a difference of 3.0%), Immigrants from Grenada (37.5%, a difference of 3.5%), and Tohono O'odham (37.9%, a difference of 4.6%).
DemographicsRating | RankMarried-couple Households
Immigrants from West Indies
0.0
/100
|
#333
Tragic
39.0%
Immigrants from St. Vincent and the Grenadines
0.0
/100
|
#334
Tragic
38.7%
Senegalese
0.0
/100
|
#335
Tragic
38.6%
Blacks/African Americans
0.0
/100
|
#336
Tragic
38.5%
Immigrants from Somalia
0.0
/100
|
#337
Tragic
38.4%
Immigrants from Senegal
0.0
/100
|
#338
Tragic
38.4%
British West Indians
0.0
/100
|
#339
Tragic
38.3%
Dominicans
0.0
/100
|
#340
Tragic
38.2%
Cape Verdeans
0.0
/100
|
#341
Tragic
38.1%
Tohono O'odham
0.0
/100
|
#342
Tragic
37.9%
Immigrants from Grenada
0.0
/100
|
#343
Tragic
37.5%
Immigrants from Dominican Republic
0.0
/100
|
#344
Tragic
37.3%
Hopi
0.0
/100
|
#345
Tragic
36.7%
Immigrants from Cabo Verde
0.0
/100
|
#346
Tragic
36.2%
Pima
0.0
/100
|
#347
Tragic
35.6%

Immigrants from Cabo Verde Married-couple Households Correlation Summary

MeasurementImmigrants from Cabo Verde DataMarried-couple Households Data
Minimum0.0084%18.5%
Maximum12.1%59.3%
Range12.1%40.8%
Mean2.9%40.1%
Median1.8%40.1%
Interquartile 25% (IQ1)0.75%32.9%
Interquartile 75% (IQ3)3.8%46.1%
Interquartile Range (IQR)3.1%13.2%
Standard Deviation (Sample)3.0%9.3%
Standard Deviation (Population)3.0%9.2%

Correlation Details

Immigrants from Cabo Verde PercentileSample SizeMarried-couple Households
[
0.0%
-
0.5%
]
0.0084%
29,053,37437.4%
[
0.0%
-
0.5%
]
0.081%
2,771,38844.3%
[
0.0%
-
0.5%
]
0.14%
1,290,93342.7%
[
0.0%
-
0.5%
]
0.19%
726,40847.3%
[
0.0%
-
0.5%
]
0.25%
409,05442.6%
[
0.0%
-
0.5%
]
0.32%
420,59243.6%
[
0.0%
-
0.5%
]
0.37%
373,41738.3%
[
0.0%
-
0.5%
]
0.42%
110,04645.2%
[
0.0%
-
0.5%
]
0.48%
269,03439.3%
[
0.5%
-
1.0%
]
0.56%
75,87750.9%
[
0.5%
-
1.0%
]
0.62%
73,65941.7%
[
0.5%
-
1.0%
]
0.66%
63,73145.1%
[
0.5%
-
1.0%
]
0.72%
28,08057.4%
[
0.5%
-
1.0%
]
0.78%
161,66335.6%
[
0.5%
-
1.0%
]
0.85%
27,75351.4%
[
0.5%
-
1.0%
]
0.88%
86,19233.0%
[
0.5%
-
1.0%
]
0.93%
49,71844.7%
[
1.0%
-
1.5%
]
1.07%
85,45629.8%
[
1.0%
-
1.5%
]
1.13%
107,39846.6%
[
1.0%
-
1.5%
]
1.16%
29,83346.5%
[
1.0%
-
1.5%
]
1.21%
60,93837.4%
[
1.0%
-
1.5%
]
1.31%
724,24028.6%
[
1.0%
-
1.5%
]
1.34%
48,69452.9%
[
1.0%
-
1.5%
]
1.44%
110,23736.3%
[
1.5%
-
2.0%
]
1.56%
7,69045.7%
[
1.5%
-
2.0%
]
1.72%
2,72653.0%
[
1.5%
-
2.0%
]
1.80%
94349.7%
[
1.5%
-
2.0%
]
1.90%
25,08441.7%
[
1.5%
-
2.0%
]
1.95%
29,82025.2%
[
2.0%
-
2.5%
]
2.02%
17,16429.7%
[
2.0%
-
2.5%
]
2.08%
29,98358.0%
[
2.0%
-
2.5%
]
2.22%
27,52738.8%
[
2.0%
-
2.5%
]
2.31%
59,43642.6%
[
2.0%
-
2.5%
]
2.48%
51,91540.1%
[
2.5%
-
3.0%
]
2.80%
18,44534.1%
[
3.0%
-
3.5%
]
3.04%
100,62031.5%
[
3.0%
-
3.5%
]
3.18%
46,62329.0%
[
3.0%
-
3.5%
]
3.42%
26,82118.5%
[
3.0%
-
3.5%
]
3.43%
12,46528.3%
[
3.5%
-
4.0%
]
3.73%
44,71838.8%
[
3.5%
-
4.0%
]
3.91%
55,33632.4%
[
3.5%
-
4.0%
]
3.94%
5,07459.3%
[
4.0%
-
4.5%
]
4.11%
16,28625.5%
[
6.0%
-
6.5%
]
6.09%
31,90324.6%
[
6.0%
-
6.5%
]
6.14%
75,17632.7%
[
6.0%
-
6.5%
]
6.30%
5,44246.2%
[
7.0%
-
7.5%
]
7.30%
24,70533.5%
[
7.0%
-
7.5%
]
7.45%
18855.3%
[
8.0%
-
8.5%
]
8.40%
47,67729.3%
[
8.5%
-
9.0%
]
8.64%
16246.0%
[
10.0%
-
10.5%
]
10.06%
35,48842.0%
[
11.0%
-
11.5%
]
11.41%
104,71338.4%
[
12.0%
-
12.5%
]
12.11%
69,22536.6%