New Zealander Married-couple Households

COMPARE

New Zealander
Race
Ancestry
AfghanAfricanAlaska NativeAlaskan AthabascanAlbanianAleutAlsatianAmericanApacheArabArapahoArgentineanArmenianAssyrian/Chaldean/SyriacAustralianAustrianBahamianBangladeshiBarbadianBasqueBelgianBelizeanBermudanBhutaneseBlackfeetBolivianBrazilianBritishBritish West IndianBulgarianBurmeseCajunCambodianCanadianCape VerdeanCarpatho RusynCelticCentral AmericanCentral American IndianCherokeeCheyenneChickasawChileanChineseChippewaChoctawColombianColvilleComancheCosta RicanCreeCreekCroatianCrowCubanCypriotCzechCzechoslovakianDanishDelawareDominicanDutchDutch West IndianEastern EuropeanEcuadorianEgyptianEnglishEstonianEthiopianEuropeanFijianFilipinoFinnishFrenchFrench American IndianFrench CanadianGermanGerman RussianGhanaianGreekGuamanian/ChamorroGuatemalanGuyaneseHaitianHmongHonduranHopiHoumaHungarianIcelanderIndian (Asian)IndonesianInupiatIranianIraqiIrishIroquoisIsraeliItalianJamaicanJapaneseJordanianKenyanKiowaKoreanLaotianLatvianLebaneseLiberianLithuanianLumbeeLuxembourgerMacedonianMalaysianMalteseMarshalleseMenomineeMexicanMexican American IndianMongolianMoroccanNative HawaiianNavajoNepaleseNew ZealanderNicaraguanNigerianNorthern EuropeanNorwegianOkinawanOsageOttawaPaiutePakistaniPalestinianPanamanianParaguayanPennsylvania GermanPeruvianPimaPolishPortuguesePotawatomiPuebloPuerto RicanPuget Sound SalishRomanianRussianSalvadoranSamoanScandinavianScotch-IrishScottishSeminoleSenegaleseSerbianShoshoneSierra LeoneanSiouxSlavicSlovakSloveneSomaliSouth AfricanSouth AmericanSouth American IndianSoviet UnionSpaniardSpanishSpanish AmericanSpanish American IndianSri LankanSubsaharan AfricanSudaneseSwedishSwissSyrianTaiwaneseThaiTlingit-HaidaTohono O'OdhamTonganTrinidadian and TobagonianTsimshianTurkishU.S. Virgin IslanderUgandanUkrainianUruguayanUteVenezuelanVietnameseWelshWest IndianYakamaYaquiYugoslavianYumanYup'ikZimbabwean
Immigration
NonimmigrantsImmigrantsAfghanistanAfricaAlbaniaArgentinaArmeniaAsiaAustraliaAustriaBahamasBangladeshBarbadosBelarusBelgiumBelizeBoliviaBosnia and HerzegovinaBrazilBulgariaBurma/MyanmarCabo VerdeCambodiaCameroonCanadaCaribbeanCentral AmericaChileChinaColombiaCongoCosta RicaCroatiaCubaCzechoslovakiaDenmarkDominicaDominican RepublicEastern AfricaEastern AsiaEastern EuropeEcuadorEgyptEl SalvadorEnglandEritreaEthiopiaEuropeFijiFranceGermanyGhanaGreeceGrenadaGuatemalaGuyanaHaitiHondurasHong KongHungaryIndiaIndonesiaIranIraqIrelandIsraelItalyJamaicaJapanJordanKazakhstanKenyaKoreaKuwaitLaosLatin AmericaLatviaLebanonLiberiaLithuaniaMalaysiaMexicoMicronesiaMiddle AfricaMoldovaMoroccoNepalNetherlandsNicaraguaNigeriaNorth AmericaNorth MacedoniaNorthern AfricaNorthern EuropeNorwayOceaniaPakistanPanamaPeruPhilippinesPolandPortugalRomaniaRussiaSaudi ArabiaScotlandSenegalSerbiaSierra LeoneSingaporeSomaliaSouth AfricaSouth AmericaSouth Central AsiaSouth Eastern AsiaSouthern EuropeSpainSri LankaSt. Vincent and the GrenadinesSudanSwedenSwitzerlandSyriaTaiwanThailandTrinidad and TobagoTurkeyUgandaUkraineUruguayUzbekistanVenezuelaVietnamWest IndiesWestern AfricaWestern AsiaWestern EuropeYemenZaireZimbabweAzores
Select to Compare
Race
Ancestry
AfghanAfricanAlaska NativeAlaskan AthabascanAlbanianAleutAlsatianAmericanApacheArabArapahoArgentineanArmenianAssyrian/Chaldean/SyriacAustralianAustrianBahamianBangladeshiBarbadianBasqueBelgianBelizeanBermudanBhutaneseBlackfeetBolivianBrazilianBritishBritish West IndianBulgarianBurmeseCajunCambodianCanadianCape VerdeanCarpatho RusynCelticCentral AmericanCentral American IndianCherokeeCheyenneChickasawChileanChineseChippewaChoctawColombianColvilleComancheCosta RicanCreeCreekCroatianCrowCubanCypriotCzechCzechoslovakianDanishDelawareDominicanDutchDutch West IndianEastern EuropeanEcuadorianEgyptianEnglishEstonianEthiopianEuropeanFijianFilipinoFinnishFrenchFrench American IndianFrench CanadianGermanGerman RussianGhanaianGreekGuamanian/ChamorroGuatemalanGuyaneseHaitianHmongHonduranHopiHoumaHungarianIcelanderIndian (Asian)IndonesianInupiatIranianIraqiIrishIroquoisIsraeliItalianJamaicanJapaneseJordanianKenyanKiowaKoreanLaotianLatvianLebaneseLiberianLithuanianLumbeeLuxembourgerMacedonianMalaysianMalteseMarshalleseMenomineeMexicanMexican American IndianMongolianMoroccanNative HawaiianNavajoNepaleseNicaraguanNigerianNorthern EuropeanNorwegianOkinawanOsageOttawaPaiutePakistaniPalestinianPanamanianParaguayanPennsylvania GermanPeruvianPimaPolishPortuguesePotawatomiPuebloPuerto RicanPuget Sound SalishRomanianRussianSalvadoranSamoanScandinavianScotch-IrishScottishSeminoleSenegaleseSerbianShoshoneSierra LeoneanSiouxSlavicSlovakSloveneSomaliSouth AfricanSouth AmericanSouth American IndianSoviet UnionSpaniardSpanishSpanish AmericanSpanish American IndianSri LankanSubsaharan AfricanSudaneseSwedishSwissSyrianTaiwaneseThaiTlingit-HaidaTohono O'OdhamTonganTrinidadian and TobagonianTsimshianTurkishU.S. Virgin IslanderUgandanUkrainianUruguayanUteVenezuelanVietnameseWelshWest IndianYakamaYaquiYugoslavianYumanYup'ikZimbabwean
Immigration
NonimmigrantsImmigrantsAfghanistanAfricaAlbaniaArgentinaArmeniaAsiaAustraliaAustriaBahamasBangladeshBarbadosBelarusBelgiumBelizeBoliviaBosnia and HerzegovinaBrazilBulgariaBurma/MyanmarCabo VerdeCambodiaCameroonCanadaCaribbeanCentral AmericaChileChinaColombiaCongoCosta RicaCroatiaCubaCzechoslovakiaDenmarkDominicaDominican RepublicEastern AfricaEastern AsiaEastern EuropeEcuadorEgyptEl SalvadorEnglandEritreaEthiopiaEuropeFijiFranceGermanyGhanaGreeceGrenadaGuatemalaGuyanaHaitiHondurasHong KongHungaryIndiaIndonesiaIranIraqIrelandIsraelItalyJamaicaJapanJordanKazakhstanKenyaKoreaKuwaitLaosLatin AmericaLatviaLebanonLiberiaLithuaniaMalaysiaMexicoMicronesiaMiddle AfricaMoldovaMoroccoNepalNetherlandsNicaraguaNigeriaNorth AmericaNorth MacedoniaNorthern AfricaNorthern EuropeNorwayOceaniaPakistanPanamaPeruPhilippinesPolandPortugalRomaniaRussiaSaudi ArabiaScotlandSenegalSerbiaSierra LeoneSingaporeSomaliaSouth AfricaSouth AmericaSouth Central AsiaSouth Eastern AsiaSouthern EuropeSpainSri LankaSt. Vincent and the GrenadinesSudanSwedenSwitzerlandSyriaTaiwanThailandTrinidad and TobagoTurkeyUgandaUkraineUruguayUzbekistanVenezuelaVietnamWest IndiesWestern AfricaWestern AsiaWestern EuropeYemenZaireZimbabweAzores
Married-couple Households
Income
Poverty
Unemployment
Labor Participation
Family Structure
Vehicle Availability
Education Level
Disability

New Zealander Married-couple Households
Excellent

47.2%
MARRIED-COUPLE HOUSEHOLDS
85.3/ 100
METRIC RATING
136th/ 347
METRIC RANK

New Zealander Married-couple Households Correlation Chart

The statistical analysis conducted on geographies consisting of 106,894,441 people shows a slight positive correlation between the proportion of New Zealanders and percentage of married-couple family households in the United States with a correlation coefficient (R) of 0.082 and weighted average of 47.2%. On average, for every 1% (one percent) increase in New Zealanders within a typical geography, there is an increase of 0.42% in percentage of married-couple family households.
New Zealander Married-couple Households
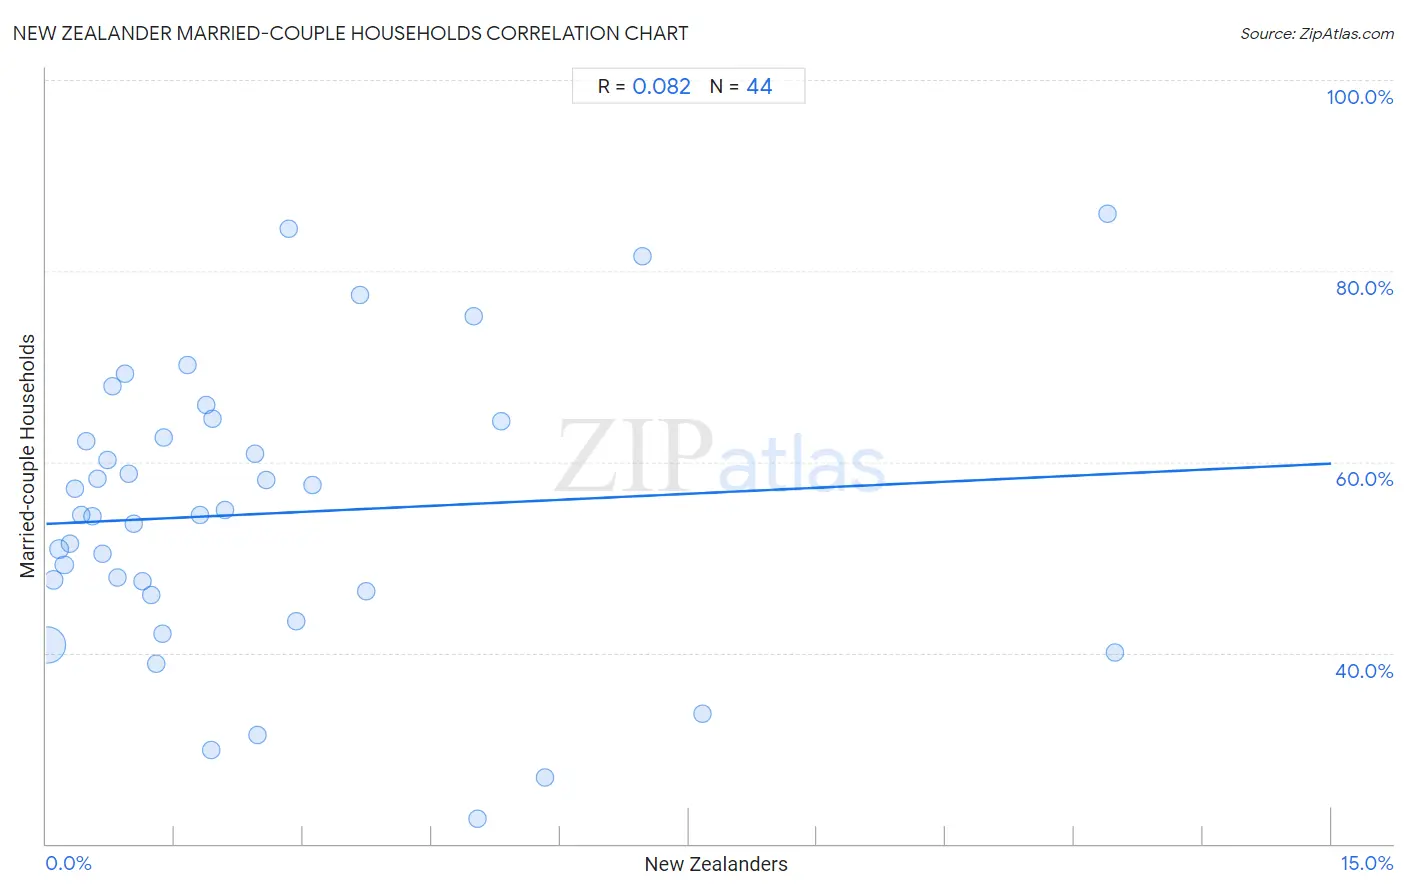
It is essential to understand that the correlation between the percentage of New Zealanders and percentage of married-couple family households does not imply a direct cause-and-effect relationship. It remains uncertain whether the presence of New Zealanders influences an upward or downward trend in the level of percentage of married-couple family households within an area, or if New Zealanders simply ended up residing in those areas with higher or lower levels of percentage of married-couple family households due to other factors.

Demographics Similar to New Zealanders by Married-couple Households

In terms of married-couple households, the demographic groups most similar to New Zealanders are Immigrants from Malaysia (47.2%, a difference of 0.0%), Immigrants from Afghanistan (47.2%, a difference of 0.010%), Immigrants from Sweden (47.2%, a difference of 0.040%), Immigrants from Greece (47.2%, a difference of 0.050%), and Immigrants from Argentina (47.2%, a difference of 0.050%).
DemographicsRating | RankMarried-couple Households
Immigrants from Iraq
87.8
/100
|
#129
Excellent
47.3%
Immigrants from Hungary
87.8
/100
|
#130
Excellent
47.3%
Immigrants from Denmark
87.5
/100
|
#131
Excellent
47.3%
Immigrants from Ukraine
86.7
/100
|
#132
Excellent
47.3%
South Africans
86.4
/100
|
#133
Excellent
47.3%
Immigrants from Greece
86.0
/100
|
#134
Excellent
47.2%
Immigrants from Argentina
86.0
/100
|
#135
Excellent
47.2%
New Zealanders
85.3
/100
|
#136
Excellent
47.2%
Immigrants from Malaysia
85.2
/100
|
#137
Excellent
47.2%
Immigrants from Afghanistan
85.1
/100
|
#138
Excellent
47.2%
Immigrants from Sweden
84.7
/100
|
#139
Excellent
47.2%
Spanish
84.5
/100
|
#140
Excellent
47.2%
Costa Ricans
84.4
/100
|
#141
Excellent
47.2%
Spaniards
84.1
/100
|
#142
Excellent
47.2%
Immigrants from Belarus
83.8
/100
|
#143
Excellent
47.2%

New Zealander Married-couple Households Correlation Summary

MeasurementNew Zealander DataMarried-couple Households Data
Minimum0.016%22.7%
Maximum12.5%86.0%
Range12.5%63.3%
Mean2.5%54.6%
Median1.5%54.4%
Interquartile 25% (IQ1)0.68%46.3%
Interquartile 75% (IQ3)3.0%63.4%
Interquartile Range (IQR)2.3%17.2%
Standard Deviation (Sample)2.9%14.8%
Standard Deviation (Population)2.8%14.6%

Correlation Details

New Zealander PercentileSample SizeMarried-couple Households
[
0.0%
-
0.5%
]
0.016%
93,462,30640.8%
[
0.0%
-
0.5%
]
0.086%
7,622,68647.7%
[
0.0%
-
0.5%
]
0.15%
2,736,08350.9%
[
0.0%
-
0.5%
]
0.21%
989,26649.2%
[
0.0%
-
0.5%
]
0.27%
671,64451.4%
[
0.0%
-
0.5%
]
0.34%
442,29057.2%
[
0.0%
-
0.5%
]
0.40%
215,32754.4%
[
0.0%
-
0.5%
]
0.47%
198,10362.1%
[
0.5%
-
1.0%
]
0.54%
140,06554.3%
[
0.5%
-
1.0%
]
0.60%
54,43658.3%
[
0.5%
-
1.0%
]
0.66%
62,60850.4%
[
0.5%
-
1.0%
]
0.71%
57,51660.2%
[
0.5%
-
1.0%
]
0.78%
29,43667.9%
[
0.5%
-
1.0%
]
0.84%
58,83547.9%
[
0.5%
-
1.0%
]
0.92%
35,58769.3%
[
0.5%
-
1.0%
]
0.96%
26,02358.8%
[
1.0%
-
1.5%
]
1.03%
5,44453.5%
[
1.0%
-
1.5%
]
1.12%
5,01247.5%
[
1.0%
-
1.5%
]
1.23%
7,78746.1%
[
1.0%
-
1.5%
]
1.29%
16,05638.9%
[
1.0%
-
1.5%
]
1.35%
13,32242.0%
[
1.0%
-
1.5%
]
1.38%
6,53462.6%
[
1.5%
-
2.0%
]
1.65%
36370.2%
[
1.5%
-
2.0%
]
1.79%
6,46754.4%
[
1.5%
-
2.0%
]
1.86%
1,01966.0%
[
1.5%
-
2.0%
]
1.92%
1,24729.8%
[
1.5%
-
2.0%
]
1.95%
97664.5%
[
2.0%
-
2.5%
]
2.09%
3,30555.0%
[
2.0%
-
2.5%
]
2.43%
2,01660.8%
[
2.0%
-
2.5%
]
2.47%
3,36731.4%
[
2.5%
-
3.0%
]
2.57%
4,40258.1%
[
2.5%
-
3.0%
]
2.84%
28284.4%
[
2.5%
-
3.0%
]
2.92%
6,34543.3%
[
3.0%
-
3.5%
]
3.11%
1,41357.6%
[
3.5%
-
4.0%
]
3.67%
49177.5%
[
3.5%
-
4.0%
]
3.73%
1,34046.4%
[
4.5%
-
5.0%
]
4.98%
30175.2%
[
5.0%
-
5.5%
]
5.03%
89422.7%
[
5.0%
-
5.5%
]
5.30%
88664.3%
[
5.5%
-
6.0%
]
5.82%
49826.9%
[
6.5%
-
7.0%
]
6.95%
60481.6%
[
7.5%
-
8.0%
]
7.66%
1,24033.6%
[
12.0%
-
12.5%
]
12.39%
21886.0%
[
12.0%
-
12.5%
]
12.47%
40140.0%