Immigrants from Syria Married-couple Households
COMPARE
Immigrants from Syria
Select to Compare
Married-couple Households
Immigrants from Syria Married-couple Households
47.1%
MARRIED-COUPLE HOUSEHOLDS
81.6/ 100
METRIC RATING
147th/ 347
METRIC RANK
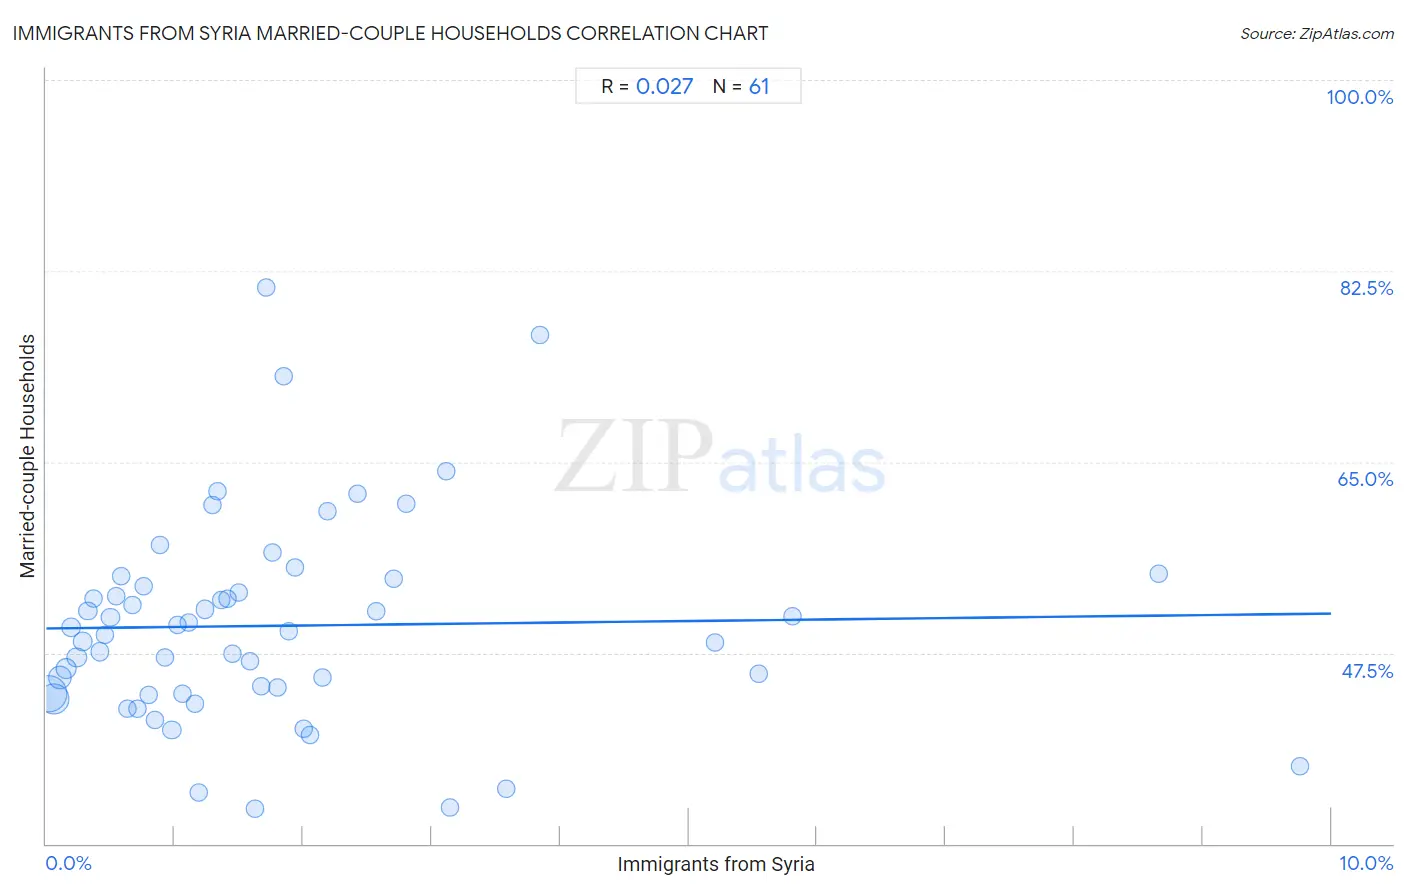
Immigrants from Syria Married-couple Households Correlation Chart
The statistical analysis conducted on geographies consisting of 174,106,206 people shows no correlation between the proportion of Immigrants from Syria and percentage of married-couple family households in the United States with a correlation coefficient (R) of 0.027 and weighted average of 47.1%. On average, for every 1% (one percent) increase in Immigrants from Syria within a typical geography, there is an increase of 0.13% in percentage of married-couple family households.
It is essential to understand that the correlation between the percentage of Immigrants from Syria and percentage of married-couple family households does not imply a direct cause-and-effect relationship. It remains uncertain whether the presence of Immigrants from Syria influences an upward or downward trend in the level of percentage of married-couple family households within an area, or if Immigrants from Syria simply ended up residing in those areas with higher or lower levels of percentage of married-couple family households due to other factors.
Demographics Similar to Immigrants from Syria by Married-couple Households
In terms of married-couple households, the demographic groups most similar to Immigrants from Syria are Immigrants from Western Europe (47.1%, a difference of 0.0%), Slovene (47.1%, a difference of 0.010%), Mexican (47.1%, a difference of 0.12%), Icelander (47.0%, a difference of 0.12%), and Immigrants from Belarus (47.2%, a difference of 0.14%).
| Demographics | Rating | Rank | Married-couple Households |
| Spanish | 84.5 /100 | #140 | Excellent 47.2% |
| Costa Ricans | 84.4 /100 | #141 | Excellent 47.2% |
| Spaniards | 84.1 /100 | #142 | Excellent 47.2% |
| Immigrants from Belarus | 83.8 /100 | #143 | Excellent 47.2% |
| Mexicans | 83.4 /100 | #144 | Excellent 47.1% |
| Slovenes | 81.7 /100 | #145 | Excellent 47.1% |
| Immigrants from Western Europe | 81.6 /100 | #146 | Excellent 47.1% |
| Immigrants from Syria | 81.6 /100 | #147 | Excellent 47.1% |
| Icelanders | 79.5 /100 | #148 | Good 47.0% |
| Paraguayans | 78.7 /100 | #149 | Good 47.0% |
| Immigrants from Russia | 77.6 /100 | #150 | Good 47.0% |
| Immigrants from Bulgaria | 76.8 /100 | #151 | Good 47.0% |
| Serbians | 76.3 /100 | #152 | Good 47.0% |
| Hmong | 76.2 /100 | #153 | Good 47.0% |
| Immigrants from Western Asia | 76.1 /100 | #154 | Good 46.9% |
Immigrants from Syria Married-couple Households Correlation Summary
| Measurement | Immigrants from Syria Data | Married-couple Households Data |
| Minimum | 0.021% | 33.2% |
| Maximum | 9.8% | 81.0% |
| Range | 9.7% | 47.8% |
| Mean | 1.8% | 50.0% |
| Median | 1.3% | 49.5% |
| Interquartile 25% (IQ1) | 0.65% | 43.7% |
| Interquartile 75% (IQ3) | 2.1% | 53.9% |
| Interquartile Range (IQR) | 1.4% | 10.2% |
| Standard Deviation (Sample) | 1.9% | 9.4% |
| Standard Deviation (Population) | 1.9% | 9.4% |
Correlation Details
| Immigrants from Syria Percentile | Sample Size | Married-couple Households |
[ 0.0% - 0.5% ] 0.021% | 70,566,214 | 43.7% |
[ 0.0% - 0.5% ] 0.060% | 45,844,544 | 43.3% |
[ 0.0% - 0.5% ] 0.11% | 19,344,084 | 45.2% |
[ 0.0% - 0.5% ] 0.15% | 10,497,619 | 46.1% |
[ 0.0% - 0.5% ] 0.20% | 5,870,432 | 49.8% |
[ 0.0% - 0.5% ] 0.24% | 5,355,711 | 47.0% |
[ 0.0% - 0.5% ] 0.28% | 3,266,609 | 48.6% |
[ 0.0% - 0.5% ] 0.33% | 2,051,960 | 51.3% |
[ 0.0% - 0.5% ] 0.37% | 1,463,273 | 52.4% |
[ 0.0% - 0.5% ] 0.41% | 1,108,294 | 47.6% |
[ 0.0% - 0.5% ] 0.46% | 858,730 | 49.1% |
[ 0.0% - 0.5% ] 0.50% | 1,546,038 | 50.8% |
[ 0.5% - 1.0% ] 0.54% | 555,551 | 52.7% |
[ 0.5% - 1.0% ] 0.58% | 775,662 | 54.6% |
[ 0.5% - 1.0% ] 0.63% | 586,381 | 42.4% |
[ 0.5% - 1.0% ] 0.67% | 162,130 | 51.9% |
[ 0.5% - 1.0% ] 0.71% | 345,202 | 42.3% |
[ 0.5% - 1.0% ] 0.75% | 389,433 | 53.6% |
[ 0.5% - 1.0% ] 0.80% | 488,355 | 43.6% |
[ 0.5% - 1.0% ] 0.85% | 229,137 | 41.3% |
[ 0.5% - 1.0% ] 0.89% | 238,027 | 57.4% |
[ 0.5% - 1.0% ] 0.92% | 265,761 | 47.1% |
[ 0.5% - 1.0% ] 0.98% | 182,116 | 40.4% |
[ 1.0% - 1.5% ] 1.02% | 347,495 | 50.0% |
[ 1.0% - 1.5% ] 1.06% | 183,678 | 43.7% |
[ 1.0% - 1.5% ] 1.11% | 134,021 | 50.3% |
[ 1.0% - 1.5% ] 1.16% | 49,586 | 42.8% |
[ 1.0% - 1.5% ] 1.18% | 124,920 | 34.7% |
[ 1.0% - 1.5% ] 1.23% | 267,825 | 51.5% |
[ 1.0% - 1.5% ] 1.30% | 18,512 | 61.0% |
[ 1.0% - 1.5% ] 1.33% | 42,486 | 62.3% |
[ 1.0% - 1.5% ] 1.37% | 94,053 | 52.3% |
[ 1.0% - 1.5% ] 1.41% | 54,260 | 52.4% |
[ 1.0% - 1.5% ] 1.45% | 58,332 | 47.4% |
[ 1.0% - 1.5% ] 1.49% | 47,791 | 53.0% |
[ 1.5% - 2.0% ] 1.58% | 68,001 | 46.7% |
[ 1.5% - 2.0% ] 1.62% | 149,839 | 33.2% |
[ 1.5% - 2.0% ] 1.67% | 4,362 | 44.4% |
[ 1.5% - 2.0% ] 1.72% | 22,017 | 81.0% |
[ 1.5% - 2.0% ] 1.76% | 32,376 | 56.7% |
[ 1.5% - 2.0% ] 1.80% | 17,212 | 44.3% |
[ 1.5% - 2.0% ] 1.84% | 3,363 | 72.8% |
[ 1.5% - 2.0% ] 1.89% | 30,372 | 49.5% |
[ 1.5% - 2.0% ] 1.93% | 31,984 | 55.3% |
[ 2.0% - 2.5% ] 2.01% | 1,097 | 40.5% |
[ 2.0% - 2.5% ] 2.05% | 9,761 | 39.9% |
[ 2.0% - 2.5% ] 2.15% | 83,343 | 45.3% |
[ 2.0% - 2.5% ] 2.19% | 27,468 | 60.5% |
[ 2.0% - 2.5% ] 2.42% | 248 | 62.1% |
[ 2.5% - 3.0% ] 2.57% | 80,113 | 51.4% |
[ 2.5% - 3.0% ] 2.70% | 35,960 | 54.3% |
[ 2.5% - 3.0% ] 2.80% | 8,180 | 61.1% |
[ 3.0% - 3.5% ] 3.12% | 8,764 | 64.2% |
[ 3.0% - 3.5% ] 3.14% | 191 | 33.3% |
[ 3.5% - 4.0% ] 3.58% | 24,985 | 35.1% |
[ 3.5% - 4.0% ] 3.85% | 156 | 76.7% |
[ 5.0% - 5.5% ] 5.21% | 29,286 | 48.5% |
[ 5.5% - 6.0% ] 5.54% | 16,358 | 45.6% |
[ 5.5% - 6.0% ] 5.81% | 5,958 | 50.9% |
[ 8.5% - 9.0% ] 8.66% | 508 | 54.7% |
[ 9.5% - 10.0% ] 9.76% | 82 | 37.1% |