French American Indian Married-couple Households

COMPARE

French American Indian
Race
Ancestry
AfghanAfricanAlaska NativeAlaskan AthabascanAlbanianAleutAlsatianAmericanApacheArabArapahoArgentineanArmenianAssyrian/Chaldean/SyriacAustralianAustrianBahamianBangladeshiBarbadianBasqueBelgianBelizeanBermudanBhutaneseBlackfeetBolivianBrazilianBritishBritish West IndianBulgarianBurmeseCajunCambodianCanadianCape VerdeanCarpatho RusynCelticCentral AmericanCentral American IndianCherokeeCheyenneChickasawChileanChineseChippewaChoctawColombianColvilleComancheCosta RicanCreeCreekCroatianCrowCubanCypriotCzechCzechoslovakianDanishDelawareDominicanDutchDutch West IndianEastern EuropeanEcuadorianEgyptianEnglishEstonianEthiopianEuropeanFijianFilipinoFinnishFrenchFrench American IndianFrench CanadianGermanGerman RussianGhanaianGreekGuamanian/ChamorroGuatemalanGuyaneseHaitianHmongHonduranHopiHoumaHungarianIcelanderIndian (Asian)IndonesianInupiatIranianIraqiIrishIroquoisIsraeliItalianJamaicanJapaneseJordanianKenyanKiowaKoreanLaotianLatvianLebaneseLiberianLithuanianLumbeeLuxembourgerMacedonianMalaysianMalteseMarshalleseMenomineeMexicanMexican American IndianMongolianMoroccanNative HawaiianNavajoNepaleseNew ZealanderNicaraguanNigerianNorthern EuropeanNorwegianOkinawanOsageOttawaPaiutePakistaniPalestinianPanamanianParaguayanPennsylvania GermanPeruvianPimaPolishPortuguesePotawatomiPuebloPuerto RicanPuget Sound SalishRomanianRussianSalvadoranSamoanScandinavianScotch-IrishScottishSeminoleSenegaleseSerbianShoshoneSierra LeoneanSiouxSlavicSlovakSloveneSomaliSouth AfricanSouth AmericanSouth American IndianSoviet UnionSpaniardSpanishSpanish AmericanSpanish American IndianSri LankanSubsaharan AfricanSudaneseSwedishSwissSyrianTaiwaneseThaiTlingit-HaidaTohono O'OdhamTonganTrinidadian and TobagonianTsimshianTurkishU.S. Virgin IslanderUgandanUkrainianUruguayanUteVenezuelanVietnameseWelshWest IndianYakamaYaquiYugoslavianYumanYup'ikZimbabwean
Immigration
NonimmigrantsImmigrantsAfghanistanAfricaAlbaniaArgentinaArmeniaAsiaAustraliaAustriaBahamasBangladeshBarbadosBelarusBelgiumBelizeBoliviaBosnia and HerzegovinaBrazilBulgariaBurma/MyanmarCabo VerdeCambodiaCameroonCanadaCaribbeanCentral AmericaChileChinaColombiaCongoCosta RicaCroatiaCubaCzechoslovakiaDenmarkDominicaDominican RepublicEastern AfricaEastern AsiaEastern EuropeEcuadorEgyptEl SalvadorEnglandEritreaEthiopiaEuropeFijiFranceGermanyGhanaGreeceGrenadaGuatemalaGuyanaHaitiHondurasHong KongHungaryIndiaIndonesiaIranIraqIrelandIsraelItalyJamaicaJapanJordanKazakhstanKenyaKoreaKuwaitLaosLatin AmericaLatviaLebanonLiberiaLithuaniaMalaysiaMexicoMicronesiaMiddle AfricaMoldovaMoroccoNepalNetherlandsNicaraguaNigeriaNorth AmericaNorth MacedoniaNorthern AfricaNorthern EuropeNorwayOceaniaPakistanPanamaPeruPhilippinesPolandPortugalRomaniaRussiaSaudi ArabiaScotlandSenegalSerbiaSierra LeoneSingaporeSomaliaSouth AfricaSouth AmericaSouth Central AsiaSouth Eastern AsiaSouthern EuropeSpainSri LankaSt. Vincent and the GrenadinesSudanSwedenSwitzerlandSyriaTaiwanThailandTrinidad and TobagoTurkeyUgandaUkraineUruguayUzbekistanVenezuelaVietnamWest IndiesWestern AfricaWestern AsiaWestern EuropeYemenZaireZimbabweAzores
Select to Compare
Race
Ancestry
AfghanAfricanAlaska NativeAlaskan AthabascanAlbanianAleutAlsatianAmericanApacheArabArapahoArgentineanArmenianAssyrian/Chaldean/SyriacAustralianAustrianBahamianBangladeshiBarbadianBasqueBelgianBelizeanBermudanBhutaneseBlackfeetBolivianBrazilianBritishBritish West IndianBulgarianBurmeseCajunCambodianCanadianCape VerdeanCarpatho RusynCelticCentral AmericanCentral American IndianCherokeeCheyenneChickasawChileanChineseChippewaChoctawColombianColvilleComancheCosta RicanCreeCreekCroatianCrowCubanCypriotCzechCzechoslovakianDanishDelawareDominicanDutchDutch West IndianEastern EuropeanEcuadorianEgyptianEnglishEstonianEthiopianEuropeanFijianFilipinoFinnishFrenchFrench CanadianGermanGerman RussianGhanaianGreekGuamanian/ChamorroGuatemalanGuyaneseHaitianHmongHonduranHopiHoumaHungarianIcelanderIndian (Asian)IndonesianInupiatIranianIraqiIrishIroquoisIsraeliItalianJamaicanJapaneseJordanianKenyanKiowaKoreanLaotianLatvianLebaneseLiberianLithuanianLumbeeLuxembourgerMacedonianMalaysianMalteseMarshalleseMenomineeMexicanMexican American IndianMongolianMoroccanNative HawaiianNavajoNepaleseNew ZealanderNicaraguanNigerianNorthern EuropeanNorwegianOkinawanOsageOttawaPaiutePakistaniPalestinianPanamanianParaguayanPennsylvania GermanPeruvianPimaPolishPortuguesePotawatomiPuebloPuerto RicanPuget Sound SalishRomanianRussianSalvadoranSamoanScandinavianScotch-IrishScottishSeminoleSenegaleseSerbianShoshoneSierra LeoneanSiouxSlavicSlovakSloveneSomaliSouth AfricanSouth AmericanSouth American IndianSoviet UnionSpaniardSpanishSpanish AmericanSpanish American IndianSri LankanSubsaharan AfricanSudaneseSwedishSwissSyrianTaiwaneseThaiTlingit-HaidaTohono O'OdhamTonganTrinidadian and TobagonianTsimshianTurkishU.S. Virgin IslanderUgandanUkrainianUruguayanUteVenezuelanVietnameseWelshWest IndianYakamaYaquiYugoslavianYumanYup'ikZimbabwean
Immigration
NonimmigrantsImmigrantsAfghanistanAfricaAlbaniaArgentinaArmeniaAsiaAustraliaAustriaBahamasBangladeshBarbadosBelarusBelgiumBelizeBoliviaBosnia and HerzegovinaBrazilBulgariaBurma/MyanmarCabo VerdeCambodiaCameroonCanadaCaribbeanCentral AmericaChileChinaColombiaCongoCosta RicaCroatiaCubaCzechoslovakiaDenmarkDominicaDominican RepublicEastern AfricaEastern AsiaEastern EuropeEcuadorEgyptEl SalvadorEnglandEritreaEthiopiaEuropeFijiFranceGermanyGhanaGreeceGrenadaGuatemalaGuyanaHaitiHondurasHong KongHungaryIndiaIndonesiaIranIraqIrelandIsraelItalyJamaicaJapanJordanKazakhstanKenyaKoreaKuwaitLaosLatin AmericaLatviaLebanonLiberiaLithuaniaMalaysiaMexicoMicronesiaMiddle AfricaMoldovaMoroccoNepalNetherlandsNicaraguaNigeriaNorth AmericaNorth MacedoniaNorthern AfricaNorthern EuropeNorwayOceaniaPakistanPanamaPeruPhilippinesPolandPortugalRomaniaRussiaSaudi ArabiaScotlandSenegalSerbiaSierra LeoneSingaporeSomaliaSouth AfricaSouth AmericaSouth Central AsiaSouth Eastern AsiaSouthern EuropeSpainSri LankaSt. Vincent and the GrenadinesSudanSwedenSwitzerlandSyriaTaiwanThailandTrinidad and TobagoTurkeyUgandaUkraineUruguayUzbekistanVenezuelaVietnamWest IndiesWestern AfricaWestern AsiaWestern EuropeYemenZaireZimbabweAzores
Married-couple Households
Income
Poverty
Unemployment
Labor Participation
Family Structure
Vehicle Availability
Education Level
Disability

French American Indian Married-couple Households
Tragic

44.1%
MARRIED-COUPLE HOUSEHOLDS
0.4/ 100
METRIC RATING
250th/ 347
METRIC RANK

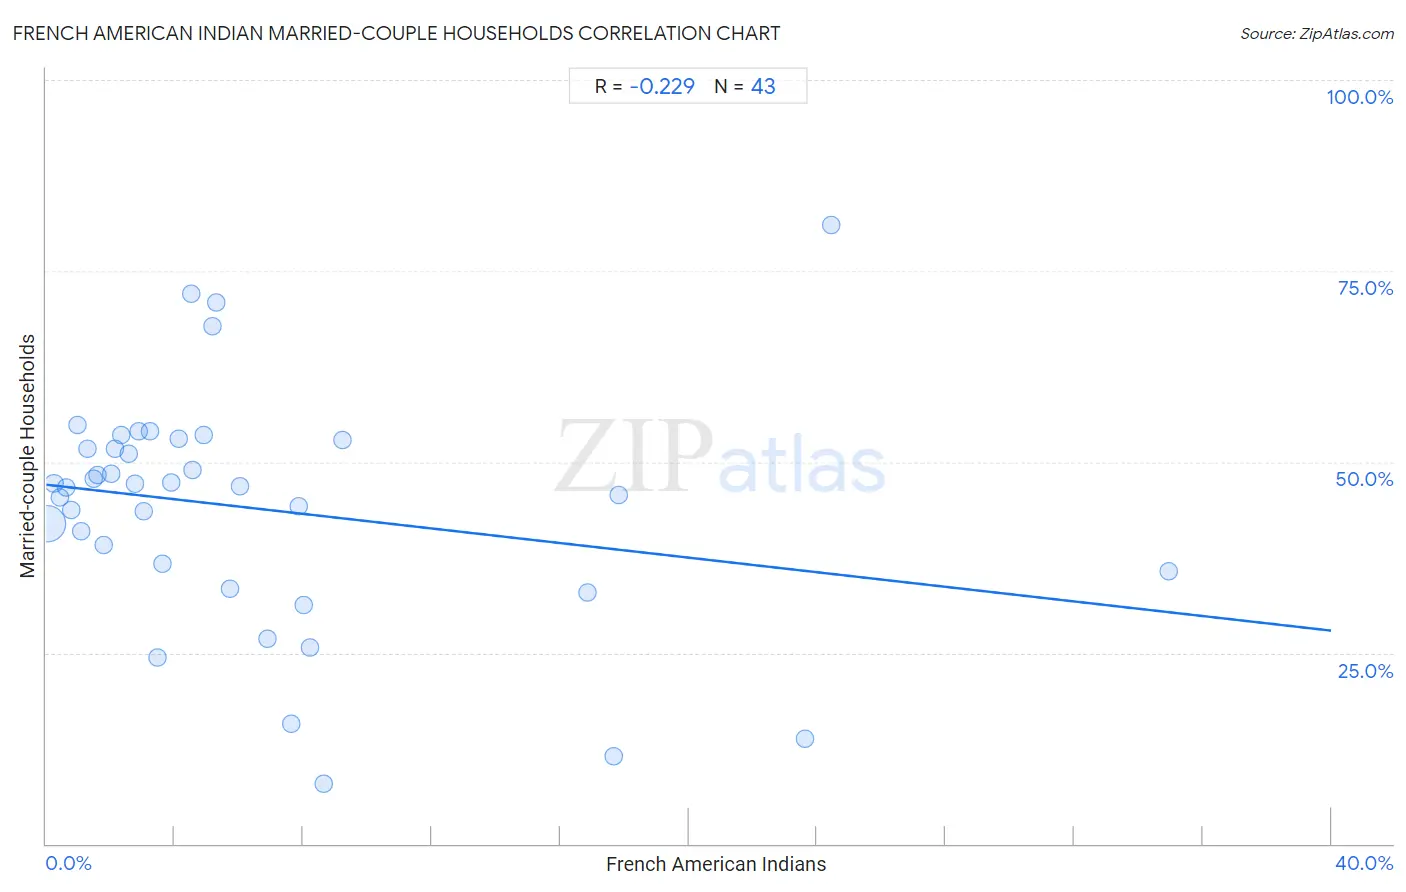
French American Indian Married-couple Households Correlation Chart

The statistical analysis conducted on geographies consisting of 131,960,385 people shows a weak negative correlation between the proportion of French American Indians and percentage of married-couple family households in the United States with a correlation coefficient (R) of -0.229 and weighted average of 44.1%. On average, for every 1% (one percent) increase in French American Indians within a typical geography, there is a decrease of 0.48% in percentage of married-couple family households.
French American Indian Married-couple Households
It is essential to understand that the correlation between the percentage of French American Indians and percentage of married-couple family households does not imply a direct cause-and-effect relationship. It remains uncertain whether the presence of French American Indians influences an upward or downward trend in the level of percentage of married-couple family households within an area, or if French American Indians simply ended up residing in those areas with higher or lower levels of percentage of married-couple family households due to other factors.

Demographics Similar to French American Indians by Married-couple Households

In terms of married-couple households, the demographic groups most similar to French American Indians are Immigrants from Kenya (44.1%, a difference of 0.010%), Yup'ik (44.1%, a difference of 0.050%), German Russian (44.0%, a difference of 0.080%), Seminole (44.0%, a difference of 0.15%), and Central American (43.9%, a difference of 0.27%).
DemographicsRating | RankMarried-couple Households
Immigrants from Saudi Arabia
0.9
/100
|
#243
Tragic
44.4%
Immigrants from Armenia
0.7
/100
|
#244
Tragic
44.3%
Immigrants from El Salvador
0.7
/100
|
#245
Tragic
44.3%
Immigrants from Cuba
0.6
/100
|
#246
Tragic
44.2%
Immigrants from Morocco
0.6
/100
|
#247
Tragic
44.2%
Yup'ik
0.4
/100
|
#248
Tragic
44.1%
Immigrants from Kenya
0.4
/100
|
#249
Tragic
44.1%
French American Indians
0.4
/100
|
#250
Tragic
44.1%
German Russians
0.4
/100
|
#251
Tragic
44.0%
Seminole
0.4
/100
|
#252
Tragic
44.0%
Central Americans
0.3
/100
|
#253
Tragic
43.9%
Apache
0.3
/100
|
#254
Tragic
43.9%
Shoshone
0.3
/100
|
#255
Tragic
43.9%
Ugandans
0.3
/100
|
#256
Tragic
43.8%
Blackfeet
0.2
/100
|
#257
Tragic
43.8%

French American Indian Married-couple Households Correlation Summary

MeasurementFrench American Indian DataMarried-couple Households Data
Minimum0.025%7.9%
Maximum34.9%81.0%
Range34.9%73.1%
Mean6.4%44.0%
Median3.9%46.8%
Interquartile 25% (IQ1)1.8%35.7%
Interquartile 75% (IQ3)7.9%52.8%
Interquartile Range (IQR)6.0%17.1%
Standard Deviation (Sample)7.4%15.5%
Standard Deviation (Population)7.3%15.3%

Correlation Details

French American Indian PercentileSample SizeMarried-couple Households
[
0.0%
-
0.5%
]
0.025%
124,988,24641.9%
[
0.0%
-
0.5%
]
0.24%
4,848,05847.2%
[
0.0%
-
0.5%
]
0.43%
1,182,71245.4%
[
0.5%
-
1.0%
]
0.63%
368,27346.6%
[
0.5%
-
1.0%
]
0.78%
161,76843.7%
[
0.5%
-
1.0%
]
0.96%
83,24054.8%
[
1.0%
-
1.5%
]
1.09%
141,74841.0%
[
1.0%
-
1.5%
]
1.30%
55,47251.7%
[
1.0%
-
1.5%
]
1.48%
28,77947.8%
[
1.5%
-
2.0%
]
1.60%
13,12648.3%
[
1.5%
-
2.0%
]
1.80%
27,71139.0%
[
2.0%
-
2.5%
]
2.03%
3,44848.4%
[
2.0%
-
2.5%
]
2.15%
10,90451.6%
[
2.0%
-
2.5%
]
2.35%
12,52453.6%
[
2.5%
-
3.0%
]
2.56%
4,52751.1%
[
2.5%
-
3.0%
]
2.76%
43547.1%
[
2.5%
-
3.0%
]
2.88%
6,24054.1%
[
3.0%
-
3.5%
]
3.05%
3,80843.6%
[
3.0%
-
3.5%
]
3.22%
2,33153.9%
[
3.0%
-
3.5%
]
3.47%
17324.4%
[
3.5%
-
4.0%
]
3.63%
1,68136.6%
[
3.5%
-
4.0%
]
3.88%
1,21047.3%
[
4.0%
-
4.5%
]
4.14%
29053.1%
[
4.0%
-
4.5%
]
4.49%
17872.1%
[
4.5%
-
5.0%
]
4.55%
68248.9%
[
4.5%
-
5.0%
]
4.89%
36853.5%
[
5.0%
-
5.5%
]
5.18%
1,23667.7%
[
5.0%
-
5.5%
]
5.31%
1,30070.9%
[
5.5%
-
6.0%
]
5.71%
66633.3%
[
6.0%
-
6.5%
]
6.04%
3,34646.8%
[
6.5%
-
7.0%
]
6.90%
17426.9%
[
7.5%
-
8.0%
]
7.63%
24915.7%
[
7.5%
-
8.0%
]
7.85%
1,55444.2%
[
8.0%
-
8.5%
]
8.00%
2531.2%
[
8.0%
-
8.5%
]
8.22%
1,59325.6%
[
8.5%
-
9.0%
]
8.63%
2557.9%
[
9.0%
-
9.5%
]
9.23%
75852.8%
[
16.5%
-
17.0%
]
16.86%
17232.9%
[
17.5%
-
18.0%
]
17.65%
6811.5%
[
17.5%
-
18.0%
]
17.82%
57845.6%
[
23.5%
-
24.0%
]
23.61%
21613.8%
[
24.0%
-
24.5%
]
24.44%
18081.0%
[
34.5%
-
35.0%
]
34.94%
8335.7%