Blackfeet vs South African Married-couple Households

COMPARE

Blackfeet
Race
Ancestry
AfghanAfricanAlaska NativeAlaskan AthabascanAlbanianAleutAlsatianAmericanApacheArabArapahoArgentineanArmenianAssyrian/Chaldean/SyriacAustralianAustrianBahamianBangladeshiBarbadianBasqueBelgianBelizeanBermudanBhutaneseBlackfeetBolivianBrazilianBritishBritish West IndianBulgarianBurmeseCajunCambodianCanadianCape VerdeanCarpatho RusynCelticCentral AmericanCentral American IndianCherokeeCheyenneChickasawChileanChineseChippewaChoctawColombianColvilleComancheCosta RicanCreeCreekCroatianCrowCubanCypriotCzechCzechoslovakianDanishDelawareDominicanDutchDutch West IndianEastern EuropeanEcuadorianEgyptianEnglishEstonianEthiopianEuropeanFijianFilipinoFinnishFrenchFrench American IndianFrench CanadianGermanGerman RussianGhanaianGreekGuamanian/ChamorroGuatemalanGuyaneseHaitianHmongHonduranHopiHoumaHungarianIcelanderIndian (Asian)IndonesianInupiatIranianIraqiIrishIroquoisIsraeliItalianJamaicanJapaneseJordanianKenyanKiowaKoreanLaotianLatvianLebaneseLiberianLithuanianLumbeeLuxembourgerMacedonianMalaysianMalteseMarshalleseMenomineeMexicanMexican American IndianMongolianMoroccanNative HawaiianNavajoNepaleseNew ZealanderNicaraguanNigerianNorthern EuropeanNorwegianOkinawanOsageOttawaPaiutePakistaniPalestinianPanamanianParaguayanPennsylvania GermanPeruvianPimaPolishPortuguesePotawatomiPuebloPuerto RicanPuget Sound SalishRomanianRussianSalvadoranSamoanScandinavianScotch-IrishScottishSeminoleSenegaleseSerbianShoshoneSierra LeoneanSiouxSlavicSlovakSloveneSomaliSouth AmericanSouth American IndianSoviet UnionSpaniardSpanishSpanish AmericanSpanish American IndianSri LankanSubsaharan AfricanSudaneseSwedishSwissSyrianTaiwaneseThaiTlingit-HaidaTohono O'OdhamTonganTrinidadian and TobagonianTsimshianTurkishU.S. Virgin IslanderUgandanUkrainianUruguayanUteVenezuelanVietnameseWelshWest IndianYakamaYaquiYugoslavianYumanYup'ikZimbabwean
Immigration
NonimmigrantsImmigrantsAfghanistanAfricaAlbaniaArgentinaArmeniaAsiaAustraliaAustriaBahamasBangladeshBarbadosBelarusBelgiumBelizeBoliviaBosnia and HerzegovinaBrazilBulgariaBurma/MyanmarCabo VerdeCambodiaCameroonCanadaCaribbeanCentral AmericaChileChinaColombiaCongoCosta RicaCroatiaCubaCzechoslovakiaDenmarkDominicaDominican RepublicEastern AfricaEastern AsiaEastern EuropeEcuadorEgyptEl SalvadorEnglandEritreaEthiopiaEuropeFijiFranceGermanyGhanaGreeceGrenadaGuatemalaGuyanaHaitiHondurasHong KongHungaryIndiaIndonesiaIranIraqIrelandIsraelItalyJamaicaJapanJordanKazakhstanKenyaKoreaKuwaitLaosLatin AmericaLatviaLebanonLiberiaLithuaniaMalaysiaMexicoMicronesiaMiddle AfricaMoldovaMoroccoNepalNetherlandsNicaraguaNigeriaNorth AmericaNorth MacedoniaNorthern AfricaNorthern EuropeNorwayOceaniaPakistanPanamaPeruPhilippinesPolandPortugalRomaniaRussiaSaudi ArabiaScotlandSenegalSerbiaSierra LeoneSingaporeSomaliaSouth AfricaSouth AmericaSouth Central AsiaSouth Eastern AsiaSouthern EuropeSpainSri LankaSt. Vincent and the GrenadinesSudanSwedenSwitzerlandSyriaTaiwanThailandTrinidad and TobagoTurkeyUgandaUkraineUruguayUzbekistanVenezuelaVietnamWest IndiesWestern AfricaWestern AsiaWestern EuropeYemenZaireZimbabweAzores
South African
Race
Ancestry
AfghanAfricanAlaska NativeAlaskan AthabascanAlbanianAleutAlsatianAmericanApacheArabArapahoArgentineanArmenianAssyrian/Chaldean/SyriacAustralianAustrianBahamianBangladeshiBarbadianBasqueBelgianBelizeanBermudanBhutaneseBolivianBrazilianBritishBritish West IndianBulgarianBurmeseCajunCambodianCanadianCape VerdeanCarpatho RusynCelticCentral AmericanCentral American IndianCherokeeCheyenneChickasawChileanChineseChippewaChoctawColombianColvilleComancheCosta RicanCreeCreekCroatianCrowCubanCypriotCzechCzechoslovakianDanishDelawareDominicanDutchDutch West IndianEastern EuropeanEcuadorianEgyptianEnglishEstonianEthiopianEuropeanFijianFilipinoFinnishFrenchFrench American IndianFrench CanadianGermanGerman RussianGhanaianGreekGuamanian/ChamorroGuatemalanGuyaneseHaitianHmongHonduranHopiHoumaHungarianIcelanderIndian (Asian)IndonesianInupiatIranianIraqiIrishIroquoisIsraeliItalianJamaicanJapaneseJordanianKenyanKiowaKoreanLaotianLatvianLebaneseLiberianLithuanianLumbeeLuxembourgerMacedonianMalaysianMalteseMarshalleseMenomineeMexicanMexican American IndianMongolianMoroccanNative HawaiianNavajoNepaleseNew ZealanderNicaraguanNigerianNorthern EuropeanNorwegianOkinawanOsageOttawaPaiutePakistaniPalestinianPanamanianParaguayanPennsylvania GermanPeruvianPimaPolishPortuguesePotawatomiPuebloPuerto RicanPuget Sound SalishRomanianRussianSalvadoranSamoanScandinavianScotch-IrishScottishSeminoleSenegaleseSerbianShoshoneSierra LeoneanSiouxSlavicSlovakSloveneSomaliSouth AfricanSouth AmericanSouth American IndianSoviet UnionSpaniardSpanishSpanish AmericanSpanish American IndianSri LankanSubsaharan AfricanSudaneseSwedishSwissSyrianTaiwaneseThaiTlingit-HaidaTohono O'OdhamTonganTrinidadian and TobagonianTsimshianTurkishU.S. Virgin IslanderUgandanUkrainianUruguayanUteVenezuelanVietnameseWelshWest IndianYakamaYaquiYugoslavianYumanYup'ikZimbabwean
Immigration
NonimmigrantsImmigrantsAfghanistanAfricaAlbaniaArgentinaArmeniaAsiaAustraliaAustriaBahamasBangladeshBarbadosBelarusBelgiumBelizeBoliviaBosnia and HerzegovinaBrazilBulgariaBurma/MyanmarCabo VerdeCambodiaCameroonCanadaCaribbeanCentral AmericaChileChinaColombiaCongoCosta RicaCroatiaCubaCzechoslovakiaDenmarkDominicaDominican RepublicEastern AfricaEastern AsiaEastern EuropeEcuadorEgyptEl SalvadorEnglandEritreaEthiopiaEuropeFijiFranceGermanyGhanaGreeceGrenadaGuatemalaGuyanaHaitiHondurasHong KongHungaryIndiaIndonesiaIranIraqIrelandIsraelItalyJamaicaJapanJordanKazakhstanKenyaKoreaKuwaitLaosLatin AmericaLatviaLebanonLiberiaLithuaniaMalaysiaMexicoMicronesiaMiddle AfricaMoldovaMoroccoNepalNetherlandsNicaraguaNigeriaNorth AmericaNorth MacedoniaNorthern AfricaNorthern EuropeNorwayOceaniaPakistanPanamaPeruPhilippinesPolandPortugalRomaniaRussiaSaudi ArabiaScotlandSenegalSerbiaSierra LeoneSingaporeSomaliaSouth AfricaSouth AmericaSouth Central AsiaSouth Eastern AsiaSouthern EuropeSpainSri LankaSt. Vincent and the GrenadinesSudanSwedenSwitzerlandSyriaTaiwanThailandTrinidad and TobagoTurkeyUgandaUkraineUruguayUzbekistanVenezuelaVietnamWest IndiesWestern AfricaWestern AsiaWestern EuropeYemenZaireZimbabweAzores
Married-couple Households
Income
Poverty
Unemployment
Labor Participation
Family Structure
Vehicle Availability
Education Level
Disability

Married-couple Households Comparison

Blackfeet

South Africans

Tragic
Excellent
43.8%
MARRIED-COUPLE HOUSEHOLDS
0.2/ 100
METRIC RATING
257th/ 347
METRIC RANK
47.3%
MARRIED-COUPLE HOUSEHOLDS
86.4/ 100
METRIC RATING
133rd/ 347
METRIC RANK

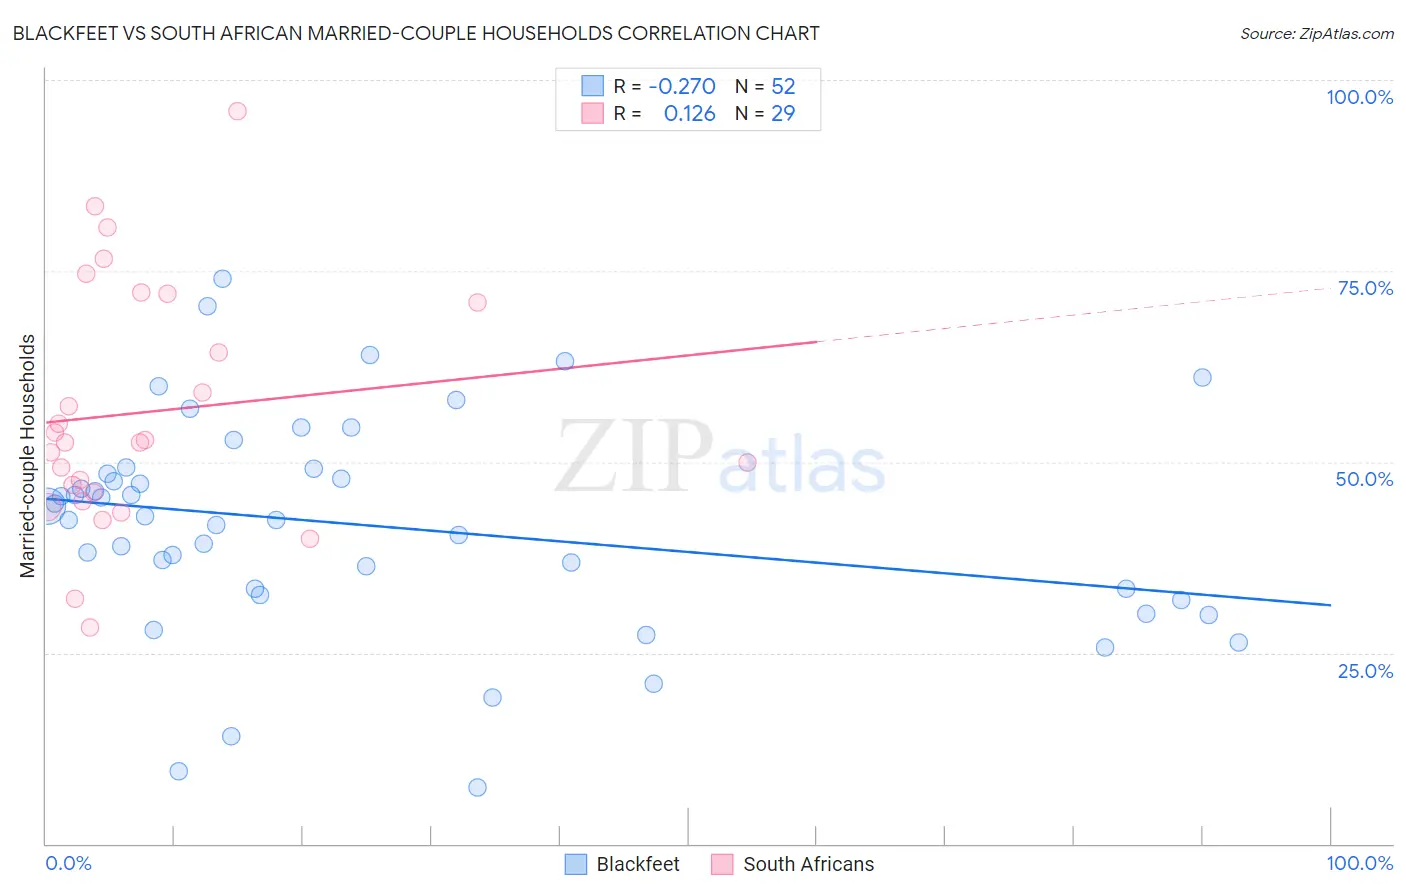
Blackfeet vs South African Married-couple Households Correlation Chart

The statistical analysis conducted on geographies consisting of 309,469,352 people shows a weak negative correlation between the proportion of Blackfeet and percentage of married-couple family households in the United States with a correlation coefficient (R) of -0.270 and weighted average of 43.8%. Similarly, the statistical analysis conducted on geographies consisting of 182,537,045 people shows a poor positive correlation between the proportion of South Africans and percentage of married-couple family households in the United States with a correlation coefficient (R) of 0.126 and weighted average of 47.3%, a difference of 8.0%.
Blackfeet vs South African Married-couple Households

Married-couple Households Correlation Summary

MeasurementBlackfeetSouth African
Minimum7.3%28.3%
Maximum74.0%96.0%
Range66.7%67.7%
Mean41.7%56.6%
Median42.7%52.6%
Interquartile 25% (IQ1)33.0%45.4%
Interquartile 75% (IQ3)48.8%71.4%
Interquartile Range (IQR)15.8%26.0%
Standard Deviation (Sample)14.3%16.0%
Standard Deviation (Population)14.1%15.7%

Similar Demographics by Married-couple Households

Demographics Similar to Blackfeet by Married-couple Households

In terms of married-couple households, the demographic groups most similar to Blackfeet are Central American Indian (43.8%, a difference of 0.040%), Iroquois (43.7%, a difference of 0.070%), Immigrants from Cameroon (43.7%, a difference of 0.15%), Ugandan (43.8%, a difference of 0.16%), and Alaskan Athabascan (43.6%, a difference of 0.28%).
DemographicsRating | RankMarried-couple Households
French American Indians
0.4
/100
|
#250
Tragic
44.1%
German Russians
0.4
/100
|
#251
Tragic
44.0%
Seminole
0.4
/100
|
#252
Tragic
44.0%
Central Americans
0.3
/100
|
#253
Tragic
43.9%
Apache
0.3
/100
|
#254
Tragic
43.9%
Shoshone
0.3
/100
|
#255
Tragic
43.9%
Ugandans
0.3
/100
|
#256
Tragic
43.8%
Blackfeet
0.2
/100
|
#257
Tragic
43.8%
Central American Indians
0.2
/100
|
#258
Tragic
43.8%
Iroquois
0.2
/100
|
#259
Tragic
43.7%
Immigrants | Cameroon
0.2
/100
|
#260
Tragic
43.7%
Alaskan Athabascans
0.2
/100
|
#261
Tragic
43.6%
Vietnamese
0.2
/100
|
#262
Tragic
43.6%
Cree
0.1
/100
|
#263
Tragic
43.6%
Bangladeshis
0.1
/100
|
#264
Tragic
43.5%

Demographics Similar to South Africans by Married-couple Households

In terms of married-couple households, the demographic groups most similar to South Africans are Immigrants from Ukraine (47.3%, a difference of 0.020%), Immigrants from Greece (47.2%, a difference of 0.040%), Immigrants from Argentina (47.2%, a difference of 0.040%), Immigrants from Denmark (47.3%, a difference of 0.090%), and New Zealander (47.2%, a difference of 0.090%).
DemographicsRating | RankMarried-couple Households
Pakistanis
88.6
/100
|
#126
Excellent
47.3%
Celtics
88.1
/100
|
#127
Excellent
47.3%
Immigrants | Peru
87.9
/100
|
#128
Excellent
47.3%
Immigrants | Iraq
87.8
/100
|
#129
Excellent
47.3%
Immigrants | Hungary
87.8
/100
|
#130
Excellent
47.3%
Immigrants | Denmark
87.5
/100
|
#131
Excellent
47.3%
Immigrants | Ukraine
86.7
/100
|
#132
Excellent
47.3%
South Africans
86.4
/100
|
#133
Excellent
47.3%
Immigrants | Greece
86.0
/100
|
#134
Excellent
47.2%
Immigrants | Argentina
86.0
/100
|
#135
Excellent
47.2%
New Zealanders
85.3
/100
|
#136
Excellent
47.2%
Immigrants | Malaysia
85.2
/100
|
#137
Excellent
47.2%
Immigrants | Afghanistan
85.1
/100
|
#138
Excellent
47.2%
Immigrants | Sweden
84.7
/100
|
#139
Excellent
47.2%
Spanish
84.5
/100
|
#140
Excellent
47.2%