Osage vs Subsaharan African Married-couple Households

COMPARE

Osage
Race
Ancestry
AfghanAfricanAlaska NativeAlaskan AthabascanAlbanianAleutAlsatianAmericanApacheArabArapahoArgentineanArmenianAssyrian/Chaldean/SyriacAustralianAustrianBahamianBangladeshiBarbadianBasqueBelgianBelizeanBermudanBhutaneseBlackfeetBolivianBrazilianBritishBritish West IndianBulgarianBurmeseCajunCambodianCanadianCape VerdeanCarpatho RusynCelticCentral AmericanCentral American IndianCherokeeCheyenneChickasawChileanChineseChippewaChoctawColombianColvilleComancheCosta RicanCreeCreekCroatianCrowCubanCypriotCzechCzechoslovakianDanishDelawareDominicanDutchDutch West IndianEastern EuropeanEcuadorianEgyptianEnglishEstonianEthiopianEuropeanFijianFilipinoFinnishFrenchFrench American IndianFrench CanadianGermanGerman RussianGhanaianGreekGuamanian/ChamorroGuatemalanGuyaneseHaitianHmongHonduranHopiHoumaHungarianIcelanderIndian (Asian)IndonesianInupiatIranianIraqiIrishIroquoisIsraeliItalianJamaicanJapaneseJordanianKenyanKiowaKoreanLaotianLatvianLebaneseLiberianLithuanianLumbeeLuxembourgerMacedonianMalaysianMalteseMarshalleseMenomineeMexicanMexican American IndianMongolianMoroccanNative HawaiianNavajoNepaleseNew ZealanderNicaraguanNigerianNorthern EuropeanNorwegianOkinawanOsageOttawaPaiutePakistaniPalestinianPanamanianParaguayanPennsylvania GermanPeruvianPimaPolishPortuguesePotawatomiPuebloPuerto RicanPuget Sound SalishRomanianRussianSalvadoranSamoanScandinavianScotch-IrishScottishSeminoleSenegaleseSerbianShoshoneSierra LeoneanSiouxSlavicSlovakSloveneSomaliSouth AfricanSouth AmericanSouth American IndianSoviet UnionSpaniardSpanishSpanish AmericanSpanish American IndianSri LankanSudaneseSwedishSwissSyrianTaiwaneseThaiTlingit-HaidaTohono O'OdhamTonganTrinidadian and TobagonianTsimshianTurkishU.S. Virgin IslanderUgandanUkrainianUruguayanUteVenezuelanVietnameseWelshWest IndianYakamaYaquiYugoslavianYumanYup'ikZimbabwean
Immigration
NonimmigrantsImmigrantsAfghanistanAfricaAlbaniaArgentinaArmeniaAsiaAustraliaAustriaBahamasBangladeshBarbadosBelarusBelgiumBelizeBoliviaBosnia and HerzegovinaBrazilBulgariaBurma/MyanmarCabo VerdeCambodiaCameroonCanadaCaribbeanCentral AmericaChileChinaColombiaCongoCosta RicaCroatiaCubaCzechoslovakiaDenmarkDominicaDominican RepublicEastern AfricaEastern AsiaEastern EuropeEcuadorEgyptEl SalvadorEnglandEritreaEthiopiaEuropeFijiFranceGermanyGhanaGreeceGrenadaGuatemalaGuyanaHaitiHondurasHong KongHungaryIndiaIndonesiaIranIraqIrelandIsraelItalyJamaicaJapanJordanKazakhstanKenyaKoreaKuwaitLaosLatin AmericaLatviaLebanonLiberiaLithuaniaMalaysiaMexicoMicronesiaMiddle AfricaMoldovaMoroccoNepalNetherlandsNicaraguaNigeriaNorth AmericaNorth MacedoniaNorthern AfricaNorthern EuropeNorwayOceaniaPakistanPanamaPeruPhilippinesPolandPortugalRomaniaRussiaSaudi ArabiaScotlandSenegalSerbiaSierra LeoneSingaporeSomaliaSouth AfricaSouth AmericaSouth Central AsiaSouth Eastern AsiaSouthern EuropeSpainSri LankaSt. Vincent and the GrenadinesSudanSwedenSwitzerlandSyriaTaiwanThailandTrinidad and TobagoTurkeyUgandaUkraineUruguayUzbekistanVenezuelaVietnamWest IndiesWestern AfricaWestern AsiaWestern EuropeYemenZaireZimbabweAzores
Subsaharan African
Race
Ancestry
AfghanAfricanAlaska NativeAlaskan AthabascanAlbanianAleutAlsatianAmericanApacheArabArapahoArgentineanArmenianAssyrian/Chaldean/SyriacAustralianAustrianBahamianBangladeshiBarbadianBasqueBelgianBelizeanBermudanBhutaneseBlackfeetBolivianBrazilianBritishBritish West IndianBulgarianBurmeseCajunCambodianCanadianCape VerdeanCarpatho RusynCelticCentral AmericanCentral American IndianCherokeeCheyenneChickasawChileanChineseChippewaChoctawColombianColvilleComancheCosta RicanCreeCreekCroatianCrowCubanCypriotCzechCzechoslovakianDanishDelawareDominicanDutchDutch West IndianEastern EuropeanEcuadorianEgyptianEnglishEstonianEthiopianEuropeanFijianFilipinoFinnishFrenchFrench American IndianFrench CanadianGermanGerman RussianGhanaianGreekGuamanian/ChamorroGuatemalanGuyaneseHaitianHmongHonduranHopiHoumaHungarianIcelanderIndian (Asian)IndonesianInupiatIranianIraqiIrishIroquoisIsraeliItalianJamaicanJapaneseJordanianKenyanKiowaKoreanLaotianLatvianLebaneseLiberianLithuanianLumbeeLuxembourgerMacedonianMalaysianMalteseMarshalleseMenomineeMexicanMexican American IndianMongolianMoroccanNative HawaiianNavajoNepaleseNew ZealanderNicaraguanNigerianNorthern EuropeanNorwegianOkinawanOttawaPaiutePakistaniPalestinianPanamanianParaguayanPennsylvania GermanPeruvianPimaPolishPortuguesePotawatomiPuebloPuerto RicanPuget Sound SalishRomanianRussianSalvadoranSamoanScandinavianScotch-IrishScottishSeminoleSenegaleseSerbianShoshoneSierra LeoneanSiouxSlavicSlovakSloveneSomaliSouth AfricanSouth AmericanSouth American IndianSoviet UnionSpaniardSpanishSpanish AmericanSpanish American IndianSri LankanSubsaharan AfricanSudaneseSwedishSwissSyrianTaiwaneseThaiTlingit-HaidaTohono O'OdhamTonganTrinidadian and TobagonianTsimshianTurkishU.S. Virgin IslanderUgandanUkrainianUruguayanUteVenezuelanVietnameseWelshWest IndianYakamaYaquiYugoslavianYumanYup'ikZimbabwean
Immigration
NonimmigrantsImmigrantsAfghanistanAfricaAlbaniaArgentinaArmeniaAsiaAustraliaAustriaBahamasBangladeshBarbadosBelarusBelgiumBelizeBoliviaBosnia and HerzegovinaBrazilBulgariaBurma/MyanmarCabo VerdeCambodiaCameroonCanadaCaribbeanCentral AmericaChileChinaColombiaCongoCosta RicaCroatiaCubaCzechoslovakiaDenmarkDominicaDominican RepublicEastern AfricaEastern AsiaEastern EuropeEcuadorEgyptEl SalvadorEnglandEritreaEthiopiaEuropeFijiFranceGermanyGhanaGreeceGrenadaGuatemalaGuyanaHaitiHondurasHong KongHungaryIndiaIndonesiaIranIraqIrelandIsraelItalyJamaicaJapanJordanKazakhstanKenyaKoreaKuwaitLaosLatin AmericaLatviaLebanonLiberiaLithuaniaMalaysiaMexicoMicronesiaMiddle AfricaMoldovaMoroccoNepalNetherlandsNicaraguaNigeriaNorth AmericaNorth MacedoniaNorthern AfricaNorthern EuropeNorwayOceaniaPakistanPanamaPeruPhilippinesPolandPortugalRomaniaRussiaSaudi ArabiaScotlandSenegalSerbiaSierra LeoneSingaporeSomaliaSouth AfricaSouth AmericaSouth Central AsiaSouth Eastern AsiaSouthern EuropeSpainSri LankaSt. Vincent and the GrenadinesSudanSwedenSwitzerlandSyriaTaiwanThailandTrinidad and TobagoTurkeyUgandaUkraineUruguayUzbekistanVenezuelaVietnamWest IndiesWestern AfricaWestern AsiaWestern EuropeYemenZaireZimbabweAzores
Married-couple Households
Income
Poverty
Unemployment
Labor Participation
Family Structure
Vehicle Availability
Education Level
Disability

Married-couple Households Comparison

Osage

Sub-Saharan Africans

Good
Tragic
46.9%
MARRIED-COUPLE HOUSEHOLDS
73.2/ 100
METRIC RATING
159th/ 347
METRIC RANK
41.6%
MARRIED-COUPLE HOUSEHOLDS
0.0/ 100
METRIC RATING
303rd/ 347
METRIC RANK

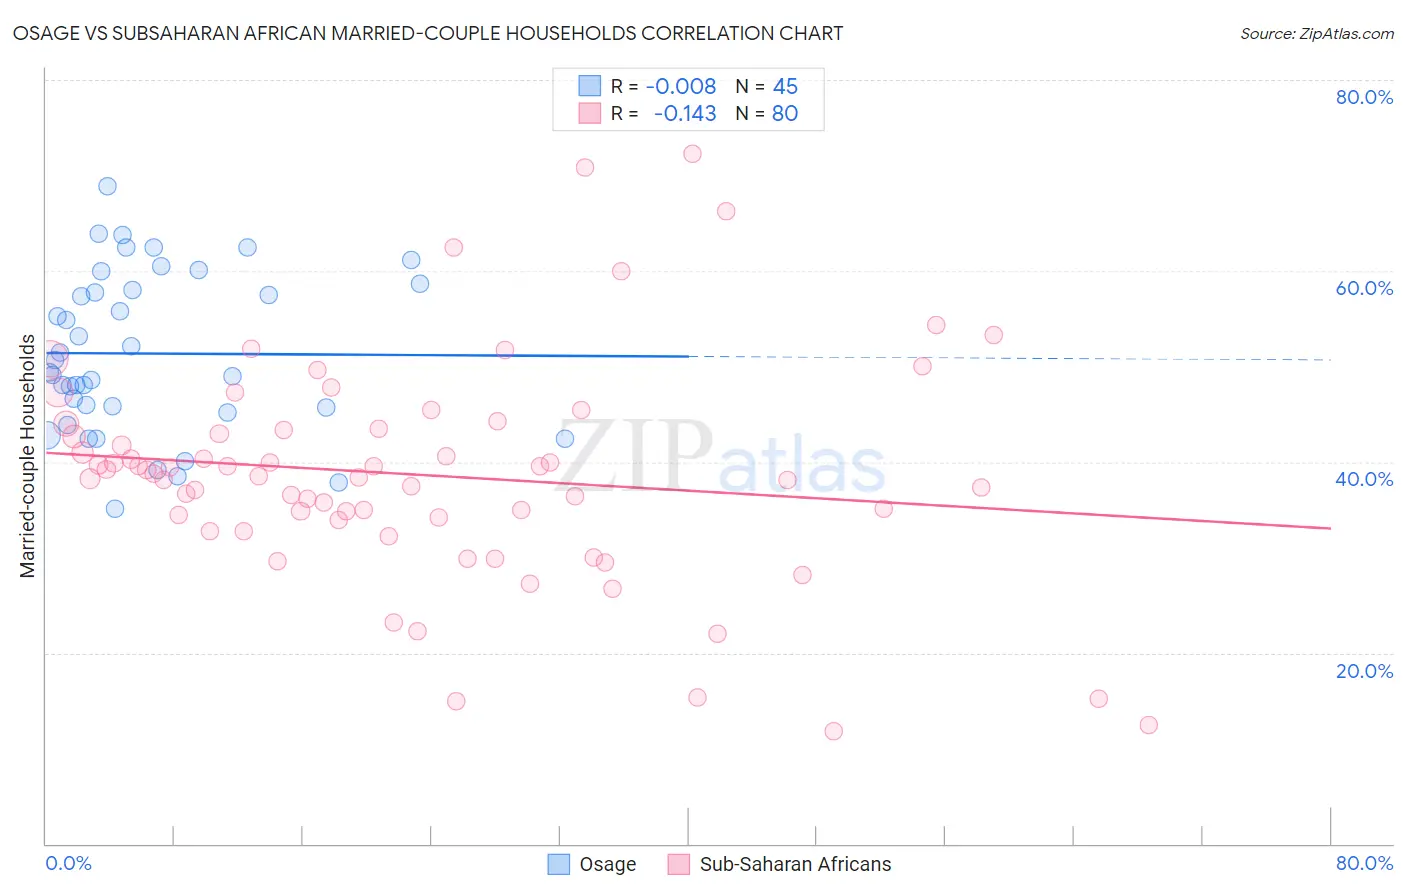
Osage vs Subsaharan African Married-couple Households Correlation Chart

The statistical analysis conducted on geographies consisting of 91,797,548 people shows no correlation between the proportion of Osage and percentage of married-couple family households in the United States with a correlation coefficient (R) of -0.008 and weighted average of 46.9%. Similarly, the statistical analysis conducted on geographies consisting of 507,572,233 people shows a poor negative correlation between the proportion of Sub-Saharan Africans and percentage of married-couple family households in the United States with a correlation coefficient (R) of -0.143 and weighted average of 41.6%, a difference of 12.7%.
Osage vs Subsaharan African Married-couple Households

Married-couple Households Correlation Summary

MeasurementOsageSubsaharan African
Minimum35.1%11.8%
Maximum68.9%72.3%
Range33.8%60.5%
Mean51.3%38.7%
Median49.4%38.6%
Interquartile 25% (IQ1)45.5%34.1%
Interquartile 75% (IQ3)58.3%43.4%
Interquartile Range (IQR)12.9%9.3%
Standard Deviation (Sample)8.3%11.6%
Standard Deviation (Population)8.2%11.5%

Similar Demographics by Married-couple Households

Demographics Similar to Osage by Married-couple Households

In terms of married-couple households, the demographic groups most similar to Osage are Nonimmigrants (46.9%, a difference of 0.0%), Iraqi (46.9%, a difference of 0.070%), Immigrants from Oceania (46.9%, a difference of 0.080%), Delaware (46.8%, a difference of 0.090%), and Armenian (46.9%, a difference of 0.10%).
DemographicsRating | RankMarried-couple Households
Serbians
76.3
/100
|
#152
Good
47.0%
Hmong
76.2
/100
|
#153
Good
47.0%
Immigrants | Western Asia
76.1
/100
|
#154
Good
46.9%
Arabs
76.0
/100
|
#155
Good
46.9%
Armenians
75.4
/100
|
#156
Good
46.9%
Immigrants | Oceania
74.8
/100
|
#157
Good
46.9%
Immigrants | Nonimmigrants
73.3
/100
|
#158
Good
46.9%
Osage
73.2
/100
|
#159
Good
46.9%
Iraqis
71.7
/100
|
#160
Good
46.9%
Delaware
71.2
/100
|
#161
Good
46.8%
Colombians
71.0
/100
|
#162
Good
46.8%
Immigrants | Turkey
70.2
/100
|
#163
Good
46.8%
Immigrants | Kazakhstan
70.0
/100
|
#164
Good
46.8%
Immigrants | Southern Europe
69.9
/100
|
#165
Good
46.8%
Cherokee
65.7
/100
|
#166
Good
46.7%

Demographics Similar to Sub-Saharan Africans by Married-couple Households

In terms of married-couple households, the demographic groups most similar to Sub-Saharan Africans are Immigrants from Honduras (41.6%, a difference of 0.0%), Immigrants from Guyana (41.6%, a difference of 0.11%), Immigrants from Bahamas (41.7%, a difference of 0.18%), Sioux (41.5%, a difference of 0.22%), and Immigrants from Belize (41.8%, a difference of 0.39%).
DemographicsRating | RankMarried-couple Households
Immigrants | Sudan
0.0
/100
|
#296
Tragic
41.9%
Arapaho
0.0
/100
|
#297
Tragic
41.8%
Immigrants | Middle Africa
0.0
/100
|
#298
Tragic
41.8%
Immigrants | Ghana
0.0
/100
|
#299
Tragic
41.8%
Immigrants | Belize
0.0
/100
|
#300
Tragic
41.8%
Immigrants | Bahamas
0.0
/100
|
#301
Tragic
41.7%
Immigrants | Honduras
0.0
/100
|
#302
Tragic
41.6%
Sub-Saharan Africans
0.0
/100
|
#303
Tragic
41.6%
Immigrants | Guyana
0.0
/100
|
#304
Tragic
41.6%
Sioux
0.0
/100
|
#305
Tragic
41.5%
Guyanese
0.0
/100
|
#306
Tragic
41.4%
Immigrants | Western Africa
0.0
/100
|
#307
Tragic
41.4%
Crow
0.0
/100
|
#308
Tragic
41.4%
Immigrants | Trinidad and Tobago
0.0
/100
|
#309
Tragic
41.2%
Haitians
0.0
/100
|
#310
Tragic
41.2%