Colombian vs Guamanian/Chamorro Married-couple Households

COMPARE

Colombian
Race
Ancestry
AfghanAfricanAlaska NativeAlaskan AthabascanAlbanianAleutAlsatianAmericanApacheArabArapahoArgentineanArmenianAssyrian/Chaldean/SyriacAustralianAustrianBahamianBangladeshiBarbadianBasqueBelgianBelizeanBermudanBhutaneseBlackfeetBolivianBrazilianBritishBritish West IndianBulgarianBurmeseCajunCambodianCanadianCape VerdeanCarpatho RusynCelticCentral AmericanCentral American IndianCherokeeCheyenneChickasawChileanChineseChippewaChoctawColombianColvilleComancheCosta RicanCreeCreekCroatianCrowCubanCypriotCzechCzechoslovakianDanishDelawareDominicanDutchDutch West IndianEastern EuropeanEcuadorianEgyptianEnglishEstonianEthiopianEuropeanFijianFilipinoFinnishFrenchFrench American IndianFrench CanadianGermanGerman RussianGhanaianGreekGuatemalanGuyaneseHaitianHmongHonduranHopiHoumaHungarianIcelanderIndian (Asian)IndonesianInupiatIranianIraqiIrishIroquoisIsraeliItalianJamaicanJapaneseJordanianKenyanKiowaKoreanLaotianLatvianLebaneseLiberianLithuanianLumbeeLuxembourgerMacedonianMalaysianMalteseMarshalleseMenomineeMexicanMexican American IndianMongolianMoroccanNative HawaiianNavajoNepaleseNew ZealanderNicaraguanNigerianNorthern EuropeanNorwegianOkinawanOsageOttawaPaiutePakistaniPalestinianPanamanianParaguayanPennsylvania GermanPeruvianPimaPolishPortuguesePotawatomiPuebloPuerto RicanPuget Sound SalishRomanianRussianSalvadoranSamoanScandinavianScotch-IrishScottishSeminoleSenegaleseSerbianShoshoneSierra LeoneanSiouxSlavicSlovakSloveneSomaliSouth AfricanSouth AmericanSouth American IndianSoviet UnionSpaniardSpanishSpanish AmericanSpanish American IndianSri LankanSubsaharan AfricanSudaneseSwedishSwissSyrianTaiwaneseThaiTlingit-HaidaTohono O'OdhamTonganTrinidadian and TobagonianTsimshianTurkishU.S. Virgin IslanderUgandanUkrainianUruguayanUteVenezuelanVietnameseWelshWest IndianYakamaYaquiYugoslavianYumanYup'ikZimbabwean
Immigration
NonimmigrantsImmigrantsAfghanistanAfricaAlbaniaArgentinaArmeniaAsiaAustraliaAustriaBahamasBangladeshBarbadosBelarusBelgiumBelizeBoliviaBosnia and HerzegovinaBrazilBulgariaBurma/MyanmarCabo VerdeCambodiaCameroonCanadaCaribbeanCentral AmericaChileChinaColombiaCongoCosta RicaCroatiaCubaCzechoslovakiaDenmarkDominicaDominican RepublicEastern AfricaEastern AsiaEastern EuropeEcuadorEgyptEl SalvadorEnglandEritreaEthiopiaEuropeFijiFranceGermanyGhanaGreeceGrenadaGuatemalaGuyanaHaitiHondurasHong KongHungaryIndiaIndonesiaIranIraqIrelandIsraelItalyJamaicaJapanJordanKazakhstanKenyaKoreaKuwaitLaosLatin AmericaLatviaLebanonLiberiaLithuaniaMalaysiaMexicoMicronesiaMiddle AfricaMoldovaMoroccoNepalNetherlandsNicaraguaNigeriaNorth AmericaNorth MacedoniaNorthern AfricaNorthern EuropeNorwayOceaniaPakistanPanamaPeruPhilippinesPolandPortugalRomaniaRussiaSaudi ArabiaScotlandSenegalSerbiaSierra LeoneSingaporeSomaliaSouth AfricaSouth AmericaSouth Central AsiaSouth Eastern AsiaSouthern EuropeSpainSri LankaSt. Vincent and the GrenadinesSudanSwedenSwitzerlandSyriaTaiwanThailandTrinidad and TobagoTurkeyUgandaUkraineUruguayUzbekistanVenezuelaVietnamWest IndiesWestern AfricaWestern AsiaWestern EuropeYemenZaireZimbabweAzores
Guamanian/Chamorro
Race
Ancestry
AfghanAfricanAlaska NativeAlaskan AthabascanAlbanianAleutAlsatianAmericanApacheArabArapahoArgentineanArmenianAssyrian/Chaldean/SyriacAustralianAustrianBahamianBangladeshiBarbadianBasqueBelgianBelizeanBermudanBhutaneseBlackfeetBolivianBrazilianBritishBritish West IndianBulgarianBurmeseCajunCambodianCanadianCape VerdeanCarpatho RusynCelticCentral AmericanCentral American IndianCherokeeCheyenneChickasawChileanChineseChippewaChoctawColvilleComancheCosta RicanCreeCreekCroatianCrowCubanCypriotCzechCzechoslovakianDanishDelawareDominicanDutchDutch West IndianEastern EuropeanEcuadorianEgyptianEnglishEstonianEthiopianEuropeanFijianFilipinoFinnishFrenchFrench American IndianFrench CanadianGermanGerman RussianGhanaianGreekGuamanian/ChamorroGuatemalanGuyaneseHaitianHmongHonduranHopiHoumaHungarianIcelanderIndian (Asian)IndonesianInupiatIranianIraqiIrishIroquoisIsraeliItalianJamaicanJapaneseJordanianKenyanKiowaKoreanLaotianLatvianLebaneseLiberianLithuanianLumbeeLuxembourgerMacedonianMalaysianMalteseMarshalleseMenomineeMexicanMexican American IndianMongolianMoroccanNative HawaiianNavajoNepaleseNew ZealanderNicaraguanNigerianNorthern EuropeanNorwegianOkinawanOsageOttawaPaiutePakistaniPalestinianPanamanianParaguayanPennsylvania GermanPeruvianPimaPolishPortuguesePotawatomiPuebloPuerto RicanPuget Sound SalishRomanianRussianSalvadoranSamoanScandinavianScotch-IrishScottishSeminoleSenegaleseSerbianShoshoneSierra LeoneanSiouxSlavicSlovakSloveneSomaliSouth AfricanSouth AmericanSouth American IndianSoviet UnionSpaniardSpanishSpanish AmericanSpanish American IndianSri LankanSubsaharan AfricanSudaneseSwedishSwissSyrianTaiwaneseThaiTlingit-HaidaTohono O'OdhamTonganTrinidadian and TobagonianTsimshianTurkishU.S. Virgin IslanderUgandanUkrainianUruguayanUteVenezuelanVietnameseWelshWest IndianYakamaYaquiYugoslavianYumanYup'ikZimbabwean
Immigration
NonimmigrantsImmigrantsAfghanistanAfricaAlbaniaArgentinaArmeniaAsiaAustraliaAustriaBahamasBangladeshBarbadosBelarusBelgiumBelizeBoliviaBosnia and HerzegovinaBrazilBulgariaBurma/MyanmarCabo VerdeCambodiaCameroonCanadaCaribbeanCentral AmericaChileChinaColombiaCongoCosta RicaCroatiaCubaCzechoslovakiaDenmarkDominicaDominican RepublicEastern AfricaEastern AsiaEastern EuropeEcuadorEgyptEl SalvadorEnglandEritreaEthiopiaEuropeFijiFranceGermanyGhanaGreeceGrenadaGuatemalaGuyanaHaitiHondurasHong KongHungaryIndiaIndonesiaIranIraqIrelandIsraelItalyJamaicaJapanJordanKazakhstanKenyaKoreaKuwaitLaosLatin AmericaLatviaLebanonLiberiaLithuaniaMalaysiaMexicoMicronesiaMiddle AfricaMoldovaMoroccoNepalNetherlandsNicaraguaNigeriaNorth AmericaNorth MacedoniaNorthern AfricaNorthern EuropeNorwayOceaniaPakistanPanamaPeruPhilippinesPolandPortugalRomaniaRussiaSaudi ArabiaScotlandSenegalSerbiaSierra LeoneSingaporeSomaliaSouth AfricaSouth AmericaSouth Central AsiaSouth Eastern AsiaSouthern EuropeSpainSri LankaSt. Vincent and the GrenadinesSudanSwedenSwitzerlandSyriaTaiwanThailandTrinidad and TobagoTurkeyUgandaUkraineUruguayUzbekistanVenezuelaVietnamWest IndiesWestern AfricaWestern AsiaWestern EuropeYemenZaireZimbabweAzores
Married-couple Households
Income
Poverty
Unemployment
Labor Participation
Family Structure
Vehicle Availability
Education Level
Disability

Married-couple Households Comparison

Colombians

Guamanians/Chamorros

Good
Exceptional
46.8%
MARRIED-COUPLE HOUSEHOLDS
71.0/ 100
METRIC RATING
162nd/ 347
METRIC RANK
48.1%
MARRIED-COUPLE HOUSEHOLDS
97.6/ 100
METRIC RATING
83rd/ 347
METRIC RANK

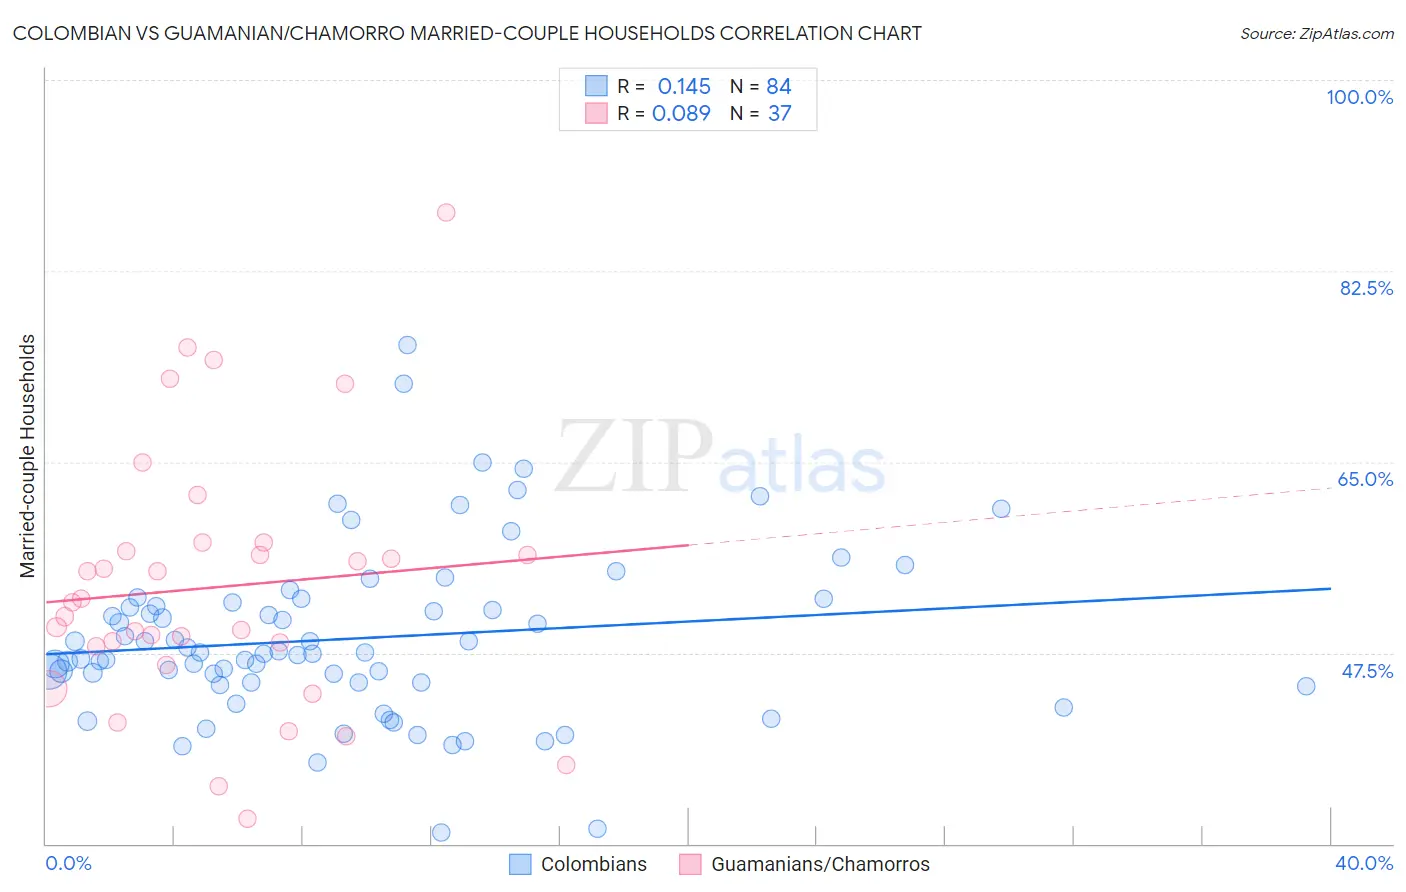
Colombian vs Guamanian/Chamorro Married-couple Households Correlation Chart

The statistical analysis conducted on geographies consisting of 419,302,145 people shows a poor positive correlation between the proportion of Colombians and percentage of married-couple family households in the United States with a correlation coefficient (R) of 0.145 and weighted average of 46.8%. Similarly, the statistical analysis conducted on geographies consisting of 221,863,144 people shows a slight positive correlation between the proportion of Guamanians/Chamorros and percentage of married-couple family households in the United States with a correlation coefficient (R) of 0.089 and weighted average of 48.1%, a difference of 2.6%.
Colombian vs Guamanian/Chamorro Married-couple Households

Married-couple Households Correlation Summary

MeasurementColombianGuamanian/Chamorro
Minimum31.0%32.3%
Maximum75.7%87.9%
Range44.7%55.5%
Mean48.8%53.5%
Median47.5%52.1%
Interquartile 25% (IQ1)44.8%47.3%
Interquartile 75% (IQ3)51.9%57.2%
Interquartile Range (IQR)7.1%9.9%
Standard Deviation (Sample)7.8%11.9%
Standard Deviation (Population)7.8%11.7%

Similar Demographics by Married-couple Households

Demographics Similar to Colombians by Married-couple Households

In terms of married-couple households, the demographic groups most similar to Colombians are Delaware (46.8%, a difference of 0.010%), Iraqi (46.9%, a difference of 0.030%), Immigrants from Turkey (46.8%, a difference of 0.040%), Immigrants from Kazakhstan (46.8%, a difference of 0.050%), and Immigrants from Southern Europe (46.8%, a difference of 0.050%).
DemographicsRating | RankMarried-couple Households
Arabs
76.0
/100
|
#155
Good
46.9%
Armenians
75.4
/100
|
#156
Good
46.9%
Immigrants | Oceania
74.8
/100
|
#157
Good
46.9%
Immigrants | Nonimmigrants
73.3
/100
|
#158
Good
46.9%
Osage
73.2
/100
|
#159
Good
46.9%
Iraqis
71.7
/100
|
#160
Good
46.9%
Delaware
71.2
/100
|
#161
Good
46.8%
Colombians
71.0
/100
|
#162
Good
46.8%
Immigrants | Turkey
70.2
/100
|
#163
Good
46.8%
Immigrants | Kazakhstan
70.0
/100
|
#164
Good
46.8%
Immigrants | Southern Europe
69.9
/100
|
#165
Good
46.8%
Cherokee
65.7
/100
|
#166
Good
46.7%
Immigrants | Croatia
64.2
/100
|
#167
Good
46.7%
Israelis
62.3
/100
|
#168
Good
46.7%
Spanish American Indians
59.4
/100
|
#169
Average
46.6%

Demographics Similar to Guamanians/Chamorros by Married-couple Households

In terms of married-couple households, the demographic groups most similar to Guamanians/Chamorros are Immigrants from Poland (48.1%, a difference of 0.020%), Ukrainian (48.1%, a difference of 0.020%), Immigrants from Israel (48.0%, a difference of 0.070%), Belgian (48.0%, a difference of 0.090%), and Immigrants from Ireland (48.0%, a difference of 0.11%).
DemographicsRating | RankMarried-couple Households
Immigrants | Fiji
98.4
/100
|
#76
Exceptional
48.2%
Canadians
98.2
/100
|
#77
Exceptional
48.2%
Egyptians
98.2
/100
|
#78
Exceptional
48.2%
Immigrants | Netherlands
98.2
/100
|
#79
Exceptional
48.2%
Russians
98.1
/100
|
#80
Exceptional
48.2%
Finns
98.0
/100
|
#81
Exceptional
48.1%
Immigrants | Poland
97.7
/100
|
#82
Exceptional
48.1%
Guamanians/Chamorros
97.6
/100
|
#83
Exceptional
48.1%
Ukrainians
97.6
/100
|
#84
Exceptional
48.1%
Immigrants | Israel
97.4
/100
|
#85
Exceptional
48.0%
Belgians
97.4
/100
|
#86
Exceptional
48.0%
Immigrants | Ireland
97.3
/100
|
#87
Exceptional
48.0%
Afghans
97.3
/100
|
#88
Exceptional
48.0%
Cypriots
97.2
/100
|
#89
Exceptional
48.0%
French
97.2
/100
|
#90
Exceptional
48.0%