Black/African American Disability Age 18 to 34
COMPARE
Black/African American
Select to Compare
Disability Age 18 to 34
Black/African American Disability Age 18 to 34
7.7%
DISABILITY | AGE 18 TO 34
0.0/ 100
METRIC RATING
292nd/ 347
METRIC RANK
Black/African American Disability Age 18 to 34 Correlation Chart
The statistical analysis conducted on geographies consisting of 561,495,678 people shows a substantial positive correlation between the proportion of Blacks/African Americans and percentage of population with a disability between the ages 18 and 35 in the United States with a correlation coefficient (R) of 0.593 and weighted average of 7.7%. On average, for every 1% (one percent) increase in Blacks/African Americans within a typical geography, there is an increase of 0.031% in percentage of population with a disability between the ages 18 and 35.
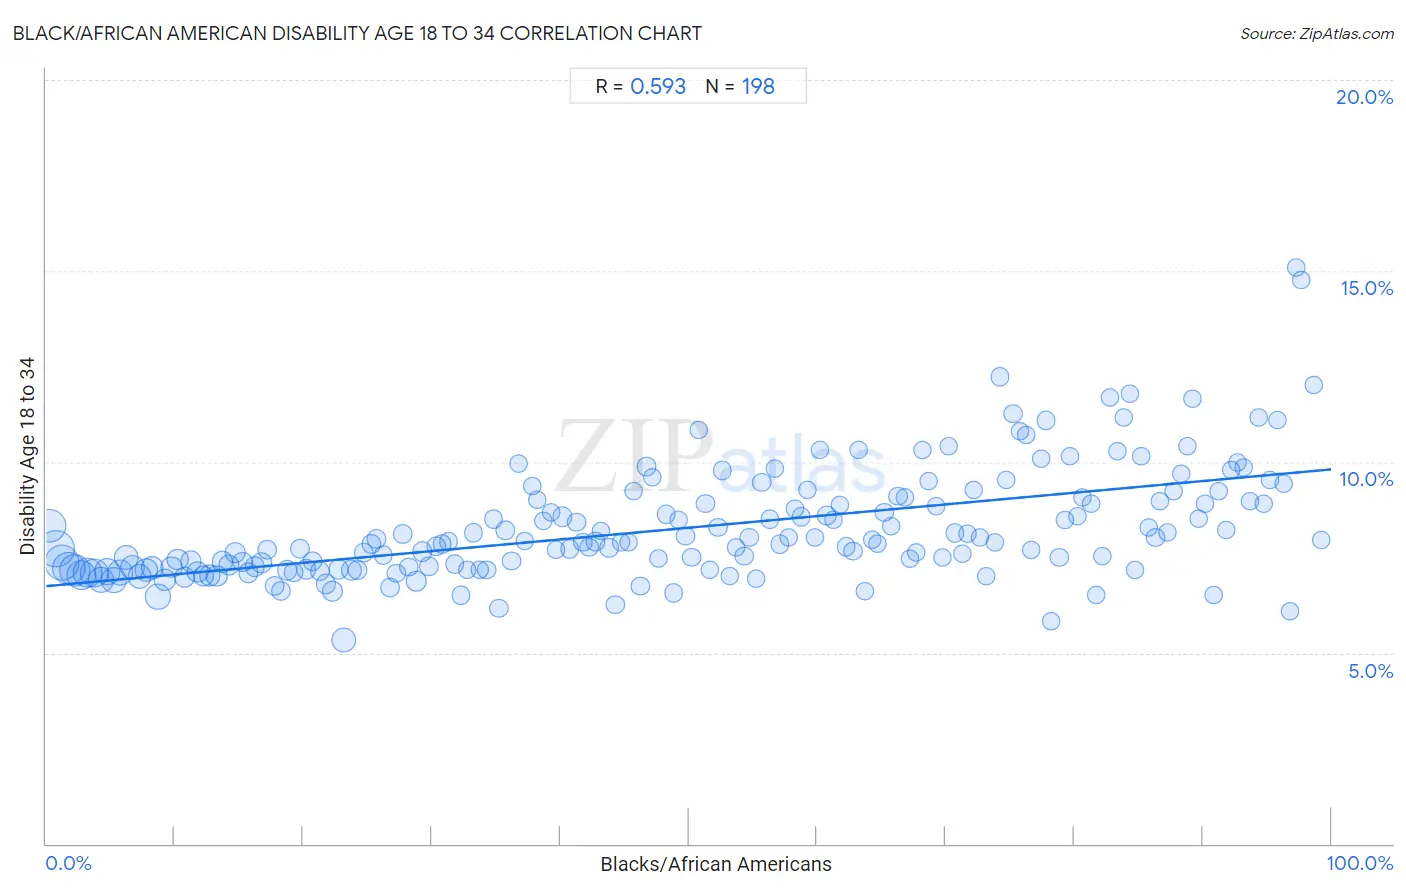
It is essential to understand that the correlation between the percentage of Blacks/African Americans and percentage of population with a disability between the ages 18 and 35 does not imply a direct cause-and-effect relationship. It remains uncertain whether the presence of Blacks/African Americans influences an upward or downward trend in the level of percentage of population with a disability between the ages 18 and 35 within an area, or if Blacks/African Americans simply ended up residing in those areas with higher or lower levels of percentage of population with a disability between the ages 18 and 35 due to other factors.
Demographics Similar to Blacks/African Americans by Disability Age 18 to 34
In terms of disability age 18 to 34, the demographic groups most similar to Blacks/African Americans are Scandinavian (7.7%, a difference of 0.060%), Immigrants from Cabo Verde (7.7%, a difference of 0.21%), Irish (7.7%, a difference of 0.22%), Tlingit-Haida (7.7%, a difference of 0.22%), and Slovak (7.7%, a difference of 0.27%).
| Demographics | Rating | Rank | Disability Age 18 to 34 |
| Swedes | 0.0 /100 | #285 | Tragic 7.5% |
| Celtics | 0.0 /100 | #286 | Tragic 7.6% |
| Norwegians | 0.0 /100 | #287 | Tragic 7.6% |
| Whites/Caucasians | 0.0 /100 | #288 | Tragic 7.6% |
| Nonimmigrants | 0.0 /100 | #289 | Tragic 7.6% |
| Slovaks | 0.0 /100 | #290 | Tragic 7.7% |
| Irish | 0.0 /100 | #291 | Tragic 7.7% |
| Blacks/African Americans | 0.0 /100 | #292 | Tragic 7.7% |
| Scandinavians | 0.0 /100 | #293 | Tragic 7.7% |
| Immigrants from Cabo Verde | 0.0 /100 | #294 | Tragic 7.7% |
| Tlingit-Haida | 0.0 /100 | #295 | Tragic 7.7% |
| Cape Verdeans | 0.0 /100 | #296 | Tragic 7.7% |
| Pueblo | 0.0 /100 | #297 | Tragic 7.7% |
| Dutch | 0.0 /100 | #298 | Tragic 7.7% |
| Germans | 0.0 /100 | #299 | Tragic 7.7% |
Black/African American Disability Age 18 to 34 Correlation Summary
| Measurement | Black/African American Data | Disability Age 18 to 34 Data |
| Minimum | 0.26% | 5.3% |
| Maximum | 99.2% | 15.1% |
| Range | 99.0% | 9.7% |
| Mean | 49.5% | 8.3% |
| Median | 49.5% | 7.9% |
| Interquartile 25% (IQ1) | 24.7% | 7.2% |
| Interquartile 75% (IQ3) | 74.3% | 9.0% |
| Interquartile Range (IQR) | 49.5% | 1.8% |
| Standard Deviation (Sample) | 28.7% | 1.5% |
| Standard Deviation (Population) | 28.6% | 1.5% |
Correlation Details
| Black/African American Percentile | Sample Size | Disability Age 18 to 34 |
[ 0.0% - 0.5% ] 0.26% | 29,605,488 | 8.3% |
[ 0.5% - 1.0% ] 0.74% | 34,982,163 | 7.7% |
[ 1.0% - 1.5% ] 1.23% | 32,089,460 | 7.4% |
[ 1.5% - 2.0% ] 1.74% | 27,748,391 | 7.2% |
[ 2.0% - 2.5% ] 2.24% | 24,220,107 | 7.2% |
[ 2.5% - 3.0% ] 2.75% | 20,634,060 | 7.0% |
[ 3.0% - 3.5% ] 3.25% | 20,611,013 | 7.1% |
[ 3.5% - 4.0% ] 3.74% | 16,729,583 | 7.1% |
[ 4.0% - 4.5% ] 4.24% | 14,555,178 | 6.9% |
[ 4.5% - 5.0% ] 4.74% | 14,871,898 | 7.1% |
[ 5.0% - 5.5% ] 5.24% | 13,565,321 | 6.9% |
[ 5.5% - 6.0% ] 5.76% | 13,769,710 | 7.1% |
[ 6.0% - 6.5% ] 6.23% | 11,771,883 | 7.5% |
[ 6.5% - 7.0% ] 6.72% | 11,700,276 | 7.2% |
[ 7.0% - 7.5% ] 7.26% | 10,944,889 | 7.0% |
[ 7.5% - 8.0% ] 7.75% | 9,084,756 | 7.2% |
[ 8.0% - 8.5% ] 8.24% | 8,271,256 | 7.2% |
[ 8.5% - 9.0% ] 8.69% | 12,374,722 | 6.5% |
[ 9.0% - 9.5% ] 9.24% | 7,606,737 | 6.9% |
[ 9.5% - 10.0% ] 9.75% | 5,913,348 | 7.2% |
[ 10.0% - 10.5% ] 10.26% | 6,407,975 | 7.4% |
[ 10.5% - 11.0% ] 10.76% | 6,036,949 | 7.0% |
[ 11.0% - 11.5% ] 11.27% | 5,978,275 | 7.4% |
[ 11.5% - 12.0% ] 11.75% | 6,639,709 | 7.1% |
[ 12.0% - 12.5% ] 12.24% | 5,821,763 | 7.0% |
[ 12.5% - 13.0% ] 12.73% | 5,201,953 | 7.0% |
[ 13.0% - 13.5% ] 13.26% | 5,582,977 | 7.0% |
[ 13.5% - 14.0% ] 13.72% | 4,974,064 | 7.4% |
[ 14.0% - 14.5% ] 14.22% | 4,355,739 | 7.3% |
[ 14.5% - 15.0% ] 14.73% | 4,180,021 | 7.6% |
[ 15.0% - 15.5% ] 15.25% | 4,392,103 | 7.4% |
[ 15.5% - 16.0% ] 15.75% | 3,584,694 | 7.1% |
[ 16.0% - 16.5% ] 16.25% | 3,252,429 | 7.3% |
[ 16.5% - 17.0% ] 16.75% | 3,390,778 | 7.4% |
[ 17.0% - 17.5% ] 17.22% | 3,474,607 | 7.7% |
[ 17.5% - 18.0% ] 17.77% | 3,674,581 | 6.8% |
[ 18.0% - 18.5% ] 18.26% | 3,598,136 | 6.6% |
[ 18.5% - 19.0% ] 18.73% | 3,662,893 | 7.2% |
[ 19.0% - 19.5% ] 19.23% | 3,046,676 | 7.1% |
[ 19.5% - 20.0% ] 19.75% | 2,541,768 | 7.7% |
[ 20.0% - 20.5% ] 20.23% | 2,758,214 | 7.2% |
[ 20.5% - 21.0% ] 20.77% | 2,350,791 | 7.4% |
[ 21.0% - 21.5% ] 21.29% | 2,720,482 | 7.1% |
[ 21.5% - 22.0% ] 21.77% | 3,745,414 | 6.8% |
[ 22.0% - 22.5% ] 22.31% | 4,852,615 | 6.6% |
[ 22.5% - 23.0% ] 22.72% | 3,015,128 | 7.2% |
[ 23.0% - 23.5% ] 23.15% | 11,610,796 | 5.3% |
[ 23.5% - 24.0% ] 23.75% | 3,970,292 | 7.2% |
[ 24.0% - 24.5% ] 24.22% | 2,177,092 | 7.2% |
[ 24.5% - 25.0% ] 24.74% | 1,972,170 | 7.6% |
[ 25.0% - 25.5% ] 25.28% | 1,576,638 | 7.9% |
[ 25.5% - 26.0% ] 25.71% | 1,463,408 | 8.0% |
[ 26.0% - 26.5% ] 26.22% | 1,906,711 | 7.6% |
[ 26.5% - 27.0% ] 26.77% | 2,125,298 | 6.7% |
[ 27.0% - 27.5% ] 27.23% | 1,786,883 | 7.1% |
[ 27.5% - 28.0% ] 27.75% | 1,486,206 | 8.1% |
[ 28.0% - 28.5% ] 28.22% | 1,983,850 | 7.2% |
[ 28.5% - 29.0% ] 28.80% | 4,734,064 | 6.9% |
[ 29.0% - 29.5% ] 29.24% | 3,233,396 | 7.7% |
[ 29.5% - 30.0% ] 29.77% | 1,873,058 | 7.3% |
[ 30.0% - 30.5% ] 30.35% | 2,242,977 | 7.8% |
[ 30.5% - 31.0% ] 30.81% | 1,183,686 | 7.8% |
[ 31.0% - 31.5% ] 31.29% | 961,751 | 7.9% |
[ 31.5% - 32.0% ] 31.80% | 1,016,522 | 7.3% |
[ 32.0% - 32.5% ] 32.27% | 1,267,155 | 6.5% |
[ 32.5% - 33.0% ] 32.74% | 731,261 | 7.2% |
[ 33.0% - 33.5% ] 33.25% | 1,245,984 | 8.1% |
[ 33.5% - 34.0% ] 33.75% | 911,085 | 7.2% |
[ 34.0% - 34.5% ] 34.28% | 828,448 | 7.2% |
[ 34.5% - 35.0% ] 34.79% | 918,936 | 8.5% |
[ 35.0% - 35.5% ] 35.24% | 1,757,056 | 6.2% |
[ 35.5% - 36.0% ] 35.74% | 1,276,681 | 8.2% |
[ 36.0% - 36.5% ] 36.23% | 1,180,201 | 7.4% |
[ 36.5% - 37.0% ] 36.75% | 562,113 | 10.0% |
[ 37.0% - 37.5% ] 37.25% | 922,590 | 7.9% |
[ 37.5% - 38.0% ] 37.80% | 825,233 | 9.4% |
[ 38.0% - 38.5% ] 38.18% | 937,922 | 9.0% |
[ 38.5% - 39.0% ] 38.70% | 1,440,685 | 8.5% |
[ 39.0% - 39.5% ] 39.31% | 524,760 | 8.7% |
[ 39.5% - 40.0% ] 39.68% | 911,290 | 7.7% |
[ 40.0% - 40.5% ] 40.16% | 2,708,104 | 8.6% |
[ 40.5% - 41.0% ] 40.73% | 1,182,441 | 7.7% |
[ 41.0% - 41.5% ] 41.26% | 1,027,405 | 8.4% |
[ 41.5% - 42.0% ] 41.76% | 961,645 | 7.9% |
[ 42.0% - 42.5% ] 42.25% | 879,428 | 7.8% |
[ 42.5% - 43.0% ] 42.73% | 1,017,061 | 7.9% |
[ 43.0% - 43.5% ] 43.19% | 1,010,252 | 8.2% |
[ 43.5% - 44.0% ] 43.82% | 997,677 | 7.7% |
[ 44.0% - 44.5% ] 44.29% | 1,185,337 | 6.3% |
[ 44.5% - 45.0% ] 44.74% | 679,581 | 7.9% |
[ 45.0% - 45.5% ] 45.34% | 695,178 | 7.9% |
[ 45.5% - 46.0% ] 45.74% | 598,080 | 9.2% |
[ 46.0% - 46.5% ] 46.24% | 746,190 | 6.7% |
[ 46.5% - 47.0% ] 46.72% | 1,068,441 | 9.9% |
[ 47.0% - 47.5% ] 47.16% | 742,911 | 9.6% |
[ 47.5% - 48.0% ] 47.65% | 1,069,912 | 7.5% |
[ 48.0% - 48.5% ] 48.26% | 297,412 | 8.6% |
[ 48.5% - 49.0% ] 48.84% | 482,905 | 6.6% |
[ 49.0% - 49.5% ] 49.22% | 481,859 | 8.5% |
[ 49.5% - 50.0% ] 49.74% | 551,203 | 8.1% |
[ 50.0% - 50.5% ] 50.24% | 939,404 | 7.5% |
[ 50.5% - 51.0% ] 50.77% | 194,809 | 10.8% |
[ 51.0% - 51.5% ] 51.29% | 577,266 | 8.9% |
[ 51.5% - 52.0% ] 51.63% | 659,107 | 7.2% |
[ 52.0% - 52.5% ] 52.28% | 534,637 | 8.3% |
[ 52.5% - 53.0% ] 52.63% | 670,605 | 9.8% |
[ 53.0% - 53.5% ] 53.22% | 696,237 | 7.0% |
[ 53.5% - 54.0% ] 53.72% | 387,332 | 7.8% |
[ 54.0% - 54.5% ] 54.32% | 685,616 | 7.5% |
[ 54.5% - 55.0% ] 54.71% | 353,093 | 8.0% |
[ 55.0% - 55.5% ] 55.28% | 443,484 | 6.9% |
[ 55.5% - 56.0% ] 55.68% | 468,787 | 9.5% |
[ 56.0% - 56.5% ] 56.31% | 563,911 | 8.5% |
[ 56.5% - 57.0% ] 56.67% | 515,536 | 9.8% |
[ 57.0% - 57.5% ] 57.10% | 684,997 | 7.8% |
[ 57.5% - 58.0% ] 57.77% | 309,508 | 8.0% |
[ 58.0% - 58.5% ] 58.25% | 367,681 | 8.8% |
[ 58.5% - 59.0% ] 58.76% | 283,379 | 8.6% |
[ 59.0% - 59.5% ] 59.21% | 332,903 | 9.3% |
[ 59.5% - 60.0% ] 59.79% | 362,429 | 8.0% |
[ 60.0% - 60.5% ] 60.22% | 269,290 | 10.3% |
[ 60.5% - 61.0% ] 60.74% | 451,535 | 8.6% |
[ 61.0% - 61.5% ] 61.26% | 881,080 | 8.5% |
[ 61.5% - 62.0% ] 61.72% | 421,608 | 8.9% |
[ 62.0% - 62.5% ] 62.27% | 433,318 | 7.8% |
[ 62.5% - 63.0% ] 62.78% | 513,033 | 7.7% |
[ 63.0% - 63.5% ] 63.24% | 299,263 | 10.3% |
[ 63.5% - 64.0% ] 63.75% | 415,269 | 6.6% |
[ 64.0% - 64.5% ] 64.30% | 1,041,446 | 8.0% |
[ 64.5% - 65.0% ] 64.71% | 329,560 | 7.9% |
[ 65.0% - 65.5% ] 65.21% | 544,092 | 8.7% |
[ 65.5% - 66.0% ] 65.77% | 282,490 | 8.3% |
[ 66.0% - 66.5% ] 66.29% | 268,804 | 9.1% |
[ 66.5% - 67.0% ] 66.83% | 337,836 | 9.1% |
[ 67.0% - 67.5% ] 67.20% | 240,245 | 7.5% |
[ 67.5% - 68.0% ] 67.68% | 192,157 | 7.6% |
[ 68.0% - 68.5% ] 68.16% | 156,553 | 10.3% |
[ 68.5% - 69.0% ] 68.63% | 497,464 | 9.5% |
[ 69.0% - 69.5% ] 69.26% | 202,547 | 8.8% |
[ 69.5% - 70.0% ] 69.77% | 130,657 | 7.5% |
[ 70.0% - 70.5% ] 70.26% | 270,404 | 10.4% |
[ 70.5% - 71.0% ] 70.70% | 389,808 | 8.1% |
[ 71.0% - 71.5% ] 71.27% | 303,846 | 7.6% |
[ 71.5% - 72.0% ] 71.71% | 220,814 | 8.1% |
[ 72.0% - 72.5% ] 72.20% | 233,807 | 9.3% |
[ 72.5% - 73.0% ] 72.65% | 181,365 | 8.0% |
[ 73.0% - 73.5% ] 73.16% | 261,578 | 7.0% |
[ 73.5% - 74.0% ] 73.79% | 352,294 | 7.9% |
[ 74.0% - 74.5% ] 74.25% | 249,047 | 12.2% |
[ 74.5% - 75.0% ] 74.67% | 274,014 | 9.5% |
[ 75.0% - 75.5% ] 75.24% | 177,292 | 11.3% |
[ 75.5% - 76.0% ] 75.77% | 255,251 | 10.8% |
[ 76.0% - 76.5% ] 76.30% | 239,112 | 10.7% |
[ 76.5% - 77.0% ] 76.66% | 114,919 | 7.7% |
[ 77.0% - 77.5% ] 77.39% | 232,232 | 10.1% |
[ 77.5% - 78.0% ] 77.78% | 836,747 | 11.1% |
[ 78.0% - 78.5% ] 78.22% | 223,665 | 5.8% |
[ 78.5% - 79.0% ] 78.83% | 262,093 | 7.5% |
[ 79.0% - 79.5% ] 79.27% | 271,727 | 8.5% |
[ 79.5% - 80.0% ] 79.71% | 131,761 | 10.1% |
[ 80.0% - 80.5% ] 80.21% | 285,799 | 8.6% |
[ 80.5% - 81.0% ] 80.65% | 231,821 | 9.1% |
[ 81.0% - 81.5% ] 81.30% | 239,631 | 8.9% |
[ 81.5% - 82.0% ] 81.68% | 297,746 | 6.5% |
[ 82.0% - 82.5% ] 82.19% | 444,006 | 7.5% |
[ 82.5% - 83.0% ] 82.74% | 163,121 | 11.7% |
[ 83.0% - 83.5% ] 83.34% | 86,054 | 10.3% |
[ 83.5% - 84.0% ] 83.87% | 63,105 | 11.1% |
[ 84.0% - 84.5% ] 84.33% | 187,263 | 11.8% |
[ 84.5% - 85.0% ] 84.73% | 165,734 | 7.2% |
[ 85.0% - 85.5% ] 85.25% | 143,736 | 10.1% |
[ 85.5% - 86.0% ] 85.78% | 142,098 | 8.3% |
[ 86.0% - 86.5% ] 86.33% | 142,101 | 8.0% |
[ 86.5% - 87.0% ] 86.65% | 271,184 | 9.0% |
[ 87.0% - 87.5% ] 87.27% | 170,311 | 8.1% |
[ 87.5% - 88.0% ] 87.74% | 205,850 | 9.2% |
[ 88.0% - 88.5% ] 88.28% | 148,381 | 9.7% |
[ 88.5% - 89.0% ] 88.77% | 206,694 | 10.4% |
[ 89.0% - 89.5% ] 89.17% | 150,708 | 11.7% |
[ 89.5% - 90.0% ] 89.70% | 222,792 | 8.5% |
[ 90.0% - 90.5% ] 90.19% | 85,085 | 8.9% |
[ 90.5% - 91.0% ] 90.87% | 100,866 | 6.5% |
[ 91.0% - 91.5% ] 91.23% | 371,317 | 9.2% |
[ 91.5% - 92.0% ] 91.80% | 139,975 | 8.2% |
[ 92.0% - 92.5% ] 92.26% | 94,578 | 9.8% |
[ 92.5% - 93.0% ] 92.70% | 158,464 | 10.0% |
[ 93.0% - 93.5% ] 93.22% | 188,401 | 9.9% |
[ 93.5% - 94.0% ] 93.70% | 268,943 | 9.0% |
[ 94.0% - 94.5% ] 94.37% | 117,347 | 11.2% |
[ 94.5% - 95.0% ] 94.72% | 105,757 | 8.9% |
[ 95.0% - 95.5% ] 95.23% | 87,287 | 9.5% |
[ 95.5% - 96.0% ] 95.81% | 77,528 | 11.1% |
[ 96.0% - 96.5% ] 96.27% | 44,518 | 9.4% |
[ 96.5% - 97.0% ] 96.81% | 11,639 | 6.1% |
[ 97.0% - 97.5% ] 97.31% | 2,379 | 15.1% |
[ 97.5% - 98.0% ] 97.71% | 2,313 | 14.8% |
[ 98.5% - 99.0% ] 98.62% | 16,061 | 12.0% |
[ 99.0% - 99.5% ] 99.22% | 14,148 | 7.9% |