Black/African American No Schooling Completed
COMPARE
Black/African American
Select to Compare
No Schooling Completed
Black/African American No Schooling Completed
2.1%
NO SCHOOLING
41.4/ 100
METRIC RATING
183rd/ 347
METRIC RANK
Black/African American No Schooling Completed Correlation Chart
The statistical analysis conducted on geographies consisting of 551,024,391 people shows a poor negative correlation between the proportion of Blacks/African Americans and percentage of population with no schooling in the United States with a correlation coefficient (R) of -0.132 and weighted average of 2.1%. On average, for every 1% (one percent) increase in Blacks/African Americans within a typical geography, there is a decrease of 0.0021% in percentage of population with no schooling.
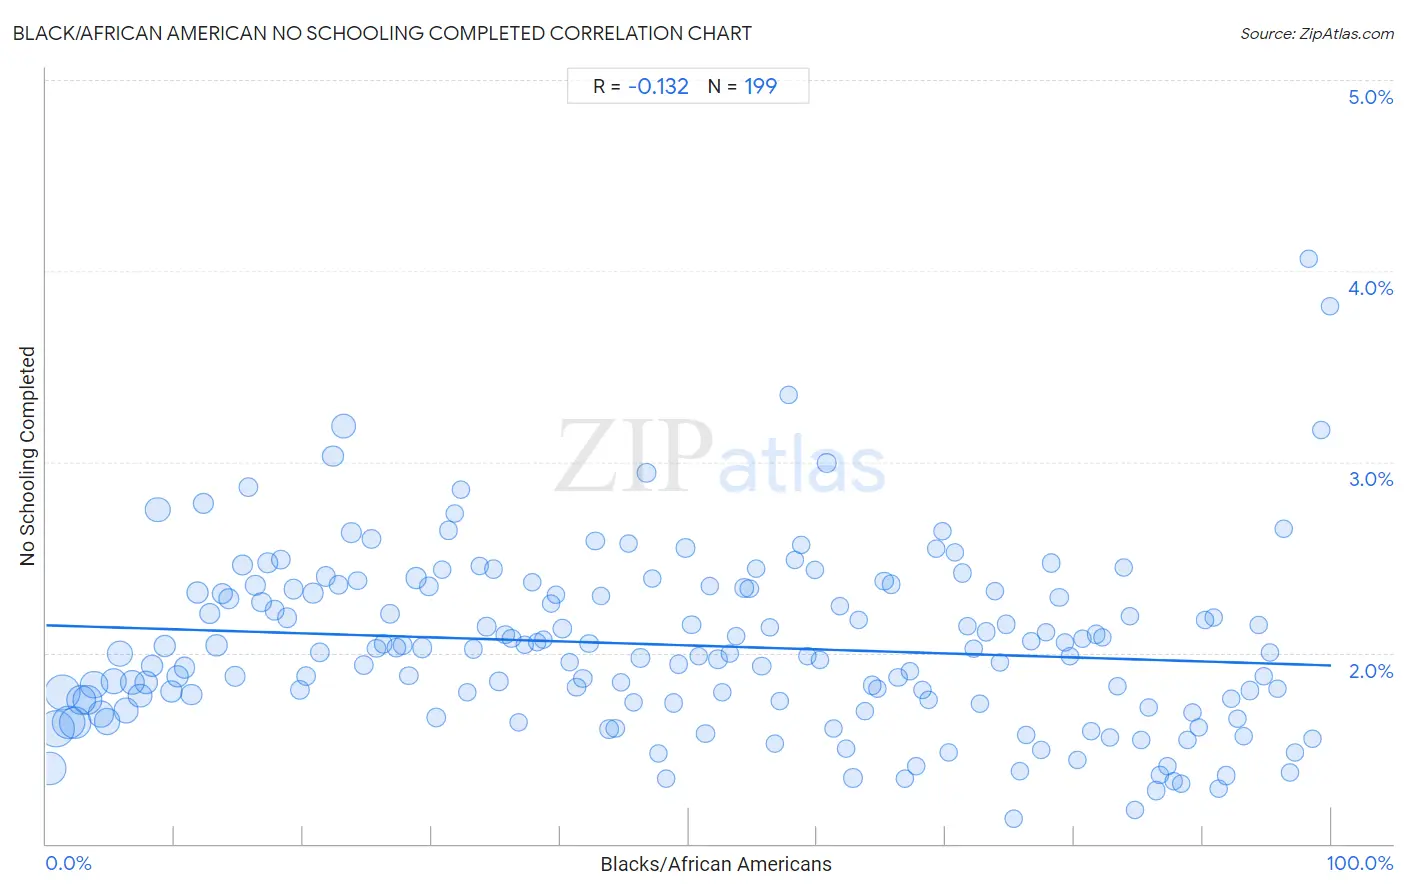
It is essential to understand that the correlation between the percentage of Blacks/African Americans and percentage of population with no schooling does not imply a direct cause-and-effect relationship. It remains uncertain whether the presence of Blacks/African Americans influences an upward or downward trend in the level of percentage of population with no schooling within an area, or if Blacks/African Americans simply ended up residing in those areas with higher or lower levels of percentage of population with no schooling due to other factors.
Demographics Similar to Blacks/African Americans by No Schooling Completed
In terms of no schooling completed, the demographic groups most similar to Blacks/African Americans are Pima (2.1%, a difference of 0.020%), Mongolian (2.1%, a difference of 0.090%), French American Indian (2.1%, a difference of 0.10%), Immigrants from Taiwan (2.1%, a difference of 0.15%), and Portuguese (2.1%, a difference of 0.33%).
| Demographics | Rating | Rank | No Schooling Completed |
| Panamanians | 45.2 /100 | #176 | Average 2.1% |
| Arapaho | 45.0 /100 | #177 | Average 2.1% |
| Pakistanis | 44.7 /100 | #178 | Average 2.1% |
| Immigrants from Kazakhstan | 44.3 /100 | #179 | Average 2.1% |
| Portuguese | 43.9 /100 | #180 | Average 2.1% |
| Immigrants from Taiwan | 42.6 /100 | #181 | Average 2.1% |
| French American Indians | 42.2 /100 | #182 | Average 2.1% |
| Blacks/African Americans | 41.4 /100 | #183 | Average 2.1% |
| Pima | 41.3 /100 | #184 | Average 2.1% |
| Mongolians | 40.8 /100 | #185 | Average 2.1% |
| Immigrants from Bosnia and Herzegovina | 38.6 /100 | #186 | Fair 2.1% |
| Navajo | 36.5 /100 | #187 | Fair 2.1% |
| Immigrants from Kenya | 36.2 /100 | #188 | Fair 2.1% |
| Immigrants from Egypt | 36.1 /100 | #189 | Fair 2.1% |
| Spanish Americans | 32.6 /100 | #190 | Fair 2.1% |
Black/African American No Schooling Completed Correlation Summary
| Measurement | Black/African American Data | No Schooling Completed Data |
| Minimum | 0.26% | 1.1% |
| Maximum | 99.9% | 4.1% |
| Range | 99.7% | 2.9% |
| Mean | 49.8% | 2.0% |
| Median | 49.7% | 2.0% |
| Interquartile 25% (IQ1) | 24.7% | 1.7% |
| Interquartile 75% (IQ3) | 74.7% | 2.3% |
| Interquartile Range (IQR) | 49.9% | 0.59% |
| Standard Deviation (Sample) | 28.8% | 0.46% |
| Standard Deviation (Population) | 28.7% | 0.46% |
Correlation Details
| Black/African American Percentile | Sample Size | No Schooling Completed |
[ 0.0% - 0.5% ] 0.26% | 27,528,990 | 1.4% |
[ 0.5% - 1.0% ] 0.74% | 33,184,606 | 1.6% |
[ 1.0% - 1.5% ] 1.23% | 30,904,889 | 1.8% |
[ 1.5% - 2.0% ] 1.74% | 27,028,221 | 1.6% |
[ 2.0% - 2.5% ] 2.24% | 23,646,043 | 1.6% |
[ 2.5% - 3.0% ] 2.75% | 20,217,791 | 1.8% |
[ 3.0% - 3.5% ] 3.25% | 20,195,915 | 1.8% |
[ 3.5% - 4.0% ] 3.74% | 16,546,956 | 1.8% |
[ 4.0% - 4.5% ] 4.24% | 14,351,358 | 1.7% |
[ 4.5% - 5.0% ] 4.74% | 14,648,348 | 1.6% |
[ 5.0% - 5.5% ] 5.24% | 13,364,442 | 1.9% |
[ 5.5% - 6.0% ] 5.76% | 13,609,105 | 2.0% |
[ 6.0% - 6.5% ] 6.23% | 11,602,414 | 1.7% |
[ 6.5% - 7.0% ] 6.72% | 11,563,887 | 1.8% |
[ 7.0% - 7.5% ] 7.26% | 10,822,466 | 1.8% |
[ 7.5% - 8.0% ] 7.75% | 8,996,321 | 1.8% |
[ 8.0% - 8.5% ] 8.24% | 8,198,855 | 1.9% |
[ 8.5% - 9.0% ] 8.69% | 12,323,982 | 2.8% |
[ 9.0% - 9.5% ] 9.24% | 7,517,166 | 2.0% |
[ 9.5% - 10.0% ] 9.75% | 5,860,941 | 1.8% |
[ 10.0% - 10.5% ] 10.26% | 6,369,487 | 1.9% |
[ 10.5% - 11.0% ] 10.76% | 5,959,052 | 1.9% |
[ 11.0% - 11.5% ] 11.27% | 5,896,762 | 1.8% |
[ 11.5% - 12.0% ] 11.75% | 6,565,868 | 2.3% |
[ 12.0% - 12.5% ] 12.24% | 5,738,250 | 2.8% |
[ 12.5% - 13.0% ] 12.73% | 5,173,906 | 2.2% |
[ 13.0% - 13.5% ] 13.26% | 5,563,632 | 2.0% |
[ 13.5% - 14.0% ] 13.72% | 4,960,589 | 2.3% |
[ 14.0% - 14.5% ] 14.23% | 4,326,997 | 2.3% |
[ 14.5% - 15.0% ] 14.73% | 4,144,853 | 1.9% |
[ 15.0% - 15.5% ] 15.25% | 4,333,660 | 2.5% |
[ 15.5% - 16.0% ] 15.75% | 3,560,817 | 2.9% |
[ 16.0% - 16.5% ] 16.25% | 3,202,072 | 2.4% |
[ 16.5% - 17.0% ] 16.75% | 3,324,314 | 2.3% |
[ 17.0% - 17.5% ] 17.21% | 3,445,599 | 2.5% |
[ 17.5% - 18.0% ] 17.77% | 3,648,469 | 2.2% |
[ 18.0% - 18.5% ] 18.26% | 3,569,957 | 2.5% |
[ 18.5% - 19.0% ] 18.73% | 3,614,342 | 2.2% |
[ 19.0% - 19.5% ] 19.23% | 3,023,081 | 2.3% |
[ 19.5% - 20.0% ] 19.75% | 2,518,267 | 1.8% |
[ 20.0% - 20.5% ] 20.23% | 2,728,583 | 1.9% |
[ 20.5% - 21.0% ] 20.76% | 2,343,771 | 2.3% |
[ 21.0% - 21.5% ] 21.29% | 2,713,544 | 2.0% |
[ 21.5% - 22.0% ] 21.77% | 3,727,292 | 2.4% |
[ 22.0% - 22.5% ] 22.31% | 4,846,222 | 3.0% |
[ 22.5% - 23.0% ] 22.72% | 3,010,385 | 2.4% |
[ 23.0% - 23.5% ] 23.15% | 11,569,377 | 3.2% |
[ 23.5% - 24.0% ] 23.75% | 3,946,294 | 2.6% |
[ 24.0% - 24.5% ] 24.22% | 2,162,334 | 2.4% |
[ 24.5% - 25.0% ] 24.74% | 1,964,471 | 1.9% |
[ 25.0% - 25.5% ] 25.28% | 1,562,865 | 2.6% |
[ 25.5% - 26.0% ] 25.71% | 1,454,958 | 2.0% |
[ 26.0% - 26.5% ] 26.22% | 1,862,622 | 2.0% |
[ 26.5% - 27.0% ] 26.77% | 2,125,525 | 2.2% |
[ 27.0% - 27.5% ] 27.23% | 1,770,994 | 2.0% |
[ 27.5% - 28.0% ] 27.75% | 1,477,813 | 2.0% |
[ 28.0% - 28.5% ] 28.22% | 1,966,188 | 1.9% |
[ 28.5% - 29.0% ] 28.80% | 4,740,688 | 2.4% |
[ 29.0% - 29.5% ] 29.24% | 3,221,043 | 2.0% |
[ 29.5% - 30.0% ] 29.77% | 1,843,499 | 2.3% |
[ 30.0% - 30.5% ] 30.36% | 2,188,295 | 1.7% |
[ 30.5% - 31.0% ] 30.81% | 1,182,105 | 2.4% |
[ 31.0% - 31.5% ] 31.29% | 963,556 | 2.6% |
[ 31.5% - 32.0% ] 31.79% | 1,000,914 | 2.7% |
[ 32.0% - 32.5% ] 32.27% | 1,264,398 | 2.9% |
[ 32.5% - 33.0% ] 32.74% | 725,101 | 1.8% |
[ 33.0% - 33.5% ] 33.25% | 1,251,397 | 2.0% |
[ 33.5% - 34.0% ] 33.75% | 906,861 | 2.5% |
[ 34.0% - 34.5% ] 34.28% | 822,100 | 2.1% |
[ 34.5% - 35.0% ] 34.79% | 920,811 | 2.4% |
[ 35.0% - 35.5% ] 35.24% | 1,749,920 | 1.8% |
[ 35.5% - 36.0% ] 35.74% | 1,285,142 | 2.1% |
[ 36.0% - 36.5% ] 36.23% | 1,176,636 | 2.1% |
[ 36.5% - 37.0% ] 36.74% | 539,404 | 1.6% |
[ 37.0% - 37.5% ] 37.25% | 916,865 | 2.0% |
[ 37.5% - 38.0% ] 37.80% | 810,124 | 2.4% |
[ 38.0% - 38.5% ] 38.19% | 949,600 | 2.1% |
[ 38.5% - 39.0% ] 38.70% | 1,444,936 | 2.1% |
[ 39.0% - 39.5% ] 39.31% | 519,371 | 2.3% |
[ 39.5% - 40.0% ] 39.68% | 911,152 | 2.3% |
[ 40.0% - 40.5% ] 40.16% | 2,712,248 | 2.1% |
[ 40.5% - 41.0% ] 40.73% | 1,176,194 | 2.0% |
[ 41.0% - 41.5% ] 41.26% | 1,026,883 | 1.8% |
[ 41.5% - 42.0% ] 41.76% | 950,048 | 1.9% |
[ 42.0% - 42.5% ] 42.25% | 879,585 | 2.0% |
[ 42.5% - 43.0% ] 42.73% | 1,020,004 | 2.6% |
[ 43.0% - 43.5% ] 43.19% | 1,005,855 | 2.3% |
[ 43.5% - 44.0% ] 43.82% | 989,710 | 1.6% |
[ 44.0% - 44.5% ] 44.29% | 1,184,862 | 1.6% |
[ 44.5% - 45.0% ] 44.74% | 664,007 | 1.8% |
[ 45.0% - 45.5% ] 45.34% | 693,223 | 2.6% |
[ 45.5% - 46.0% ] 45.74% | 594,969 | 1.7% |
[ 46.0% - 46.5% ] 46.24% | 720,561 | 2.0% |
[ 46.5% - 47.0% ] 46.72% | 1,064,642 | 2.9% |
[ 47.0% - 47.5% ] 47.16% | 738,417 | 2.4% |
[ 47.5% - 48.0% ] 47.64% | 1,054,663 | 1.5% |
[ 48.0% - 48.5% ] 48.26% | 291,705 | 1.3% |
[ 48.5% - 49.0% ] 48.84% | 488,657 | 1.7% |
[ 49.0% - 49.5% ] 49.22% | 475,823 | 1.9% |
[ 49.5% - 50.0% ] 49.74% | 546,717 | 2.5% |
[ 50.0% - 50.5% ] 50.24% | 934,477 | 2.1% |
[ 50.5% - 51.0% ] 50.77% | 194,701 | 2.0% |
[ 51.0% - 51.5% ] 51.29% | 572,277 | 1.6% |
[ 51.5% - 52.0% ] 51.63% | 652,743 | 2.3% |
[ 52.0% - 52.5% ] 52.28% | 534,428 | 2.0% |
[ 52.5% - 53.0% ] 52.63% | 669,521 | 1.8% |
[ 53.0% - 53.5% ] 53.22% | 688,955 | 2.0% |
[ 53.5% - 54.0% ] 53.72% | 379,039 | 2.1% |
[ 54.0% - 54.5% ] 54.32% | 686,401 | 2.3% |
[ 54.5% - 55.0% ] 54.71% | 351,531 | 2.3% |
[ 55.0% - 55.5% ] 55.28% | 446,945 | 2.4% |
[ 55.5% - 56.0% ] 55.69% | 465,124 | 1.9% |
[ 56.0% - 56.5% ] 56.31% | 560,676 | 2.1% |
[ 56.5% - 57.0% ] 56.67% | 511,331 | 1.5% |
[ 57.0% - 57.5% ] 57.10% | 687,127 | 1.7% |
[ 57.5% - 58.0% ] 57.77% | 314,922 | 3.4% |
[ 58.0% - 58.5% ] 58.25% | 349,667 | 2.5% |
[ 58.5% - 59.0% ] 58.76% | 283,451 | 2.6% |
[ 59.0% - 59.5% ] 59.21% | 331,296 | 2.0% |
[ 59.5% - 60.0% ] 59.79% | 359,746 | 2.4% |
[ 60.0% - 60.5% ] 60.22% | 266,038 | 2.0% |
[ 60.5% - 61.0% ] 60.74% | 446,691 | 3.0% |
[ 61.0% - 61.5% ] 61.26% | 877,449 | 1.6% |
[ 61.5% - 62.0% ] 61.73% | 416,120 | 2.2% |
[ 62.0% - 62.5% ] 62.27% | 427,582 | 1.5% |
[ 62.5% - 63.0% ] 62.78% | 515,304 | 1.3% |
[ 63.0% - 63.5% ] 63.24% | 293,796 | 2.2% |
[ 63.5% - 64.0% ] 63.74% | 405,644 | 1.7% |
[ 64.0% - 64.5% ] 64.30% | 1,050,696 | 1.8% |
[ 64.5% - 65.0% ] 64.71% | 323,630 | 1.8% |
[ 65.0% - 65.5% ] 65.21% | 541,375 | 2.4% |
[ 65.5% - 66.0% ] 65.77% | 279,075 | 2.4% |
[ 66.0% - 66.5% ] 66.29% | 258,865 | 1.9% |
[ 66.5% - 67.0% ] 66.83% | 339,478 | 1.3% |
[ 67.0% - 67.5% ] 67.20% | 241,054 | 1.9% |
[ 67.5% - 68.0% ] 67.68% | 189,839 | 1.4% |
[ 68.0% - 68.5% ] 68.16% | 155,438 | 1.8% |
[ 68.5% - 69.0% ] 68.63% | 493,543 | 1.8% |
[ 69.0% - 69.5% ] 69.27% | 197,694 | 2.5% |
[ 69.5% - 70.0% ] 69.77% | 129,392 | 2.6% |
[ 70.0% - 70.5% ] 70.26% | 275,713 | 1.5% |
[ 70.5% - 71.0% ] 70.70% | 387,929 | 2.5% |
[ 71.0% - 71.5% ] 71.27% | 303,274 | 2.4% |
[ 71.5% - 72.0% ] 71.71% | 220,160 | 2.1% |
[ 72.0% - 72.5% ] 72.20% | 234,286 | 2.0% |
[ 72.5% - 73.0% ] 72.65% | 179,930 | 1.7% |
[ 73.0% - 73.5% ] 73.16% | 262,807 | 2.1% |
[ 73.5% - 74.0% ] 73.79% | 352,081 | 2.3% |
[ 74.0% - 74.5% ] 74.26% | 241,092 | 1.9% |
[ 74.5% - 75.0% ] 74.67% | 270,081 | 2.1% |
[ 75.0% - 75.5% ] 75.24% | 178,842 | 1.1% |
[ 75.5% - 76.0% ] 75.77% | 253,747 | 1.4% |
[ 76.0% - 76.5% ] 76.30% | 238,499 | 1.6% |
[ 76.5% - 77.0% ] 76.66% | 115,100 | 2.1% |
[ 77.0% - 77.5% ] 77.38% | 228,024 | 1.5% |
[ 77.5% - 78.0% ] 77.78% | 840,537 | 2.1% |
[ 78.0% - 78.5% ] 78.22% | 225,204 | 2.5% |
[ 78.5% - 79.0% ] 78.84% | 259,428 | 2.3% |
[ 79.0% - 79.5% ] 79.27% | 272,147 | 2.1% |
[ 79.5% - 80.0% ] 79.70% | 128,482 | 2.0% |
[ 80.0% - 80.5% ] 80.21% | 281,391 | 1.4% |
[ 80.5% - 81.0% ] 80.65% | 231,720 | 2.1% |
[ 81.0% - 81.5% ] 81.29% | 239,502 | 1.6% |
[ 81.5% - 82.0% ] 81.69% | 296,190 | 2.1% |
[ 82.0% - 82.5% ] 82.19% | 444,388 | 2.1% |
[ 82.5% - 83.0% ] 82.74% | 159,703 | 1.6% |
[ 83.0% - 83.5% ] 83.34% | 81,421 | 1.8% |
[ 83.5% - 84.0% ] 83.88% | 63,169 | 2.4% |
[ 84.0% - 84.5% ] 84.33% | 187,697 | 2.2% |
[ 84.5% - 85.0% ] 84.73% | 163,972 | 1.2% |
[ 85.0% - 85.5% ] 85.26% | 143,274 | 1.5% |
[ 85.5% - 86.0% ] 85.78% | 139,691 | 1.7% |
[ 86.0% - 86.5% ] 86.33% | 143,185 | 1.3% |
[ 86.5% - 87.0% ] 86.65% | 271,184 | 1.4% |
[ 87.0% - 87.5% ] 87.27% | 170,952 | 1.4% |
[ 87.5% - 88.0% ] 87.74% | 204,313 | 1.3% |
[ 88.0% - 88.5% ] 88.28% | 148,070 | 1.3% |
[ 88.5% - 89.0% ] 88.77% | 204,944 | 1.5% |
[ 89.0% - 89.5% ] 89.16% | 153,034 | 1.7% |
[ 89.5% - 90.0% ] 89.70% | 223,955 | 1.6% |
[ 90.0% - 90.5% ] 90.19% | 78,376 | 2.2% |
[ 90.5% - 91.0% ] 90.87% | 102,835 | 2.2% |
[ 91.0% - 91.5% ] 91.23% | 368,106 | 1.3% |
[ 91.5% - 92.0% ] 91.80% | 138,925 | 1.4% |
[ 92.0% - 92.5% ] 92.26% | 96,659 | 1.8% |
[ 92.5% - 93.0% ] 92.70% | 162,220 | 1.7% |
[ 93.0% - 93.5% ] 93.22% | 187,514 | 1.6% |
[ 93.5% - 94.0% ] 93.70% | 266,128 | 1.8% |
[ 94.0% - 94.5% ] 94.37% | 116,478 | 2.1% |
[ 94.5% - 95.0% ] 94.72% | 106,000 | 1.9% |
[ 95.0% - 95.5% ] 95.23% | 83,890 | 2.0% |
[ 95.5% - 96.0% ] 95.80% | 75,433 | 1.8% |
[ 96.0% - 96.5% ] 96.27% | 45,150 | 2.6% |
[ 96.5% - 97.0% ] 96.81% | 11,639 | 1.4% |
[ 97.0% - 97.5% ] 97.20% | 4,207 | 1.5% |
[ 98.0% - 98.5% ] 98.28% | 5,401 | 4.1% |
[ 98.5% - 99.0% ] 98.57% | 10,518 | 1.6% |
[ 99.0% - 99.5% ] 99.22% | 15,089 | 3.2% |
[ 99.5% - 100.0% ] 99.93% | 9,045 | 3.8% |