Black/African American Median Family Income
COMPARE
Black/African American
Select to Compare
Median Family Income
Black/African American Median Family Income
$81,912
FAMILY INCOME
0.0/ 100
METRIC RATING
328th/ 347
METRIC RANK
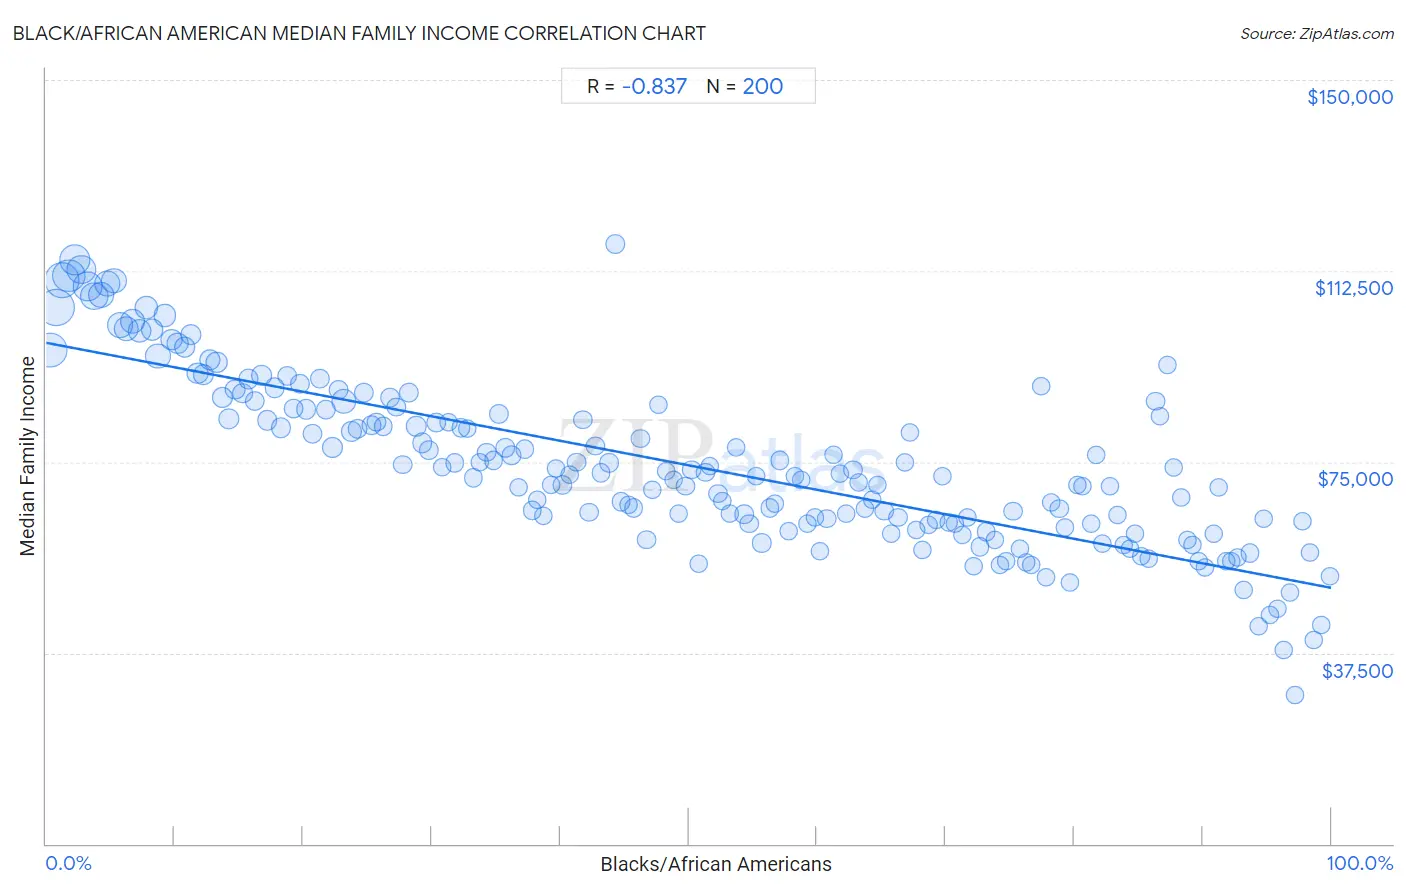
Black/African American Median Family Income Correlation Chart
The statistical analysis conducted on geographies consisting of 564,544,060 people shows a very strong negative correlation between the proportion of Blacks/African Americans and median family income in the United States with a correlation coefficient (R) of -0.837 and weighted average of $81,912. On average, for every 1% (one percent) increase in Blacks/African Americans within a typical geography, there is a decrease of $481 in median family income.
It is essential to understand that the correlation between the percentage of Blacks/African Americans and median family income does not imply a direct cause-and-effect relationship. It remains uncertain whether the presence of Blacks/African Americans influences an upward or downward trend in the level of median family income within an area, or if Blacks/African Americans simply ended up residing in those areas with higher or lower levels of median family income due to other factors.
Demographics Similar to Blacks/African Americans by Median Family Income
In terms of median family income, the demographic groups most similar to Blacks/African Americans are Dutch West Indian ($81,852, a difference of 0.070%), Arapaho ($82,064, a difference of 0.18%), Immigrants from Congo ($82,216, a difference of 0.37%), Sioux ($82,386, a difference of 0.58%), and Cheyenne ($81,385, a difference of 0.65%).
| Demographics | Rating | Rank | Median Family Income |
| Immigrants from Caribbean | 0.0 /100 | #321 | Tragic $83,319 |
| Dominicans | 0.0 /100 | #322 | Tragic $82,888 |
| Bahamians | 0.0 /100 | #323 | Tragic $82,631 |
| Creek | 0.0 /100 | #324 | Tragic $82,560 |
| Sioux | 0.0 /100 | #325 | Tragic $82,386 |
| Immigrants from Congo | 0.0 /100 | #326 | Tragic $82,216 |
| Arapaho | 0.0 /100 | #327 | Tragic $82,064 |
| Blacks/African Americans | 0.0 /100 | #328 | Tragic $81,912 |
| Dutch West Indians | 0.0 /100 | #329 | Tragic $81,852 |
| Cheyenne | 0.0 /100 | #330 | Tragic $81,385 |
| Immigrants from Dominican Republic | 0.0 /100 | #331 | Tragic $81,233 |
| Natives/Alaskans | 0.0 /100 | #332 | Tragic $80,908 |
| Kiowa | 0.0 /100 | #333 | Tragic $80,885 |
| Menominee | 0.0 /100 | #334 | Tragic $79,563 |
| Yup'ik | 0.0 /100 | #335 | Tragic $79,290 |
Black/African American Median Family Income Correlation Summary
| Measurement | Black/African American Data | Median Family Income Data |
| Minimum | 0.26% | $29,315 |
| Maximum | 99.9% | $117,822 |
| Range | 99.7% | $88,507 |
| Mean | 50.0% | $74,336 |
| Median | 50.0% | $72,335 |
| Interquartile 25% (IQ1) | 25.0% | $62,832 |
| Interquartile 75% (IQ3) | 75.0% | $85,289 |
| Interquartile Range (IQR) | 49.9% | $22,457 |
| Standard Deviation (Sample) | 28.9% | $16,637 |
| Standard Deviation (Population) | 28.9% | $16,596 |
Correlation Details
| Black/African American Percentile | Sample Size | Median Family Income |
[ 0.0% - 0.5% ] 0.26% | 30,277,705 | $96,967 |
[ 0.5% - 1.0% ] 0.74% | 35,387,462 | $105,341 |
[ 1.0% - 1.5% ] 1.23% | 32,390,264 | $110,610 |
[ 1.5% - 2.0% ] 1.74% | 27,989,507 | $111,556 |
[ 2.0% - 2.5% ] 2.24% | 24,395,183 | $114,675 |
[ 2.5% - 3.0% ] 2.75% | 20,750,586 | $112,763 |
[ 3.0% - 3.5% ] 3.25% | 20,733,994 | $109,399 |
[ 3.5% - 4.0% ] 3.74% | 16,805,429 | $107,521 |
[ 4.0% - 4.5% ] 4.25% | 14,626,083 | $107,895 |
[ 4.5% - 5.0% ] 4.74% | 14,886,378 | $110,067 |
[ 5.0% - 5.5% ] 5.24% | 13,586,452 | $110,537 |
[ 5.5% - 6.0% ] 5.76% | 13,800,333 | $101,942 |
[ 6.0% - 6.5% ] 6.23% | 11,801,690 | $101,133 |
[ 6.5% - 7.0% ] 6.72% | 11,723,020 | $102,643 |
[ 7.0% - 7.5% ] 7.26% | 10,991,418 | $100,749 |
[ 7.5% - 8.0% ] 7.75% | 9,097,789 | $105,297 |
[ 8.0% - 8.5% ] 8.24% | 8,297,214 | $100,964 |
[ 8.5% - 9.0% ] 8.69% | 12,395,334 | $95,824 |
[ 9.0% - 9.5% ] 9.24% | 7,602,660 | $103,730 |
[ 9.5% - 10.0% ] 9.75% | 5,927,174 | $98,973 |
[ 10.0% - 10.5% ] 10.26% | 6,419,548 | $98,313 |
[ 10.5% - 11.0% ] 10.76% | 6,039,244 | $97,526 |
[ 11.0% - 11.5% ] 11.27% | 6,000,593 | $99,943 |
[ 11.5% - 12.0% ] 11.75% | 6,648,088 | $92,423 |
[ 12.0% - 12.5% ] 12.24% | 5,831,387 | $92,135 |
[ 12.5% - 13.0% ] 12.73% | 5,226,448 | $95,040 |
[ 13.0% - 13.5% ] 13.26% | 5,605,441 | $94,603 |
[ 13.5% - 14.0% ] 13.72% | 4,987,629 | $87,583 |
[ 14.0% - 14.5% ] 14.23% | 4,357,796 | $83,522 |
[ 14.5% - 15.0% ] 14.73% | 4,183,453 | $89,217 |
[ 15.0% - 15.5% ] 15.25% | 4,395,316 | $88,474 |
[ 15.5% - 16.0% ] 15.75% | 3,598,318 | $91,276 |
[ 16.0% - 16.5% ] 16.25% | 3,264,741 | $87,012 |
[ 16.5% - 17.0% ] 16.75% | 3,394,709 | $91,996 |
[ 17.0% - 17.5% ] 17.22% | 3,510,308 | $83,173 |
[ 17.5% - 18.0% ] 17.77% | 3,688,454 | $89,494 |
[ 18.0% - 18.5% ] 18.26% | 3,591,214 | $81,689 |
[ 18.5% - 19.0% ] 18.73% | 3,668,428 | $91,918 |
[ 19.0% - 19.5% ] 19.23% | 3,042,927 | $85,475 |
[ 19.5% - 20.0% ] 19.75% | 2,541,778 | $90,311 |
[ 20.0% - 20.5% ] 20.23% | 2,762,493 | $85,316 |
[ 20.5% - 21.0% ] 20.77% | 2,359,751 | $80,496 |
[ 21.0% - 21.5% ] 21.29% | 2,725,817 | $91,265 |
[ 21.5% - 22.0% ] 21.77% | 3,748,712 | $85,262 |
[ 22.0% - 22.5% ] 22.31% | 4,857,119 | $77,931 |
[ 22.5% - 23.0% ] 22.72% | 3,024,687 | $89,145 |
[ 23.0% - 23.5% ] 23.15% | 11,606,933 | $86,901 |
[ 23.5% - 24.0% ] 23.75% | 3,972,601 | $80,958 |
[ 24.0% - 24.5% ] 24.22% | 2,185,684 | $81,437 |
[ 24.5% - 25.0% ] 24.74% | 1,983,583 | $88,603 |
[ 25.0% - 25.5% ] 25.28% | 1,585,570 | $82,271 |
[ 25.5% - 26.0% ] 25.71% | 1,465,197 | $82,779 |
[ 26.0% - 26.5% ] 26.22% | 1,904,747 | $81,982 |
[ 26.5% - 27.0% ] 26.77% | 2,137,584 | $87,598 |
[ 27.0% - 27.5% ] 27.23% | 1,787,911 | $85,771 |
[ 27.5% - 28.0% ] 27.75% | 1,490,824 | $74,505 |
[ 28.0% - 28.5% ] 28.22% | 1,987,093 | $88,528 |
[ 28.5% - 29.0% ] 28.80% | 4,741,757 | $82,008 |
[ 29.0% - 29.5% ] 29.24% | 3,234,062 | $78,700 |
[ 29.5% - 30.0% ] 29.77% | 1,875,308 | $77,305 |
[ 30.0% - 30.5% ] 30.35% | 2,243,676 | $82,667 |
[ 30.5% - 31.0% ] 30.81% | 1,191,845 | $73,898 |
[ 31.0% - 31.5% ] 31.29% | 963,377 | $82,770 |
[ 31.5% - 32.0% ] 31.79% | 1,018,182 | $74,774 |
[ 32.0% - 32.5% ] 32.27% | 1,275,434 | $81,649 |
[ 32.5% - 33.0% ] 32.74% | 737,949 | $81,508 |
[ 33.0% - 33.5% ] 33.25% | 1,251,005 | $71,869 |
[ 33.5% - 34.0% ] 33.75% | 913,443 | $74,857 |
[ 34.0% - 34.5% ] 34.28% | 830,534 | $76,821 |
[ 34.5% - 35.0% ] 34.79% | 921,904 | $75,282 |
[ 35.0% - 35.5% ] 35.24% | 1,761,317 | $84,394 |
[ 35.5% - 36.0% ] 35.74% | 1,281,357 | $77,796 |
[ 36.0% - 36.5% ] 36.23% | 1,182,846 | $76,332 |
[ 36.5% - 37.0% ] 36.75% | 565,124 | $70,015 |
[ 37.0% - 37.5% ] 37.25% | 922,893 | $77,546 |
[ 37.5% - 38.0% ] 37.80% | 834,209 | $65,506 |
[ 38.0% - 38.5% ] 38.19% | 955,884 | $67,600 |
[ 38.5% - 39.0% ] 38.70% | 1,451,863 | $64,387 |
[ 39.0% - 39.5% ] 39.31% | 532,236 | $70,405 |
[ 39.5% - 40.0% ] 39.68% | 910,242 | $73,698 |
[ 40.0% - 40.5% ] 40.16% | 2,716,149 | $70,547 |
[ 40.5% - 41.0% ] 40.73% | 1,183,791 | $72,464 |
[ 41.0% - 41.5% ] 41.26% | 1,033,863 | $74,915 |
[ 41.5% - 42.0% ] 41.76% | 964,669 | $83,302 |
[ 42.0% - 42.5% ] 42.25% | 885,170 | $65,046 |
[ 42.5% - 43.0% ] 42.73% | 1,021,473 | $78,091 |
[ 43.0% - 43.5% ] 43.19% | 1,008,771 | $72,803 |
[ 43.5% - 44.0% ] 43.82% | 1,001,344 | $74,844 |
[ 44.0% - 44.5% ] 44.29% | 1,187,128 | $117,822 |
[ 44.5% - 45.0% ] 44.74% | 670,412 | $67,184 |
[ 45.0% - 45.5% ] 45.34% | 691,372 | $66,638 |
[ 45.5% - 46.0% ] 45.74% | 599,576 | $65,952 |
[ 46.0% - 46.5% ] 46.24% | 746,632 | $79,640 |
[ 46.5% - 47.0% ] 46.72% | 1,073,124 | $59,736 |
[ 47.0% - 47.5% ] 47.16% | 747,033 | $69,476 |
[ 47.5% - 48.0% ] 47.65% | 1,071,269 | $86,257 |
[ 48.0% - 48.5% ] 48.26% | 305,334 | $73,189 |
[ 48.5% - 49.0% ] 48.84% | 490,965 | $71,474 |
[ 49.0% - 49.5% ] 49.23% | 485,173 | $64,742 |
[ 49.5% - 50.0% ] 49.74% | 547,922 | $70,155 |
[ 50.0% - 50.5% ] 50.24% | 941,240 | $73,400 |
[ 50.5% - 51.0% ] 50.77% | 199,221 | $55,082 |
[ 51.0% - 51.5% ] 51.29% | 575,411 | $72,851 |
[ 51.5% - 52.0% ] 51.63% | 660,970 | $74,187 |
[ 52.0% - 52.5% ] 52.28% | 537,543 | $68,698 |
[ 52.5% - 53.0% ] 52.63% | 673,011 | $67,308 |
[ 53.0% - 53.5% ] 53.22% | 698,534 | $64,759 |
[ 53.5% - 54.0% ] 53.72% | 385,839 | $77,895 |
[ 54.0% - 54.5% ] 54.32% | 688,779 | $64,753 |
[ 54.5% - 55.0% ] 54.71% | 356,053 | $62,868 |
[ 55.0% - 55.5% ] 55.28% | 447,233 | $72,205 |
[ 55.5% - 56.0% ] 55.68% | 467,872 | $59,072 |
[ 56.0% - 56.5% ] 56.31% | 558,314 | $65,956 |
[ 56.5% - 57.0% ] 56.67% | 510,986 | $66,711 |
[ 57.0% - 57.5% ] 57.10% | 687,498 | $75,259 |
[ 57.5% - 58.0% ] 57.77% | 316,251 | $61,323 |
[ 58.0% - 58.5% ] 58.25% | 367,444 | $72,137 |
[ 58.5% - 59.0% ] 58.76% | 287,702 | $71,560 |
[ 59.0% - 59.5% ] 59.21% | 337,679 | $62,879 |
[ 59.5% - 60.0% ] 59.79% | 365,863 | $63,994 |
[ 60.0% - 60.5% ] 60.22% | 270,049 | $57,559 |
[ 60.5% - 61.0% ] 60.74% | 453,600 | $63,921 |
[ 61.0% - 61.5% ] 61.26% | 880,740 | $76,449 |
[ 61.5% - 62.0% ] 61.73% | 425,505 | $72,643 |
[ 62.0% - 62.5% ] 62.27% | 436,688 | $64,929 |
[ 62.5% - 63.0% ] 62.78% | 516,291 | $73,424 |
[ 63.0% - 63.5% ] 63.24% | 297,681 | $70,861 |
[ 63.5% - 64.0% ] 63.75% | 417,401 | $65,785 |
[ 64.0% - 64.5% ] 64.30% | 1,054,192 | $67,532 |
[ 64.5% - 65.0% ] 64.71% | 329,795 | $70,545 |
[ 65.0% - 65.5% ] 65.21% | 551,575 | $65,327 |
[ 65.5% - 66.0% ] 65.77% | 279,426 | $60,807 |
[ 66.0% - 66.5% ] 66.29% | 269,876 | $64,094 |
[ 66.5% - 67.0% ] 66.83% | 340,006 | $74,969 |
[ 67.0% - 67.5% ] 67.20% | 242,769 | $80,824 |
[ 67.5% - 68.0% ] 67.68% | 191,778 | $61,645 |
[ 68.0% - 68.5% ] 68.16% | 157,947 | $57,623 |
[ 68.5% - 69.0% ] 68.63% | 498,755 | $62,623 |
[ 69.0% - 69.5% ] 69.27% | 207,399 | $63,547 |
[ 69.5% - 70.0% ] 69.77% | 133,688 | $72,201 |
[ 70.0% - 70.5% ] 70.26% | 276,848 | $63,128 |
[ 70.5% - 71.0% ] 70.70% | 387,010 | $62,796 |
[ 71.0% - 71.5% ] 71.27% | 304,156 | $60,686 |
[ 71.5% - 72.0% ] 71.71% | 224,973 | $63,986 |
[ 72.0% - 72.5% ] 72.20% | 237,240 | $54,506 |
[ 72.5% - 73.0% ] 72.65% | 182,936 | $58,307 |
[ 73.0% - 73.5% ] 73.16% | 262,968 | $61,262 |
[ 73.5% - 74.0% ] 73.78% | 357,875 | $59,661 |
[ 74.0% - 74.5% ] 74.25% | 250,538 | $54,779 |
[ 74.5% - 75.0% ] 74.67% | 277,493 | $55,403 |
[ 75.0% - 75.5% ] 75.24% | 180,741 | $65,416 |
[ 75.5% - 76.0% ] 75.77% | 255,066 | $58,041 |
[ 76.0% - 76.5% ] 76.30% | 238,258 | $55,349 |
[ 76.5% - 77.0% ] 76.66% | 115,520 | $54,803 |
[ 77.0% - 77.5% ] 77.39% | 231,875 | $89,778 |
[ 77.5% - 78.0% ] 77.78% | 840,537 | $52,295 |
[ 78.0% - 78.5% ] 78.22% | 230,977 | $66,974 |
[ 78.5% - 79.0% ] 78.83% | 262,467 | $65,901 |
[ 79.0% - 79.5% ] 79.27% | 272,121 | $62,067 |
[ 79.5% - 80.0% ] 79.70% | 131,846 | $51,272 |
[ 80.0% - 80.5% ] 80.21% | 286,702 | $70,561 |
[ 80.5% - 81.0% ] 80.65% | 231,356 | $70,257 |
[ 81.0% - 81.5% ] 81.29% | 241,079 | $62,789 |
[ 81.5% - 82.0% ] 81.68% | 298,137 | $76,443 |
[ 82.0% - 82.5% ] 82.19% | 444,388 | $58,926 |
[ 82.5% - 83.0% ] 82.75% | 166,622 | $70,249 |
[ 83.0% - 83.5% ] 83.34% | 88,337 | $64,532 |
[ 83.5% - 84.0% ] 83.88% | 64,938 | $58,577 |
[ 84.0% - 84.5% ] 84.33% | 187,741 | $57,911 |
[ 84.5% - 85.0% ] 84.73% | 167,226 | $60,946 |
[ 85.0% - 85.5% ] 85.25% | 143,865 | $56,435 |
[ 85.5% - 86.0% ] 85.78% | 141,314 | $56,061 |
[ 86.0% - 86.5% ] 86.33% | 144,901 | $86,865 |
[ 86.5% - 87.0% ] 86.65% | 270,278 | $84,034 |
[ 87.0% - 87.5% ] 87.27% | 176,487 | $94,046 |
[ 87.5% - 88.0% ] 87.74% | 209,137 | $73,937 |
[ 88.0% - 88.5% ] 88.28% | 149,791 | $68,052 |
[ 88.5% - 89.0% ] 88.76% | 204,198 | $59,593 |
[ 89.0% - 89.5% ] 89.16% | 152,705 | $58,704 |
[ 89.5% - 90.0% ] 89.70% | 225,241 | $55,410 |
[ 90.0% - 90.5% ] 90.19% | 82,625 | $54,229 |
[ 90.5% - 91.0% ] 90.87% | 107,664 | $60,992 |
[ 91.0% - 91.5% ] 91.23% | 371,563 | $69,987 |
[ 91.5% - 92.0% ] 91.80% | 140,920 | $55,586 |
[ 92.0% - 92.5% ] 92.26% | 98,482 | $55,570 |
[ 92.5% - 93.0% ] 92.70% | 161,890 | $56,145 |
[ 93.0% - 93.5% ] 93.22% | 188,401 | $49,773 |
[ 93.5% - 94.0% ] 93.70% | 269,057 | $57,102 |
[ 94.0% - 94.5% ] 94.37% | 118,162 | $42,800 |
[ 94.5% - 95.0% ] 94.72% | 106,000 | $63,746 |
[ 95.0% - 95.5% ] 95.23% | 87,287 | $45,017 |
[ 95.5% - 96.0% ] 95.80% | 79,337 | $46,114 |
[ 96.0% - 96.5% ] 96.26% | 45,904 | $38,005 |
[ 96.5% - 97.0% ] 96.82% | 15,546 | $49,302 |
[ 97.0% - 97.5% ] 97.22% | 4,130 | $29,315 |
[ 97.5% - 98.0% ] 97.79% | 3,029 | $63,274 |
[ 98.0% - 98.5% ] 98.32% | 9,928 | $57,241 |
[ 98.5% - 99.0% ] 98.63% | 16,256 | $40,044 |
[ 99.0% - 99.5% ] 99.22% | 14,148 | $42,863 |
[ 99.5% - 100.0% ] 99.95% | 13,821 | $52,634 |