Black/African American Vision Disability
COMPARE
Black/African American
Select to Compare
Vision Disability
Black/African American Vision Disability
2.8%
VISION DISABILITY
0.0/ 100
METRIC RATING
320th/ 347
METRIC RANK
Black/African American Vision Disability Correlation Chart
The statistical analysis conducted on geographies consisting of 564,452,359 people shows a strong positive correlation between the proportion of Blacks/African Americans and percentage of population with vision disability in the United States with a correlation coefficient (R) of 0.741 and weighted average of 2.8%. On average, for every 1% (one percent) increase in Blacks/African Americans within a typical geography, there is an increase of 0.018% in percentage of population with vision disability.
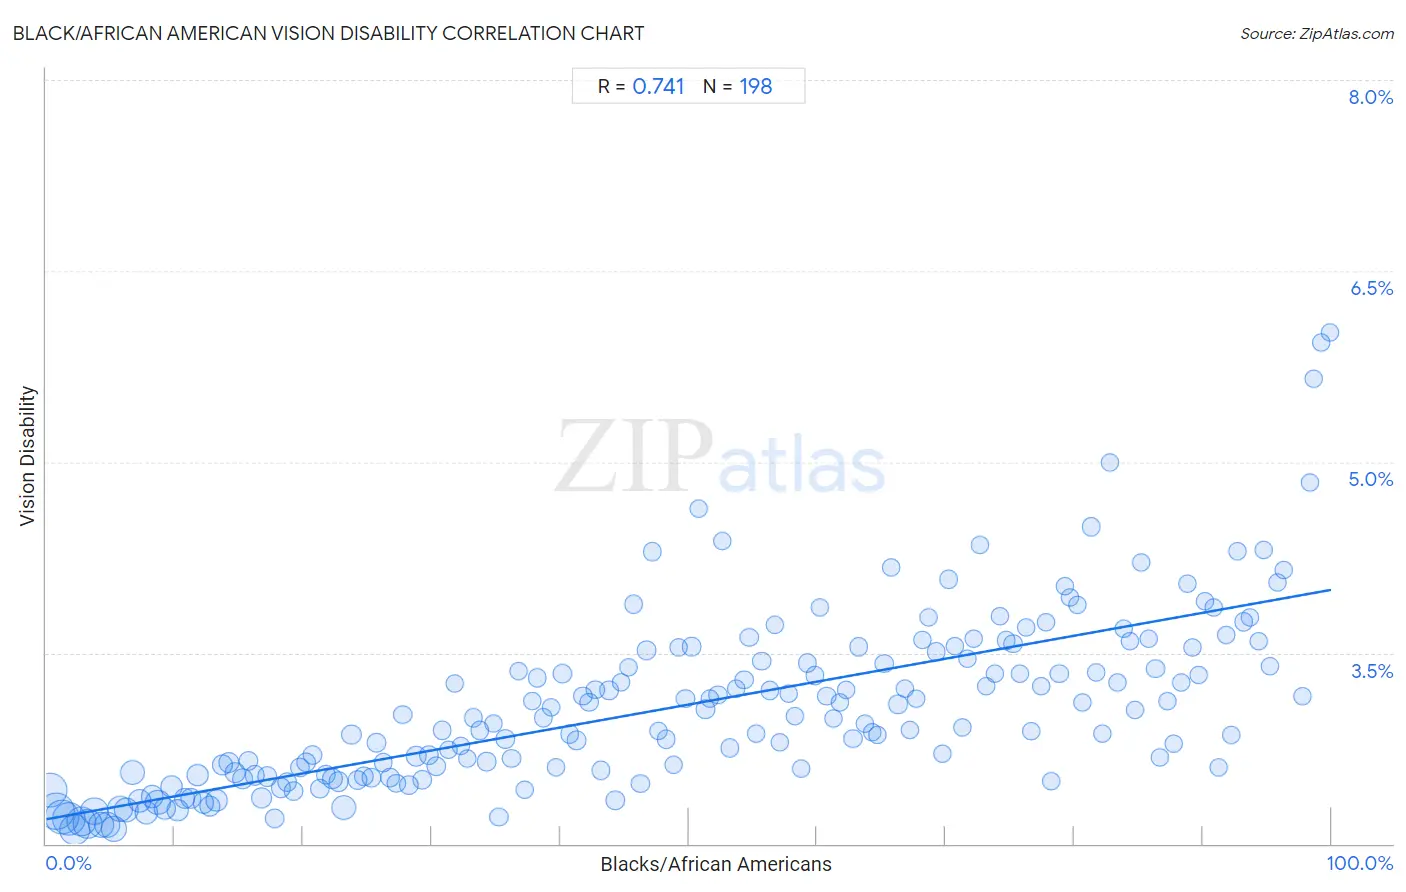
It is essential to understand that the correlation between the percentage of Blacks/African Americans and percentage of population with vision disability does not imply a direct cause-and-effect relationship. It remains uncertain whether the presence of Blacks/African Americans influences an upward or downward trend in the level of percentage of population with vision disability within an area, or if Blacks/African Americans simply ended up residing in those areas with higher or lower levels of percentage of population with vision disability due to other factors.
Demographics Similar to Blacks/African Americans by Vision Disability
In terms of vision disability, the demographic groups most similar to Blacks/African Americans are Tohono O'odham (2.8%, a difference of 0.69%), Comanche (2.8%, a difference of 2.0%), Alaska Native (2.7%, a difference of 2.1%), Paiute (2.9%, a difference of 2.5%), and Tlingit-Haida (2.9%, a difference of 2.5%).
| Demographics | Rating | Rank | Vision Disability |
| Potawatomi | 0.0 /100 | #313 | Tragic 2.6% |
| Inupiat | 0.0 /100 | #314 | Tragic 2.7% |
| Osage | 0.0 /100 | #315 | Tragic 2.7% |
| Shoshone | 0.0 /100 | #316 | Tragic 2.7% |
| Yup'ik | 0.0 /100 | #317 | Tragic 2.7% |
| Alaska Natives | 0.0 /100 | #318 | Tragic 2.7% |
| Tohono O'odham | 0.0 /100 | #319 | Tragic 2.8% |
| Blacks/African Americans | 0.0 /100 | #320 | Tragic 2.8% |
| Comanche | 0.0 /100 | #321 | Tragic 2.8% |
| Paiute | 0.0 /100 | #322 | Tragic 2.9% |
| Tlingit-Haida | 0.0 /100 | #323 | Tragic 2.9% |
| Hopi | 0.0 /100 | #324 | Tragic 2.9% |
| Cherokee | 0.0 /100 | #325 | Tragic 2.9% |
| Spanish Americans | 0.0 /100 | #326 | Tragic 2.9% |
| Natives/Alaskans | 0.0 /100 | #327 | Tragic 3.0% |
Black/African American Vision Disability Correlation Summary
| Measurement | Black/African American Data | Vision Disability Data |
| Minimum | 0.26% | 2.1% |
| Maximum | 100.0% | 6.0% |
| Range | 99.7% | 3.9% |
| Mean | 49.5% | 3.1% |
| Median | 49.5% | 3.0% |
| Interquartile 25% (IQ1) | 24.7% | 2.5% |
| Interquartile 75% (IQ3) | 74.3% | 3.5% |
| Interquartile Range (IQR) | 49.5% | 0.91% |
| Standard Deviation (Sample) | 28.7% | 0.70% |
| Standard Deviation (Population) | 28.6% | 0.70% |
Correlation Details
| Black/African American Percentile | Sample Size | Vision Disability |
[ 0.0% - 0.5% ] 0.26% | 30,185,976 | 2.4% |
[ 0.5% - 1.0% ] 0.74% | 35,315,052 | 2.3% |
[ 1.0% - 1.5% ] 1.23% | 32,356,743 | 2.2% |
[ 1.5% - 2.0% ] 1.74% | 27,921,525 | 2.2% |
[ 2.0% - 2.5% ] 2.24% | 24,361,317 | 2.1% |
[ 2.5% - 3.0% ] 2.75% | 20,738,811 | 2.2% |
[ 3.0% - 3.5% ] 3.25% | 20,721,137 | 2.2% |
[ 3.5% - 4.0% ] 3.74% | 16,807,101 | 2.3% |
[ 4.0% - 4.5% ] 4.25% | 14,622,316 | 2.2% |
[ 4.5% - 5.0% ] 4.74% | 14,908,592 | 2.1% |
[ 5.0% - 5.5% ] 5.24% | 13,601,236 | 2.1% |
[ 5.5% - 6.0% ] 5.76% | 13,808,485 | 2.3% |
[ 6.0% - 6.5% ] 6.23% | 11,772,529 | 2.3% |
[ 6.5% - 7.0% ] 6.72% | 11,738,556 | 2.6% |
[ 7.0% - 7.5% ] 7.26% | 10,989,257 | 2.3% |
[ 7.5% - 8.0% ] 7.75% | 9,100,590 | 2.2% |
[ 8.0% - 8.5% ] 8.24% | 8,272,199 | 2.4% |
[ 8.5% - 9.0% ] 8.69% | 12,407,317 | 2.3% |
[ 9.0% - 9.5% ] 9.24% | 7,609,070 | 2.3% |
[ 9.5% - 10.0% ] 9.75% | 5,933,773 | 2.5% |
[ 10.0% - 10.5% ] 10.26% | 6,432,479 | 2.3% |
[ 10.5% - 11.0% ] 10.76% | 6,051,529 | 2.4% |
[ 11.0% - 11.5% ] 11.27% | 5,990,836 | 2.4% |
[ 11.5% - 12.0% ] 11.75% | 6,648,390 | 2.5% |
[ 12.0% - 12.5% ] 12.24% | 5,833,630 | 2.3% |
[ 12.5% - 13.0% ] 12.73% | 5,224,869 | 2.3% |
[ 13.0% - 13.5% ] 13.26% | 5,601,837 | 2.3% |
[ 13.5% - 14.0% ] 13.72% | 4,993,598 | 2.6% |
[ 14.0% - 14.5% ] 14.23% | 4,377,127 | 2.6% |
[ 14.5% - 15.0% ] 14.73% | 4,188,364 | 2.6% |
[ 15.0% - 15.5% ] 15.25% | 4,399,803 | 2.5% |
[ 15.5% - 16.0% ] 15.75% | 3,594,299 | 2.7% |
[ 16.0% - 16.5% ] 16.25% | 3,271,745 | 2.5% |
[ 16.5% - 17.0% ] 16.75% | 3,405,497 | 2.4% |
[ 17.0% - 17.5% ] 17.22% | 3,497,923 | 2.5% |
[ 17.5% - 18.0% ] 17.77% | 3,688,158 | 2.2% |
[ 18.0% - 18.5% ] 18.26% | 3,600,068 | 2.4% |
[ 18.5% - 19.0% ] 18.73% | 3,674,138 | 2.5% |
[ 19.0% - 19.5% ] 19.23% | 3,045,059 | 2.4% |
[ 19.5% - 20.0% ] 19.75% | 2,545,795 | 2.6% |
[ 20.0% - 20.5% ] 20.23% | 2,766,333 | 2.6% |
[ 20.5% - 21.0% ] 20.77% | 2,357,222 | 2.7% |
[ 21.0% - 21.5% ] 21.29% | 2,732,767 | 2.4% |
[ 21.5% - 22.0% ] 21.77% | 3,750,871 | 2.5% |
[ 22.0% - 22.5% ] 22.31% | 4,861,476 | 2.5% |
[ 22.5% - 23.0% ] 22.72% | 3,024,550 | 2.5% |
[ 23.0% - 23.5% ] 23.15% | 11,621,379 | 2.3% |
[ 23.5% - 24.0% ] 23.75% | 3,964,246 | 2.9% |
[ 24.0% - 24.5% ] 24.22% | 2,192,930 | 2.5% |
[ 24.5% - 25.0% ] 24.74% | 1,980,715 | 2.5% |
[ 25.0% - 25.5% ] 25.28% | 1,595,066 | 2.5% |
[ 25.5% - 26.0% ] 25.71% | 1,469,102 | 2.8% |
[ 26.0% - 26.5% ] 26.22% | 1,911,014 | 2.6% |
[ 26.5% - 27.0% ] 26.77% | 2,136,892 | 2.5% |
[ 27.0% - 27.5% ] 27.23% | 1,792,006 | 2.5% |
[ 27.5% - 28.0% ] 27.75% | 1,494,093 | 3.0% |
[ 28.0% - 28.5% ] 28.22% | 1,987,224 | 2.5% |
[ 28.5% - 29.0% ] 28.80% | 4,741,984 | 2.7% |
[ 29.0% - 29.5% ] 29.24% | 3,234,011 | 2.5% |
[ 29.5% - 30.0% ] 29.77% | 1,874,520 | 2.7% |
[ 30.0% - 30.5% ] 30.35% | 2,242,786 | 2.6% |
[ 30.5% - 31.0% ] 30.81% | 1,188,254 | 2.9% |
[ 31.0% - 31.5% ] 31.29% | 964,192 | 2.7% |
[ 31.5% - 32.0% ] 31.79% | 1,021,159 | 3.3% |
[ 32.0% - 32.5% ] 32.27% | 1,279,467 | 2.8% |
[ 32.5% - 33.0% ] 32.74% | 738,495 | 2.7% |
[ 33.0% - 33.5% ] 33.25% | 1,252,037 | 3.0% |
[ 33.5% - 34.0% ] 33.75% | 916,142 | 2.9% |
[ 34.0% - 34.5% ] 34.28% | 833,594 | 2.6% |
[ 34.5% - 35.0% ] 34.79% | 921,082 | 2.9% |
[ 35.0% - 35.5% ] 35.24% | 1,764,457 | 2.2% |
[ 35.5% - 36.0% ] 35.74% | 1,280,225 | 2.8% |
[ 36.0% - 36.5% ] 36.23% | 1,183,045 | 2.7% |
[ 36.5% - 37.0% ] 36.75% | 565,447 | 3.4% |
[ 37.0% - 37.5% ] 37.25% | 921,073 | 2.4% |
[ 37.5% - 38.0% ] 37.80% | 835,548 | 3.1% |
[ 38.0% - 38.5% ] 38.19% | 957,278 | 3.3% |
[ 38.5% - 39.0% ] 38.70% | 1,444,376 | 3.0% |
[ 39.0% - 39.5% ] 39.31% | 535,541 | 3.1% |
[ 39.5% - 40.0% ] 39.68% | 913,719 | 2.6% |
[ 40.0% - 40.5% ] 40.16% | 2,715,101 | 3.3% |
[ 40.5% - 41.0% ] 40.73% | 1,183,791 | 2.9% |
[ 41.0% - 41.5% ] 41.26% | 1,037,109 | 2.8% |
[ 41.5% - 42.0% ] 41.76% | 964,290 | 3.2% |
[ 42.0% - 42.5% ] 42.25% | 880,817 | 3.1% |
[ 42.5% - 43.0% ] 42.73% | 1,023,698 | 3.2% |
[ 43.0% - 43.5% ] 43.19% | 1,014,394 | 2.6% |
[ 43.5% - 44.0% ] 43.82% | 1,002,107 | 3.2% |
[ 44.0% - 44.5% ] 44.29% | 1,186,588 | 2.3% |
[ 44.5% - 45.0% ] 44.74% | 680,759 | 3.3% |
[ 45.0% - 45.5% ] 45.34% | 696,067 | 3.4% |
[ 45.5% - 46.0% ] 45.74% | 601,066 | 3.9% |
[ 46.0% - 46.5% ] 46.24% | 747,745 | 2.5% |
[ 46.5% - 47.0% ] 46.72% | 1,076,022 | 3.5% |
[ 47.0% - 47.5% ] 47.16% | 750,721 | 4.3% |
[ 47.5% - 48.0% ] 47.65% | 1,077,378 | 2.9% |
[ 48.0% - 48.5% ] 48.26% | 303,479 | 2.8% |
[ 48.5% - 49.0% ] 48.84% | 490,676 | 2.6% |
[ 49.0% - 49.5% ] 49.23% | 487,029 | 3.5% |
[ 49.5% - 50.0% ] 49.74% | 549,435 | 3.1% |
[ 50.0% - 50.5% ] 50.24% | 942,933 | 3.6% |
[ 50.5% - 51.0% ] 50.77% | 201,138 | 4.6% |
[ 51.0% - 51.5% ] 51.29% | 577,266 | 3.1% |
[ 51.5% - 52.0% ] 51.63% | 661,001 | 3.1% |
[ 52.0% - 52.5% ] 52.28% | 535,770 | 3.2% |
[ 52.5% - 53.0% ] 52.63% | 675,996 | 4.4% |
[ 53.0% - 53.5% ] 53.22% | 698,128 | 2.8% |
[ 53.5% - 54.0% ] 53.72% | 387,074 | 3.2% |
[ 54.0% - 54.5% ] 54.32% | 688,376 | 3.3% |
[ 54.5% - 55.0% ] 54.71% | 357,827 | 3.6% |
[ 55.0% - 55.5% ] 55.28% | 444,483 | 2.9% |
[ 55.5% - 56.0% ] 55.68% | 468,645 | 3.4% |
[ 56.0% - 56.5% ] 56.31% | 564,868 | 3.2% |
[ 56.5% - 57.0% ] 56.67% | 515,566 | 3.7% |
[ 57.0% - 57.5% ] 57.10% | 687,908 | 2.8% |
[ 57.5% - 58.0% ] 57.77% | 316,695 | 3.2% |
[ 58.0% - 58.5% ] 58.25% | 368,374 | 3.0% |
[ 58.5% - 59.0% ] 58.76% | 288,599 | 2.6% |
[ 59.0% - 59.5% ] 59.21% | 337,748 | 3.4% |
[ 59.5% - 60.0% ] 59.79% | 361,972 | 3.3% |
[ 60.0% - 60.5% ] 60.22% | 272,024 | 3.9% |
[ 60.5% - 61.0% ] 60.74% | 455,585 | 3.2% |
[ 61.0% - 61.5% ] 61.26% | 882,226 | 3.0% |
[ 61.5% - 62.0% ] 61.73% | 425,819 | 3.1% |
[ 62.0% - 62.5% ] 62.27% | 437,585 | 3.2% |
[ 62.5% - 63.0% ] 62.78% | 515,796 | 2.8% |
[ 63.0% - 63.5% ] 63.24% | 299,141 | 3.5% |
[ 63.5% - 64.0% ] 63.75% | 418,331 | 2.9% |
[ 64.0% - 64.5% ] 64.30% | 1,056,518 | 2.9% |
[ 64.5% - 65.0% ] 64.71% | 329,795 | 2.9% |
[ 65.0% - 65.5% ] 65.21% | 551,921 | 3.4% |
[ 65.5% - 66.0% ] 65.77% | 282,402 | 4.2% |
[ 66.0% - 66.5% ] 66.28% | 271,020 | 3.1% |
[ 66.5% - 67.0% ] 66.83% | 339,478 | 3.2% |
[ 67.0% - 67.5% ] 67.20% | 241,525 | 2.9% |
[ 67.5% - 68.0% ] 67.68% | 191,831 | 3.1% |
[ 68.0% - 68.5% ] 68.16% | 157,210 | 3.6% |
[ 68.5% - 69.0% ] 68.63% | 498,538 | 3.8% |
[ 69.0% - 69.5% ] 69.27% | 204,204 | 3.5% |
[ 69.5% - 70.0% ] 69.77% | 133,545 | 2.7% |
[ 70.0% - 70.5% ] 70.26% | 275,954 | 4.1% |
[ 70.5% - 71.0% ] 70.70% | 389,367 | 3.6% |
[ 71.0% - 71.5% ] 71.27% | 304,156 | 2.9% |
[ 71.5% - 72.0% ] 71.71% | 225,396 | 3.5% |
[ 72.0% - 72.5% ] 72.20% | 236,508 | 3.6% |
[ 72.5% - 73.0% ] 72.65% | 183,039 | 4.3% |
[ 73.0% - 73.5% ] 73.16% | 263,235 | 3.2% |
[ 73.5% - 74.0% ] 73.78% | 357,875 | 3.3% |
[ 74.0% - 74.5% ] 74.25% | 250,267 | 3.8% |
[ 74.5% - 75.0% ] 74.67% | 279,553 | 3.6% |
[ 75.0% - 75.5% ] 75.24% | 180,741 | 3.6% |
[ 75.5% - 76.0% ] 75.77% | 255,750 | 3.3% |
[ 76.0% - 76.5% ] 76.30% | 238,218 | 3.7% |
[ 76.5% - 77.0% ] 76.66% | 116,280 | 2.9% |
[ 77.0% - 77.5% ] 77.38% | 232,771 | 3.2% |
[ 77.5% - 78.0% ] 77.78% | 840,919 | 3.7% |
[ 78.0% - 78.5% ] 78.22% | 231,028 | 2.5% |
[ 78.5% - 79.0% ] 78.83% | 262,425 | 3.3% |
[ 79.0% - 79.5% ] 79.27% | 273,348 | 4.0% |
[ 79.5% - 80.0% ] 79.71% | 132,815 | 3.9% |
[ 80.0% - 80.5% ] 80.21% | 288,612 | 3.9% |
[ 80.5% - 81.0% ] 80.65% | 232,753 | 3.1% |
[ 81.0% - 81.5% ] 81.30% | 240,409 | 4.5% |
[ 81.5% - 82.0% ] 81.69% | 299,701 | 3.3% |
[ 82.0% - 82.5% ] 82.19% | 444,388 | 2.9% |
[ 82.5% - 83.0% ] 82.75% | 167,206 | 5.0% |
[ 83.0% - 83.5% ] 83.34% | 88,337 | 3.3% |
[ 83.5% - 84.0% ] 83.87% | 65,425 | 3.7% |
[ 84.0% - 84.5% ] 84.33% | 187,263 | 3.6% |
[ 84.5% - 85.0% ] 84.73% | 164,768 | 3.0% |
[ 85.0% - 85.5% ] 85.25% | 143,797 | 4.2% |
[ 85.5% - 86.0% ] 85.78% | 143,744 | 3.6% |
[ 86.0% - 86.5% ] 86.33% | 144,912 | 3.4% |
[ 86.5% - 87.0% ] 86.65% | 269,617 | 2.7% |
[ 87.0% - 87.5% ] 87.27% | 175,255 | 3.1% |
[ 87.5% - 88.0% ] 87.74% | 209,670 | 2.8% |
[ 88.0% - 88.5% ] 88.28% | 149,232 | 3.3% |
[ 88.5% - 89.0% ] 88.77% | 207,147 | 4.0% |
[ 89.0% - 89.5% ] 89.16% | 153,997 | 3.5% |
[ 89.5% - 90.0% ] 89.70% | 226,451 | 3.3% |
[ 90.0% - 90.5% ] 90.19% | 88,816 | 3.9% |
[ 90.5% - 91.0% ] 90.87% | 107,172 | 3.9% |
[ 91.0% - 91.5% ] 91.23% | 372,109 | 2.6% |
[ 91.5% - 92.0% ] 91.80% | 140,487 | 3.6% |
[ 92.0% - 92.5% ] 92.26% | 98,700 | 2.9% |
[ 92.5% - 93.0% ] 92.70% | 160,405 | 4.3% |
[ 93.0% - 93.5% ] 93.22% | 188,401 | 3.7% |
[ 93.5% - 94.0% ] 93.70% | 269,377 | 3.8% |
[ 94.0% - 94.5% ] 94.37% | 118,711 | 3.6% |
[ 94.5% - 95.0% ] 94.72% | 106,635 | 4.3% |
[ 95.0% - 95.5% ] 95.23% | 86,945 | 3.4% |
[ 95.5% - 96.0% ] 95.80% | 80,595 | 4.0% |
[ 96.0% - 96.5% ] 96.26% | 45,619 | 4.1% |
[ 97.5% - 98.0% ] 97.77% | 3,765 | 3.2% |
[ 98.0% - 98.5% ] 98.32% | 10,547 | 4.8% |
[ 98.5% - 99.0% ] 98.63% | 16,256 | 5.7% |
[ 99.0% - 99.5% ] 99.22% | 15,089 | 5.9% |
[ 99.5% - 100.0% ] 99.95% | 14,224 | 6.0% |