Black/African American Median Household Income
COMPARE
Black/African American
Select to Compare
Median Household Income
Black/African American Median Household Income
$67,573
HOUSEHOLD INCOME
0.0/ 100
METRIC RATING
334th/ 347
METRIC RANK
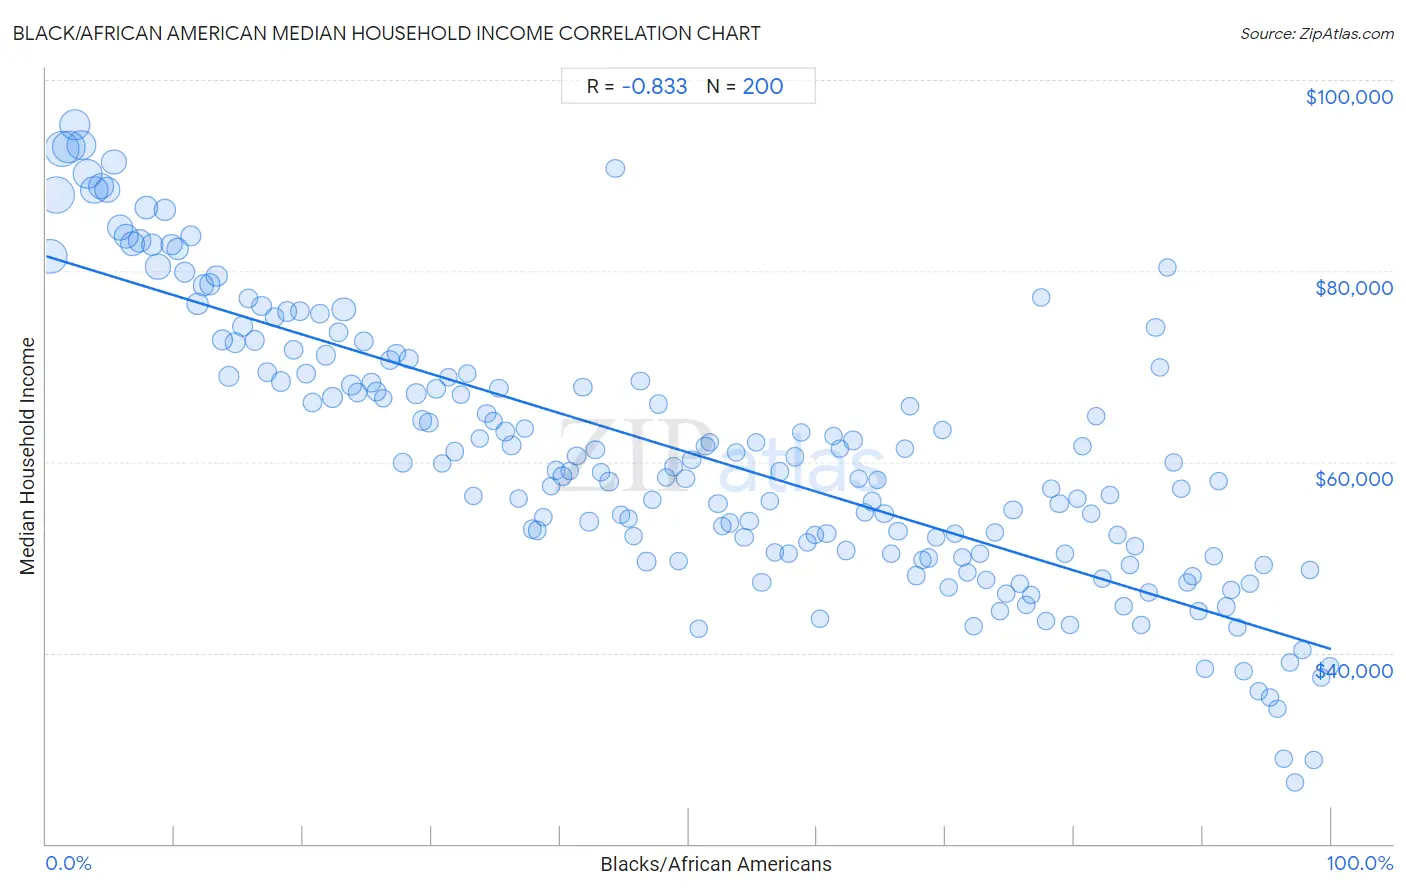
Black/African American Median Household Income Correlation Chart
The statistical analysis conducted on geographies consisting of 564,831,998 people shows a very strong negative correlation between the proportion of Blacks/African Americans and median household income in the United States with a correlation coefficient (R) of -0.833 and weighted average of $67,573. On average, for every 1% (one percent) increase in Blacks/African Americans within a typical geography, there is a decrease of $412 in median household income.
It is essential to understand that the correlation between the percentage of Blacks/African Americans and median household income does not imply a direct cause-and-effect relationship. It remains uncertain whether the presence of Blacks/African Americans influences an upward or downward trend in the level of median household income within an area, or if Blacks/African Americans simply ended up residing in those areas with higher or lower levels of median household income due to other factors.
Demographics Similar to Blacks/African Americans by Median Household Income
In terms of median household income, the demographic groups most similar to Blacks/African Americans are Creek ($67,715, a difference of 0.21%), Sioux ($67,792, a difference of 0.32%), Native/Alaskan ($67,879, a difference of 0.45%), Arapaho ($67,965, a difference of 0.58%), and Cheyenne ($66,974, a difference of 0.89%).
| Demographics | Rating | Rank | Median Household Income |
| Immigrants from Cuba | 0.0 /100 | #327 | Tragic $68,461 |
| Menominee | 0.0 /100 | #328 | Tragic $68,423 |
| Dutch West Indians | 0.0 /100 | #329 | Tragic $68,412 |
| Arapaho | 0.0 /100 | #330 | Tragic $67,965 |
| Natives/Alaskans | 0.0 /100 | #331 | Tragic $67,879 |
| Sioux | 0.0 /100 | #332 | Tragic $67,792 |
| Creek | 0.0 /100 | #333 | Tragic $67,715 |
| Blacks/African Americans | 0.0 /100 | #334 | Tragic $67,573 |
| Cheyenne | 0.0 /100 | #335 | Tragic $66,974 |
| Immigrants from Congo | 0.0 /100 | #336 | Tragic $66,768 |
| Kiowa | 0.0 /100 | #337 | Tragic $65,914 |
| Immigrants from Yemen | 0.0 /100 | #338 | Tragic $65,194 |
| Hopi | 0.0 /100 | #339 | Tragic $65,043 |
| Pueblo | 0.0 /100 | #340 | Tragic $64,692 |
| Crow | 0.0 /100 | #341 | Tragic $63,681 |
Black/African American Median Household Income Correlation Summary
| Measurement | Black/African American Data | Median Household Income Data |
| Minimum | 0.26% | $26,476 |
| Maximum | 99.9% | $95,304 |
| Range | 99.7% | $68,828 |
| Mean | 50.0% | $60,966 |
| Median | 50.0% | $59,295 |
| Interquartile 25% (IQ1) | 25.0% | $50,395 |
| Interquartile 75% (IQ3) | 75.0% | $69,686 |
| Interquartile Range (IQR) | 49.9% | $19,291 |
| Standard Deviation (Sample) | 28.9% | $14,297 |
| Standard Deviation (Population) | 28.9% | $14,261 |
Correlation Details
| Black/African American Percentile | Sample Size | Median Household Income |
[ 0.0% - 0.5% ] 0.26% | 30,291,115 | $81,521 |
[ 0.5% - 1.0% ] 0.74% | 35,416,185 | $87,989 |
[ 1.0% - 1.5% ] 1.23% | 32,403,947 | $92,737 |
[ 1.5% - 2.0% ] 1.74% | 27,999,269 | $92,981 |
[ 2.0% - 2.5% ] 2.24% | 24,396,271 | $95,304 |
[ 2.5% - 3.0% ] 2.75% | 20,758,807 | $93,144 |
[ 3.0% - 3.5% ] 3.25% | 20,745,382 | $90,201 |
[ 3.5% - 4.0% ] 3.74% | 16,816,001 | $88,442 |
[ 4.0% - 4.5% ] 4.25% | 14,632,630 | $88,840 |
[ 4.5% - 5.0% ] 4.74% | 14,895,653 | $88,456 |
[ 5.0% - 5.5% ] 5.24% | 13,588,678 | $91,407 |
[ 5.5% - 6.0% ] 5.76% | 13,807,828 | $84,556 |
[ 6.0% - 6.5% ] 6.23% | 11,799,827 | $83,641 |
[ 6.5% - 7.0% ] 6.72% | 11,727,214 | $82,823 |
[ 7.0% - 7.5% ] 7.26% | 10,993,039 | $83,172 |
[ 7.5% - 8.0% ] 7.75% | 9,105,575 | $86,584 |
[ 8.0% - 8.5% ] 8.24% | 8,296,034 | $82,752 |
[ 8.5% - 9.0% ] 8.69% | 12,396,534 | $80,449 |
[ 9.0% - 9.5% ] 9.24% | 7,611,034 | $86,351 |
[ 9.5% - 10.0% ] 9.75% | 5,919,912 | $82,725 |
[ 10.0% - 10.5% ] 10.26% | 6,423,072 | $82,303 |
[ 10.5% - 11.0% ] 10.76% | 6,035,862 | $79,886 |
[ 11.0% - 11.5% ] 11.27% | 6,004,109 | $83,659 |
[ 11.5% - 12.0% ] 11.75% | 6,645,683 | $76,558 |
[ 12.0% - 12.5% ] 12.24% | 5,836,473 | $78,477 |
[ 12.5% - 13.0% ] 12.73% | 5,229,823 | $78,612 |
[ 13.0% - 13.5% ] 13.26% | 5,605,168 | $79,505 |
[ 13.5% - 14.0% ] 13.72% | 4,988,374 | $72,795 |
[ 14.0% - 14.5% ] 14.23% | 4,358,923 | $68,958 |
[ 14.5% - 15.0% ] 14.73% | 4,187,088 | $72,455 |
[ 15.0% - 15.5% ] 15.25% | 4,398,138 | $74,218 |
[ 15.5% - 16.0% ] 15.75% | 3,601,805 | $77,125 |
[ 16.0% - 16.5% ] 16.25% | 3,265,461 | $72,735 |
[ 16.5% - 17.0% ] 16.75% | 3,397,924 | $76,357 |
[ 17.0% - 17.5% ] 17.22% | 3,505,760 | $69,425 |
[ 17.5% - 18.0% ] 17.77% | 3,686,258 | $75,168 |
[ 18.0% - 18.5% ] 18.26% | 3,592,212 | $68,433 |
[ 18.5% - 19.0% ] 18.73% | 3,667,926 | $75,746 |
[ 19.0% - 19.5% ] 19.23% | 3,044,114 | $71,723 |
[ 19.5% - 20.0% ] 19.75% | 2,543,020 | $75,800 |
[ 20.0% - 20.5% ] 20.23% | 2,766,931 | $69,269 |
[ 20.5% - 21.0% ] 20.77% | 2,358,501 | $66,174 |
[ 21.0% - 21.5% ] 21.29% | 2,730,771 | $75,567 |
[ 21.5% - 22.0% ] 21.77% | 3,748,009 | $71,170 |
[ 22.0% - 22.5% ] 22.31% | 4,857,160 | $66,796 |
[ 22.5% - 23.0% ] 22.72% | 3,025,426 | $73,541 |
[ 23.0% - 23.5% ] 23.15% | 11,615,107 | $75,972 |
[ 23.5% - 24.0% ] 23.75% | 3,973,967 | $68,070 |
[ 24.0% - 24.5% ] 24.22% | 2,186,384 | $67,223 |
[ 24.5% - 25.0% ] 24.74% | 1,984,435 | $72,613 |
[ 25.0% - 25.5% ] 25.28% | 1,591,094 | $68,268 |
[ 25.5% - 26.0% ] 25.71% | 1,470,506 | $67,386 |
[ 26.0% - 26.5% ] 26.22% | 1,909,125 | $66,667 |
[ 26.5% - 27.0% ] 26.77% | 2,138,681 | $70,682 |
[ 27.0% - 27.5% ] 27.23% | 1,787,978 | $71,383 |
[ 27.5% - 28.0% ] 27.75% | 1,491,074 | $59,937 |
[ 28.0% - 28.5% ] 28.22% | 1,987,691 | $70,757 |
[ 28.5% - 29.0% ] 28.80% | 4,742,182 | $67,156 |
[ 29.0% - 29.5% ] 29.24% | 3,239,524 | $64,357 |
[ 29.5% - 30.0% ] 29.77% | 1,876,514 | $64,092 |
[ 30.0% - 30.5% ] 30.35% | 2,244,963 | $67,683 |
[ 30.5% - 31.0% ] 30.81% | 1,191,812 | $59,825 |
[ 31.0% - 31.5% ] 31.29% | 965,770 | $68,843 |
[ 31.5% - 32.0% ] 31.79% | 1,018,703 | $61,067 |
[ 32.0% - 32.5% ] 32.27% | 1,273,560 | $67,026 |
[ 32.5% - 33.0% ] 32.74% | 740,308 | $69,268 |
[ 33.0% - 33.5% ] 33.25% | 1,253,066 | $56,460 |
[ 33.5% - 34.0% ] 33.75% | 907,684 | $62,460 |
[ 34.0% - 34.5% ] 34.28% | 831,228 | $65,055 |
[ 34.5% - 35.0% ] 34.79% | 920,964 | $64,242 |
[ 35.0% - 35.5% ] 35.24% | 1,760,214 | $67,724 |
[ 35.5% - 36.0% ] 35.74% | 1,284,462 | $63,196 |
[ 36.0% - 36.5% ] 36.23% | 1,185,052 | $61,704 |
[ 36.5% - 37.0% ] 36.75% | 564,282 | $56,121 |
[ 37.0% - 37.5% ] 37.25% | 923,047 | $63,516 |
[ 37.5% - 38.0% ] 37.80% | 835,441 | $52,971 |
[ 38.0% - 38.5% ] 38.19% | 957,552 | $52,808 |
[ 38.5% - 39.0% ] 38.70% | 1,448,189 | $54,189 |
[ 39.0% - 39.5% ] 39.31% | 533,070 | $57,490 |
[ 39.5% - 40.0% ] 39.68% | 918,716 | $59,103 |
[ 40.0% - 40.5% ] 40.16% | 2,714,642 | $58,490 |
[ 40.5% - 41.0% ] 40.73% | 1,183,791 | $59,040 |
[ 41.0% - 41.5% ] 41.26% | 1,038,228 | $60,623 |
[ 41.5% - 42.0% ] 41.76% | 965,145 | $67,839 |
[ 42.0% - 42.5% ] 42.25% | 887,277 | $53,728 |
[ 42.5% - 43.0% ] 42.73% | 1,023,698 | $61,294 |
[ 43.0% - 43.5% ] 43.19% | 1,013,820 | $58,932 |
[ 43.5% - 44.0% ] 43.82% | 1,002,728 | $57,919 |
[ 44.0% - 44.5% ] 44.29% | 1,188,174 | $90,710 |
[ 44.5% - 45.0% ] 44.74% | 675,113 | $54,484 |
[ 45.0% - 45.5% ] 45.34% | 693,738 | $54,017 |
[ 45.5% - 46.0% ] 45.74% | 600,165 | $52,250 |
[ 46.0% - 46.5% ] 46.24% | 747,364 | $68,496 |
[ 46.5% - 47.0% ] 46.72% | 1,076,689 | $49,551 |
[ 47.0% - 47.5% ] 47.16% | 749,384 | $56,067 |
[ 47.5% - 48.0% ] 47.65% | 1,075,180 | $66,044 |
[ 48.0% - 48.5% ] 48.26% | 305,334 | $58,378 |
[ 48.5% - 49.0% ] 48.84% | 490,308 | $59,486 |
[ 49.0% - 49.5% ] 49.23% | 484,817 | $49,606 |
[ 49.5% - 50.0% ] 49.74% | 550,306 | $58,213 |
[ 50.0% - 50.5% ] 50.24% | 941,490 | $60,244 |
[ 50.5% - 51.0% ] 50.77% | 201,138 | $42,555 |
[ 51.0% - 51.5% ] 51.29% | 577,266 | $61,624 |
[ 51.5% - 52.0% ] 51.63% | 660,160 | $62,069 |
[ 52.0% - 52.5% ] 52.28% | 536,524 | $55,607 |
[ 52.5% - 53.0% ] 52.63% | 673,178 | $53,278 |
[ 53.0% - 53.5% ] 53.22% | 700,323 | $53,615 |
[ 53.5% - 54.0% ] 53.72% | 387,894 | $61,010 |
[ 54.0% - 54.5% ] 54.32% | 689,128 | $52,107 |
[ 54.5% - 55.0% ] 54.71% | 355,886 | $53,768 |
[ 55.0% - 55.5% ] 55.28% | 448,235 | $62,057 |
[ 55.5% - 56.0% ] 55.68% | 461,076 | $47,342 |
[ 56.0% - 56.5% ] 56.31% | 565,913 | $55,874 |
[ 56.5% - 57.0% ] 56.67% | 515,536 | $50,512 |
[ 57.0% - 57.5% ] 57.10% | 688,240 | $58,971 |
[ 57.5% - 58.0% ] 57.77% | 316,395 | $50,359 |
[ 58.0% - 58.5% ] 58.25% | 367,055 | $60,531 |
[ 58.5% - 59.0% ] 58.76% | 285,366 | $63,112 |
[ 59.0% - 59.5% ] 59.21% | 338,162 | $51,589 |
[ 59.5% - 60.0% ] 59.79% | 365,939 | $52,345 |
[ 60.0% - 60.5% ] 60.22% | 270,362 | $43,590 |
[ 60.5% - 61.0% ] 60.74% | 455,585 | $52,461 |
[ 61.0% - 61.5% ] 61.26% | 880,692 | $62,669 |
[ 61.5% - 62.0% ] 61.73% | 425,328 | $61,370 |
[ 62.0% - 62.5% ] 62.27% | 436,726 | $50,716 |
[ 62.5% - 63.0% ] 62.78% | 517,378 | $62,244 |
[ 63.0% - 63.5% ] 63.24% | 299,141 | $58,257 |
[ 63.5% - 64.0% ] 63.75% | 417,200 | $54,694 |
[ 64.0% - 64.5% ] 64.30% | 1,054,220 | $55,829 |
[ 64.5% - 65.0% ] 64.71% | 328,800 | $58,102 |
[ 65.0% - 65.5% ] 65.21% | 551,959 | $54,544 |
[ 65.5% - 66.0% ] 65.77% | 280,398 | $50,361 |
[ 66.0% - 66.5% ] 66.29% | 270,593 | $52,703 |
[ 66.5% - 67.0% ] 66.83% | 340,782 | $61,379 |
[ 67.0% - 67.5% ] 67.20% | 242,769 | $65,892 |
[ 67.5% - 68.0% ] 67.68% | 191,729 | $48,095 |
[ 68.0% - 68.5% ] 68.16% | 157,391 | $49,748 |
[ 68.5% - 69.0% ] 68.63% | 498,182 | $49,936 |
[ 69.0% - 69.5% ] 69.27% | 207,247 | $52,045 |
[ 69.5% - 70.0% ] 69.77% | 133,688 | $63,284 |
[ 70.0% - 70.5% ] 70.26% | 277,248 | $46,826 |
[ 70.5% - 71.0% ] 70.70% | 388,942 | $52,464 |
[ 71.0% - 71.5% ] 71.27% | 304,156 | $49,967 |
[ 71.5% - 72.0% ] 71.71% | 225,656 | $48,475 |
[ 72.0% - 72.5% ] 72.20% | 236,432 | $42,766 |
[ 72.5% - 73.0% ] 72.65% | 182,936 | $50,408 |
[ 73.0% - 73.5% ] 73.16% | 263,758 | $47,633 |
[ 73.5% - 74.0% ] 73.78% | 357,380 | $52,614 |
[ 74.0% - 74.5% ] 74.25% | 250,538 | $44,387 |
[ 74.5% - 75.0% ] 74.67% | 278,192 | $46,249 |
[ 75.0% - 75.5% ] 75.24% | 180,741 | $54,985 |
[ 75.5% - 76.0% ] 75.77% | 255,417 | $47,204 |
[ 76.0% - 76.5% ] 76.30% | 238,334 | $45,022 |
[ 76.5% - 77.0% ] 76.66% | 115,520 | $46,000 |
[ 77.0% - 77.5% ] 77.38% | 232,771 | $77,208 |
[ 77.5% - 78.0% ] 77.78% | 840,919 | $43,362 |
[ 78.0% - 78.5% ] 78.22% | 230,593 | $57,137 |
[ 78.5% - 79.0% ] 78.83% | 262,715 | $55,678 |
[ 79.0% - 79.5% ] 79.27% | 273,016 | $50,381 |
[ 79.5% - 80.0% ] 79.70% | 130,716 | $42,892 |
[ 80.0% - 80.5% ] 80.21% | 288,267 | $56,168 |
[ 80.5% - 81.0% ] 80.65% | 230,234 | $61,681 |
[ 81.0% - 81.5% ] 81.29% | 241,451 | $54,612 |
[ 81.5% - 82.0% ] 81.68% | 300,757 | $64,799 |
[ 82.0% - 82.5% ] 82.19% | 444,388 | $47,816 |
[ 82.5% - 83.0% ] 82.75% | 167,206 | $56,580 |
[ 83.0% - 83.5% ] 83.34% | 88,337 | $52,348 |
[ 83.5% - 84.0% ] 83.87% | 65,425 | $44,817 |
[ 84.0% - 84.5% ] 84.33% | 187,741 | $49,199 |
[ 84.5% - 85.0% ] 84.73% | 166,359 | $51,215 |
[ 85.0% - 85.5% ] 85.25% | 144,395 | $42,939 |
[ 85.5% - 86.0% ] 85.78% | 143,793 | $46,376 |
[ 86.0% - 86.5% ] 86.33% | 145,273 | $74,060 |
[ 86.5% - 87.0% ] 86.65% | 270,590 | $69,947 |
[ 87.0% - 87.5% ] 87.27% | 177,271 | $80,303 |
[ 87.5% - 88.0% ] 87.74% | 209,699 | $59,899 |
[ 88.0% - 88.5% ] 88.28% | 150,038 | $57,204 |
[ 88.5% - 89.0% ] 88.77% | 205,077 | $47,315 |
[ 89.0% - 89.5% ] 89.16% | 154,571 | $47,996 |
[ 89.5% - 90.0% ] 89.70% | 225,854 | $44,378 |
[ 90.0% - 90.5% ] 90.19% | 88,587 | $38,395 |
[ 90.5% - 91.0% ] 90.87% | 106,939 | $50,107 |
[ 91.0% - 91.5% ] 91.23% | 371,884 | $57,985 |
[ 91.5% - 92.0% ] 91.80% | 140,920 | $44,815 |
[ 92.0% - 92.5% ] 92.26% | 98,727 | $46,599 |
[ 92.5% - 93.0% ] 92.70% | 161,779 | $42,627 |
[ 93.0% - 93.5% ] 93.22% | 188,401 | $38,038 |
[ 93.5% - 94.0% ] 93.70% | 269,057 | $47,238 |
[ 94.0% - 94.5% ] 94.37% | 117,487 | $35,991 |
[ 94.5% - 95.0% ] 94.72% | 106,115 | $49,166 |
[ 95.0% - 95.5% ] 95.23% | 87,287 | $35,269 |
[ 95.5% - 96.0% ] 95.80% | 80,686 | $34,106 |
[ 96.0% - 96.5% ] 96.26% | 45,982 | $28,861 |
[ 96.5% - 97.0% ] 96.82% | 15,461 | $39,046 |
[ 97.0% - 97.5% ] 97.19% | 4,809 | $26,476 |
[ 97.5% - 98.0% ] 97.78% | 2,930 | $40,288 |
[ 98.0% - 98.5% ] 98.32% | 10,143 | $48,617 |
[ 98.5% - 99.0% ] 98.63% | 16,256 | $28,784 |
[ 99.0% - 99.5% ] 99.22% | 14,013 | $37,404 |
[ 99.5% - 100.0% ] 99.95% | 13,583 | $38,626 |