Black/African American No Vehicles in Household
COMPARE
Black/African American
Select to Compare
No Vehicles in Household
Black/African American No Vehicles in Household
11.9%
NO VEHICLES AVAILABLE
1.6/ 100
METRIC RATING
251st/ 347
METRIC RANK
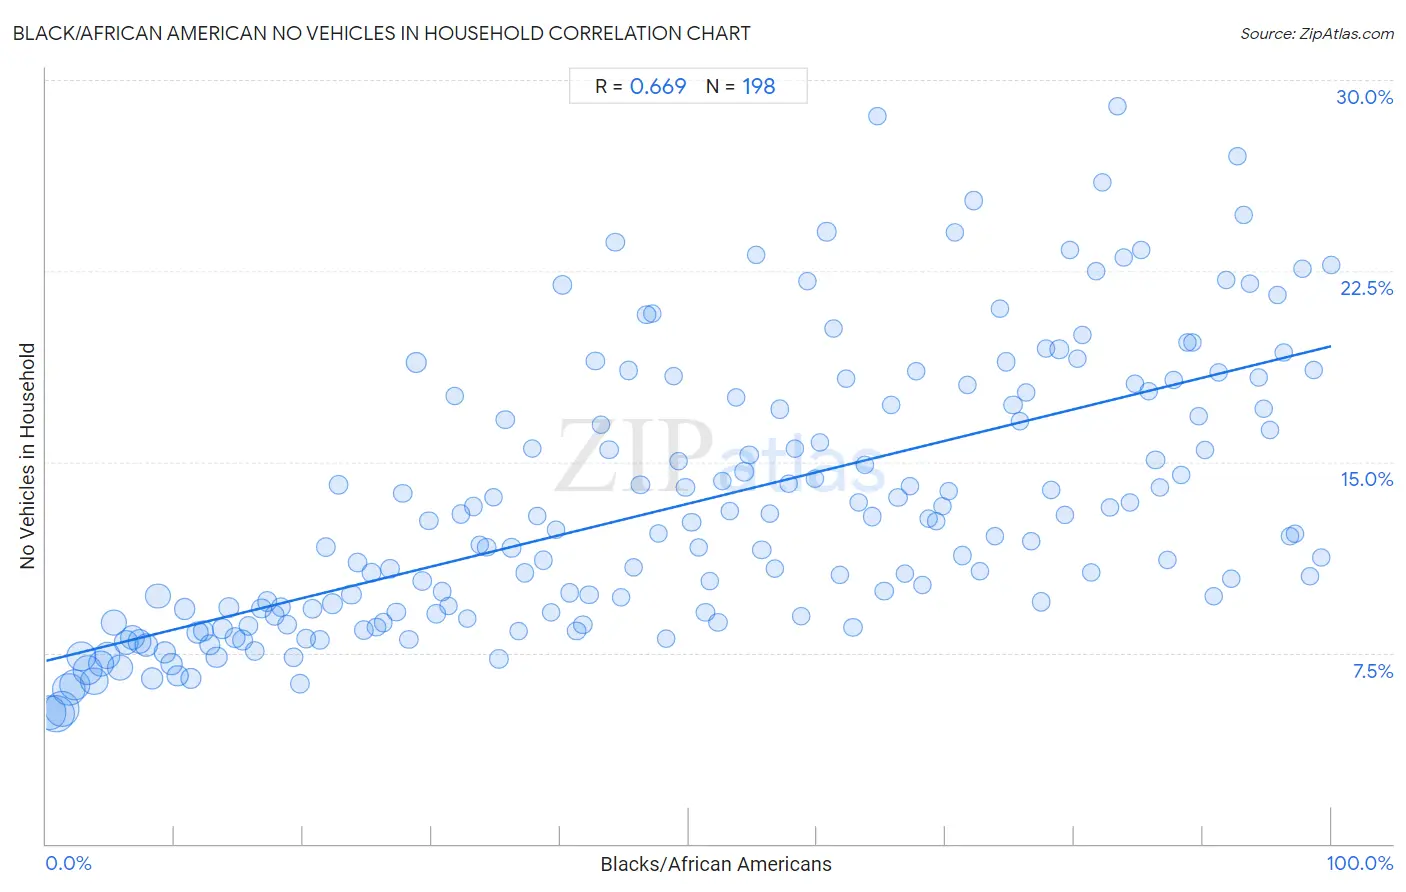
Black/African American No Vehicles in Household Correlation Chart
The statistical analysis conducted on geographies consisting of 549,724,013 people shows a significant positive correlation between the proportion of Blacks/African Americans and percentage of households with no vehicle available in the United States with a correlation coefficient (R) of 0.669 and weighted average of 11.9%. On average, for every 1% (one percent) increase in Blacks/African Americans within a typical geography, there is an increase of 0.12% in percentage of households with no vehicle available.
It is essential to understand that the correlation between the percentage of Blacks/African Americans and percentage of households with no vehicle available does not imply a direct cause-and-effect relationship. It remains uncertain whether the presence of Blacks/African Americans influences an upward or downward trend in the level of percentage of households with no vehicle available within an area, or if Blacks/African Americans simply ended up residing in those areas with higher or lower levels of percentage of households with no vehicle available due to other factors.
Demographics Similar to Blacks/African Americans by No Vehicles in Household
In terms of no vehicles in household, the demographic groups most similar to Blacks/African Americans are Immigrants from Serbia (11.9%, a difference of 0.25%), Egyptian (11.9%, a difference of 0.32%), Paiute (11.8%, a difference of 0.35%), Immigrants from Nigeria (11.8%, a difference of 0.57%), and Immigrants from Belgium (11.8%, a difference of 0.60%).
| Demographics | Rating | Rank | No Vehicles in Household |
| Immigrants from Portugal | 2.2 /100 | #244 | Tragic 11.7% |
| Immigrants from Honduras | 2.1 /100 | #245 | Tragic 11.8% |
| Menominee | 2.0 /100 | #246 | Tragic 11.8% |
| Immigrants from Czechoslovakia | 2.0 /100 | #247 | Tragic 11.8% |
| Immigrants from Belgium | 1.9 /100 | #248 | Tragic 11.8% |
| Immigrants from Nigeria | 1.9 /100 | #249 | Tragic 11.8% |
| Paiute | 1.8 /100 | #250 | Tragic 11.8% |
| Blacks/African Americans | 1.6 /100 | #251 | Tragic 11.9% |
| Immigrants from Serbia | 1.5 /100 | #252 | Tragic 11.9% |
| Egyptians | 1.4 /100 | #253 | Tragic 11.9% |
| Immigrants from Uruguay | 1.3 /100 | #254 | Tragic 11.9% |
| Hondurans | 1.2 /100 | #255 | Tragic 12.0% |
| Liberians | 1.2 /100 | #256 | Tragic 12.0% |
| Nigerians | 0.9 /100 | #257 | Tragic 12.1% |
| South American Indians | 0.9 /100 | #258 | Tragic 12.1% |
Black/African American No Vehicles in Household Correlation Summary
| Measurement | Black/African American Data | No Vehicles in Household Data |
| Minimum | 0.26% | 5.1% |
| Maximum | 100.0% | 29.0% |
| Range | 99.7% | 23.8% |
| Mean | 50.0% | 13.4% |
| Median | 50.0% | 12.2% |
| Interquartile 25% (IQ1) | 25.3% | 9.1% |
| Interquartile 75% (IQ3) | 75.2% | 17.3% |
| Interquartile Range (IQR) | 50.0% | 8.2% |
| Standard Deviation (Sample) | 29.0% | 5.4% |
| Standard Deviation (Population) | 28.9% | 5.3% |
Correlation Details
| Black/African American Percentile | Sample Size | No Vehicles in Household |
[ 0.0% - 0.5% ] 0.26% | 29,703,503 | 5.1% |
[ 0.5% - 1.0% ] 0.74% | 34,983,018 | 5.1% |
[ 1.0% - 1.5% ] 1.23% | 32,092,095 | 5.3% |
[ 1.5% - 2.0% ] 1.74% | 27,813,033 | 6.1% |
[ 2.0% - 2.5% ] 2.24% | 24,232,885 | 6.2% |
[ 2.5% - 3.0% ] 2.75% | 20,631,746 | 7.4% |
[ 3.0% - 3.5% ] 3.25% | 20,574,828 | 6.8% |
[ 3.5% - 4.0% ] 3.74% | 16,719,429 | 6.4% |
[ 4.0% - 4.5% ] 4.24% | 14,537,712 | 7.1% |
[ 4.5% - 5.0% ] 4.74% | 14,811,564 | 7.4% |
[ 5.0% - 5.5% ] 5.24% | 13,503,551 | 8.7% |
[ 5.5% - 6.0% ] 5.76% | 13,772,757 | 6.9% |
[ 6.0% - 6.5% ] 6.23% | 11,747,956 | 7.9% |
[ 6.5% - 7.0% ] 6.72% | 11,681,642 | 8.1% |
[ 7.0% - 7.5% ] 7.26% | 10,956,838 | 8.0% |
[ 7.5% - 8.0% ] 7.75% | 9,045,548 | 7.8% |
[ 8.0% - 8.5% ] 8.24% | 8,268,264 | 6.5% |
[ 8.5% - 9.0% ] 8.69% | 12,363,646 | 9.7% |
[ 9.0% - 9.5% ] 9.24% | 7,554,480 | 7.5% |
[ 9.5% - 10.0% ] 9.75% | 5,896,544 | 7.1% |
[ 10.0% - 10.5% ] 10.26% | 6,396,090 | 6.6% |
[ 10.5% - 11.0% ] 10.76% | 6,017,027 | 9.2% |
[ 11.0% - 11.5% ] 11.27% | 5,973,041 | 6.5% |
[ 11.5% - 12.0% ] 11.75% | 6,615,295 | 8.3% |
[ 12.0% - 12.5% ] 12.24% | 5,808,941 | 8.4% |
[ 12.5% - 13.0% ] 12.73% | 5,210,386 | 7.8% |
[ 13.0% - 13.5% ] 13.26% | 5,580,311 | 7.3% |
[ 13.5% - 14.0% ] 13.72% | 4,974,651 | 8.4% |
[ 14.0% - 14.5% ] 14.23% | 4,354,927 | 9.3% |
[ 14.5% - 15.0% ] 14.73% | 4,167,448 | 8.1% |
[ 15.0% - 15.5% ] 15.25% | 4,386,250 | 8.0% |
[ 15.5% - 16.0% ] 15.75% | 3,592,462 | 8.5% |
[ 16.0% - 16.5% ] 16.25% | 3,262,851 | 7.6% |
[ 16.5% - 17.0% ] 16.75% | 3,403,463 | 9.2% |
[ 17.0% - 17.5% ] 17.22% | 3,477,667 | 9.5% |
[ 17.5% - 18.0% ] 17.77% | 3,674,362 | 9.0% |
[ 18.0% - 18.5% ] 18.26% | 3,592,624 | 9.3% |
[ 18.5% - 19.0% ] 18.73% | 3,658,195 | 8.6% |
[ 19.0% - 19.5% ] 19.23% | 3,031,358 | 7.3% |
[ 19.5% - 20.0% ] 19.75% | 2,539,217 | 6.3% |
[ 20.0% - 20.5% ] 20.23% | 2,765,506 | 8.1% |
[ 20.5% - 21.0% ] 20.77% | 2,356,128 | 9.2% |
[ 21.0% - 21.5% ] 21.29% | 2,716,909 | 8.0% |
[ 21.5% - 22.0% ] 21.77% | 3,735,714 | 11.6% |
[ 22.0% - 22.5% ] 22.31% | 4,845,510 | 9.4% |
[ 22.5% - 23.0% ] 22.72% | 3,022,532 | 14.1% |
[ 23.5% - 24.0% ] 23.75% | 3,970,400 | 9.8% |
[ 24.0% - 24.5% ] 24.22% | 2,176,982 | 11.0% |
[ 24.5% - 25.0% ] 24.74% | 1,976,965 | 8.4% |
[ 25.0% - 25.5% ] 25.28% | 1,588,241 | 10.7% |
[ 25.5% - 26.0% ] 25.71% | 1,468,246 | 8.5% |
[ 26.0% - 26.5% ] 26.22% | 1,908,404 | 8.7% |
[ 26.5% - 27.0% ] 26.77% | 2,137,013 | 10.8% |
[ 27.0% - 27.5% ] 27.23% | 1,782,973 | 9.1% |
[ 27.5% - 28.0% ] 27.75% | 1,490,224 | 13.8% |
[ 28.0% - 28.5% ] 28.22% | 1,987,045 | 8.0% |
[ 28.5% - 29.0% ] 28.80% | 4,739,821 | 18.9% |
[ 29.0% - 29.5% ] 29.24% | 3,231,316 | 10.3% |
[ 29.5% - 30.0% ] 29.77% | 1,873,007 | 12.7% |
[ 30.0% - 30.5% ] 30.35% | 2,242,677 | 9.1% |
[ 30.5% - 31.0% ] 30.81% | 1,191,145 | 9.9% |
[ 31.0% - 31.5% ] 31.29% | 963,301 | 9.3% |
[ 31.5% - 32.0% ] 31.79% | 1,017,704 | 17.6% |
[ 32.0% - 32.5% ] 32.27% | 1,271,435 | 13.0% |
[ 32.5% - 33.0% ] 32.74% | 730,624 | 8.8% |
[ 33.0% - 33.5% ] 33.25% | 1,252,678 | 13.2% |
[ 33.5% - 34.0% ] 33.75% | 913,730 | 11.7% |
[ 34.0% - 34.5% ] 34.28% | 831,082 | 11.7% |
[ 34.5% - 35.0% ] 34.79% | 921,864 | 13.6% |
[ 35.0% - 35.5% ] 35.24% | 1,755,605 | 7.2% |
[ 35.5% - 36.0% ] 35.74% | 1,281,853 | 16.7% |
[ 36.0% - 36.5% ] 36.23% | 1,180,444 | 11.6% |
[ 36.5% - 37.0% ] 36.75% | 562,657 | 8.4% |
[ 37.0% - 37.5% ] 37.25% | 921,770 | 10.6% |
[ 37.5% - 38.0% ] 37.80% | 825,718 | 15.5% |
[ 38.0% - 38.5% ] 38.19% | 953,582 | 12.9% |
[ 38.5% - 39.0% ] 38.70% | 1,450,815 | 11.1% |
[ 39.0% - 39.5% ] 39.31% | 534,929 | 9.1% |
[ 39.5% - 40.0% ] 39.68% | 910,727 | 12.3% |
[ 40.0% - 40.5% ] 40.16% | 2,711,224 | 22.0% |
[ 40.5% - 41.0% ] 40.73% | 1,180,649 | 9.9% |
[ 41.0% - 41.5% ] 41.26% | 1,029,034 | 8.3% |
[ 41.5% - 42.0% ] 41.76% | 953,501 | 8.6% |
[ 42.0% - 42.5% ] 42.25% | 885,085 | 9.8% |
[ 42.5% - 43.0% ] 42.73% | 1,021,219 | 19.0% |
[ 43.0% - 43.5% ] 43.19% | 1,011,504 | 16.5% |
[ 43.5% - 44.0% ] 43.82% | 1,002,420 | 15.5% |
[ 44.0% - 44.5% ] 44.29% | 1,188,174 | 23.6% |
[ 44.5% - 45.0% ] 44.74% | 675,023 | 9.7% |
[ 45.0% - 45.5% ] 45.34% | 693,738 | 18.6% |
[ 45.5% - 46.0% ] 45.74% | 599,823 | 10.9% |
[ 46.0% - 46.5% ] 46.24% | 747,547 | 14.1% |
[ 46.5% - 47.0% ] 46.72% | 1,076,424 | 20.8% |
[ 47.0% - 47.5% ] 47.16% | 748,516 | 20.8% |
[ 47.5% - 48.0% ] 47.65% | 1,068,096 | 12.2% |
[ 48.0% - 48.5% ] 48.26% | 299,902 | 8.1% |
[ 48.5% - 49.0% ] 48.84% | 490,921 | 18.4% |
[ 49.0% - 49.5% ] 49.23% | 483,812 | 15.0% |
[ 49.5% - 50.0% ] 49.74% | 552,253 | 14.0% |
[ 50.0% - 50.5% ] 50.24% | 941,240 | 12.6% |
[ 50.5% - 51.0% ] 50.77% | 201,529 | 11.6% |
[ 51.0% - 51.5% ] 51.29% | 574,447 | 9.1% |
[ 51.5% - 52.0% ] 51.63% | 659,714 | 10.3% |
[ 52.0% - 52.5% ] 52.28% | 537,156 | 8.7% |
[ 52.5% - 53.0% ] 52.63% | 675,829 | 14.2% |
[ 53.0% - 53.5% ] 53.22% | 700,323 | 13.1% |
[ 53.5% - 54.0% ] 53.72% | 377,403 | 17.5% |
[ 54.0% - 54.5% ] 54.32% | 686,566 | 14.6% |
[ 54.5% - 55.0% ] 54.71% | 356,352 | 15.3% |
[ 55.0% - 55.5% ] 55.28% | 448,553 | 23.1% |
[ 55.5% - 56.0% ] 55.68% | 468,586 | 11.5% |
[ 56.0% - 56.5% ] 56.31% | 560,962 | 13.0% |
[ 56.5% - 57.0% ] 56.67% | 515,767 | 10.8% |
[ 57.0% - 57.5% ] 57.10% | 687,830 | 17.1% |
[ 57.5% - 58.0% ] 57.77% | 317,211 | 14.1% |
[ 58.0% - 58.5% ] 58.25% | 368,169 | 15.5% |
[ 58.5% - 59.0% ] 58.76% | 288,853 | 9.0% |
[ 59.0% - 59.5% ] 59.21% | 337,704 | 22.1% |
[ 59.5% - 60.0% ] 59.79% | 361,709 | 14.3% |
[ 60.0% - 60.5% ] 60.22% | 270,730 | 15.8% |
[ 60.5% - 61.0% ] 60.74% | 455,585 | 24.0% |
[ 61.0% - 61.5% ] 61.26% | 880,620 | 20.2% |
[ 61.5% - 62.0% ] 61.73% | 423,909 | 10.6% |
[ 62.0% - 62.5% ] 62.27% | 437,331 | 18.3% |
[ 62.5% - 63.0% ] 62.78% | 515,096 | 8.5% |
[ 63.0% - 63.5% ] 63.24% | 299,141 | 13.4% |
[ 63.5% - 64.0% ] 63.75% | 416,970 | 14.9% |
[ 64.0% - 64.5% ] 64.30% | 1,054,503 | 12.8% |
[ 64.5% - 65.0% ] 64.71% | 328,880 | 28.6% |
[ 65.0% - 65.5% ] 65.21% | 550,878 | 9.9% |
[ 65.5% - 66.0% ] 65.77% | 281,184 | 17.2% |
[ 66.0% - 66.5% ] 66.29% | 269,706 | 13.6% |
[ 66.5% - 67.0% ] 66.83% | 339,950 | 10.6% |
[ 67.0% - 67.5% ] 67.20% | 242,298 | 14.1% |
[ 67.5% - 68.0% ] 67.68% | 192,403 | 18.6% |
[ 68.0% - 68.5% ] 68.16% | 157,210 | 10.2% |
[ 68.5% - 69.0% ] 68.63% | 495,072 | 12.8% |
[ 69.0% - 69.5% ] 69.27% | 206,803 | 12.7% |
[ 69.5% - 70.0% ] 69.77% | 133,550 | 13.3% |
[ 70.0% - 70.5% ] 70.26% | 274,533 | 13.8% |
[ 70.5% - 71.0% ] 70.70% | 389,140 | 24.0% |
[ 71.0% - 71.5% ] 71.27% | 304,156 | 11.3% |
[ 71.5% - 72.0% ] 71.71% | 225,185 | 18.0% |
[ 72.0% - 72.5% ] 72.20% | 236,673 | 25.3% |
[ 72.5% - 73.0% ] 72.65% | 182,969 | 10.7% |
[ 73.5% - 74.0% ] 73.78% | 357,003 | 12.1% |
[ 74.0% - 74.5% ] 74.25% | 250,538 | 21.0% |
[ 74.5% - 75.0% ] 74.67% | 277,021 | 18.9% |
[ 75.0% - 75.5% ] 75.24% | 180,480 | 17.3% |
[ 75.5% - 76.0% ] 75.77% | 255,424 | 16.6% |
[ 76.0% - 76.5% ] 76.30% | 238,557 | 17.7% |
[ 76.5% - 77.0% ] 76.66% | 115,725 | 11.9% |
[ 77.0% - 77.5% ] 77.38% | 232,596 | 9.5% |
[ 77.5% - 78.0% ] 77.78% | 840,919 | 19.5% |
[ 78.0% - 78.5% ] 78.22% | 230,977 | 13.9% |
[ 78.5% - 79.0% ] 78.83% | 262,394 | 19.4% |
[ 79.0% - 79.5% ] 79.27% | 273,426 | 12.9% |
[ 79.5% - 80.0% ] 79.70% | 128,282 | 23.3% |
[ 80.0% - 80.5% ] 80.21% | 286,646 | 19.1% |
[ 80.5% - 81.0% ] 80.65% | 232,632 | 20.0% |
[ 81.0% - 81.5% ] 81.29% | 241,079 | 10.7% |
[ 81.5% - 82.0% ] 81.69% | 299,745 | 22.5% |
[ 82.0% - 82.5% ] 82.19% | 444,388 | 26.0% |
[ 82.5% - 83.0% ] 82.75% | 167,120 | 13.2% |
[ 83.0% - 83.5% ] 83.34% | 88,676 | 29.0% |
[ 83.5% - 84.0% ] 83.87% | 65,425 | 23.0% |
[ 84.0% - 84.5% ] 84.33% | 185,722 | 13.4% |
[ 84.5% - 85.0% ] 84.74% | 164,495 | 18.1% |
[ 85.0% - 85.5% ] 85.25% | 144,340 | 23.3% |
[ 85.5% - 86.0% ] 85.78% | 143,440 | 17.8% |
[ 86.0% - 86.5% ] 86.33% | 144,610 | 15.1% |
[ 86.5% - 87.0% ] 86.65% | 270,914 | 14.0% |
[ 87.0% - 87.5% ] 87.27% | 173,162 | 11.1% |
[ 87.5% - 88.0% ] 87.74% | 209,710 | 18.2% |
[ 88.0% - 88.5% ] 88.28% | 149,935 | 14.5% |
[ 88.5% - 89.0% ] 88.77% | 204,828 | 19.7% |
[ 89.0% - 89.5% ] 89.16% | 154,571 | 19.7% |
[ 89.5% - 90.0% ] 89.70% | 226,619 | 16.8% |
[ 90.0% - 90.5% ] 90.19% | 86,279 | 15.5% |
[ 90.5% - 91.0% ] 90.87% | 106,939 | 9.7% |
[ 91.0% - 91.5% ] 91.23% | 371,636 | 18.5% |
[ 91.5% - 92.0% ] 91.80% | 140,686 | 22.2% |
[ 92.0% - 92.5% ] 92.26% | 98,217 | 10.4% |
[ 92.5% - 93.0% ] 92.70% | 160,294 | 27.0% |
[ 93.0% - 93.5% ] 93.22% | 188,401 | 24.7% |
[ 93.5% - 94.0% ] 93.70% | 268,943 | 22.0% |
[ 94.0% - 94.5% ] 94.37% | 117,345 | 18.3% |
[ 94.5% - 95.0% ] 94.72% | 106,803 | 17.1% |
[ 95.0% - 95.5% ] 95.23% | 87,287 | 16.3% |
[ 95.5% - 96.0% ] 95.80% | 80,595 | 21.5% |
[ 96.0% - 96.5% ] 96.26% | 45,982 | 19.3% |
[ 96.5% - 97.0% ] 96.82% | 15,546 | 12.1% |
[ 97.0% - 97.5% ] 97.19% | 4,809 | 12.2% |
[ 97.5% - 98.0% ] 97.77% | 3,765 | 22.6% |
[ 98.0% - 98.5% ] 98.34% | 9,219 | 10.5% |
[ 98.5% - 99.0% ] 98.63% | 16,256 | 18.6% |
[ 99.0% - 99.5% ] 99.22% | 15,089 | 11.2% |
[ 99.5% - 100.0% ] 99.95% | 14,399 | 22.7% |