Black/African American Median Female Earnings
COMPARE
Black/African American
Select to Compare
Median Female Earnings
Black/African American Median Female Earnings
$35,315
EARNINGS | FEMALES
0.0/ 100
METRIC RATING
302nd/ 347
METRIC RANK
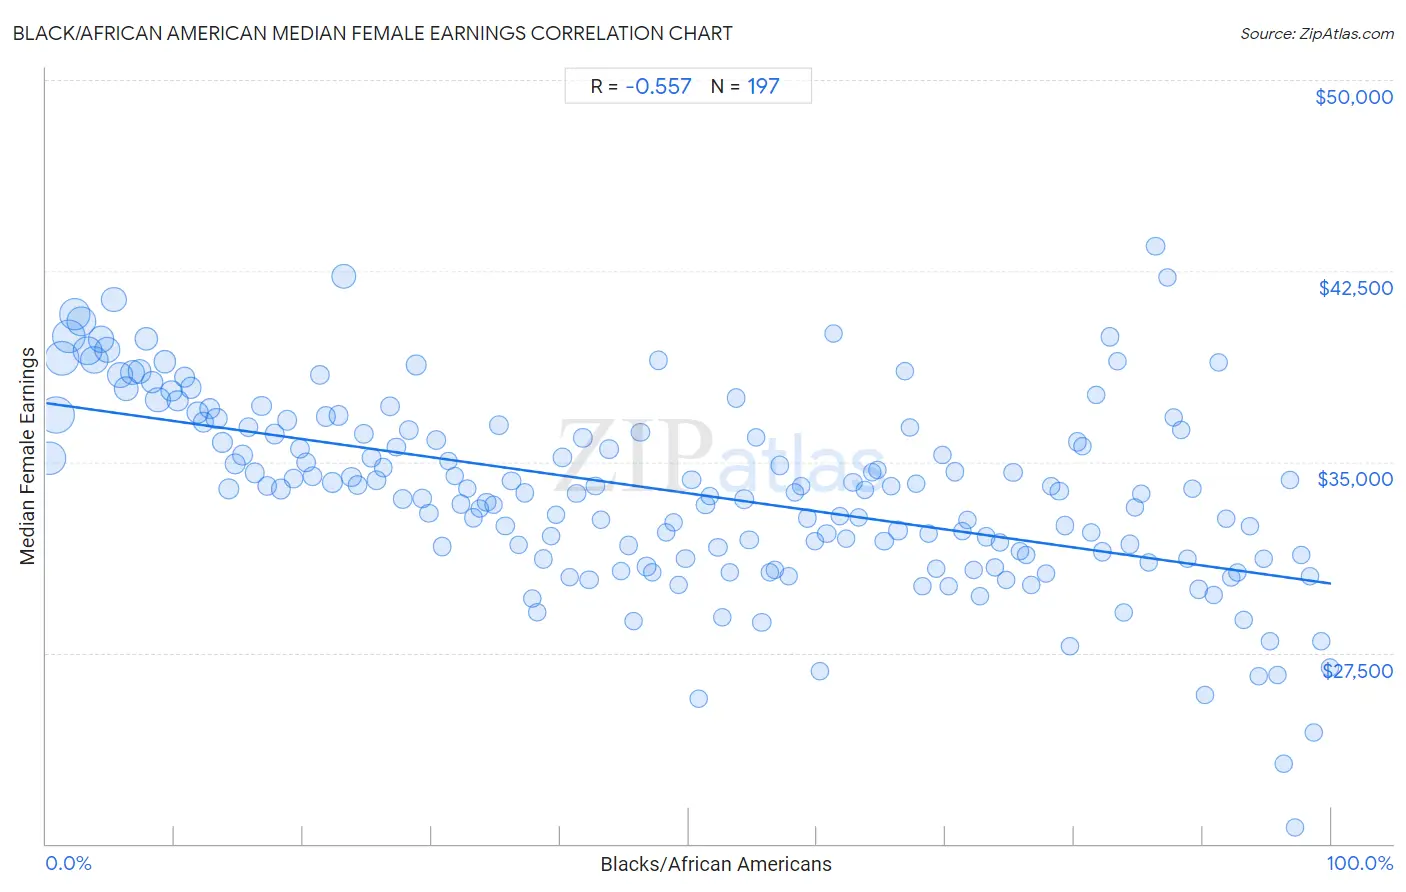
Black/African American Median Female Earnings Correlation Chart
The statistical analysis conducted on geographies consisting of 562,880,101 people shows a substantial negative correlation between the proportion of Blacks/African Americans and median female earnings in the United States with a correlation coefficient (R) of -0.557 and weighted average of $35,315. On average, for every 1% (one percent) increase in Blacks/African Americans within a typical geography, there is a decrease of $71 in median female earnings.
It is essential to understand that the correlation between the percentage of Blacks/African Americans and median female earnings does not imply a direct cause-and-effect relationship. It remains uncertain whether the presence of Blacks/African Americans influences an upward or downward trend in the level of median female earnings within an area, or if Blacks/African Americans simply ended up residing in those areas with higher or lower levels of median female earnings due to other factors.
Demographics Similar to Blacks/African Americans by Median Female Earnings
In terms of median female earnings, the demographic groups most similar to Blacks/African Americans are Immigrants from Latin America ($35,307, a difference of 0.020%), Pima ($35,326, a difference of 0.030%), Crow ($35,266, a difference of 0.14%), Yuman ($35,377, a difference of 0.18%), and Immigrants from Guatemala ($35,444, a difference of 0.36%).
| Demographics | Rating | Rank | Median Female Earnings |
| Comanche | 0.0 /100 | #295 | Tragic $35,661 |
| Mexican American Indians | 0.0 /100 | #296 | Tragic $35,629 |
| Hmong | 0.0 /100 | #297 | Tragic $35,498 |
| Immigrants from Micronesia | 0.0 /100 | #298 | Tragic $35,477 |
| Immigrants from Guatemala | 0.0 /100 | #299 | Tragic $35,444 |
| Yuman | 0.0 /100 | #300 | Tragic $35,377 |
| Pima | 0.0 /100 | #301 | Tragic $35,326 |
| Blacks/African Americans | 0.0 /100 | #302 | Tragic $35,315 |
| Immigrants from Latin America | 0.0 /100 | #303 | Tragic $35,307 |
| Crow | 0.0 /100 | #304 | Tragic $35,266 |
| Bahamians | 0.0 /100 | #305 | Tragic $35,125 |
| Fijians | 0.0 /100 | #306 | Tragic $35,114 |
| Sioux | 0.0 /100 | #307 | Tragic $35,063 |
| Immigrants from Bahamas | 0.0 /100 | #308 | Tragic $35,027 |
| Hondurans | 0.0 /100 | #309 | Tragic $35,013 |
Black/African American Median Female Earnings Correlation Summary
| Measurement | Black/African American Data | Median Female Earnings Data |
| Minimum | 0.26% | $20,616 |
| Maximum | 100.0% | $43,481 |
| Range | 99.7% | $22,865 |
| Mean | 49.7% | $33,784 |
| Median | 49.7% | $33,890 |
| Interquartile 25% (IQ1) | 24.5% | $31,353 |
| Interquartile 75% (IQ3) | 74.5% | $36,250 |
| Interquartile Range (IQR) | 50.0% | $4,897 |
| Standard Deviation (Sample) | 29.0% | $3,688 |
| Standard Deviation (Population) | 28.9% | $3,678 |
Correlation Details
| Black/African American Percentile | Sample Size | Median Female Earnings |
[ 0.0% - 0.5% ] 0.26% | 30,128,044 | $35,138 |
[ 0.5% - 1.0% ] 0.74% | 35,308,349 | $36,842 |
[ 1.0% - 1.5% ] 1.23% | 32,390,743 | $39,064 |
[ 1.5% - 2.0% ] 1.74% | 27,961,689 | $39,916 |
[ 2.0% - 2.5% ] 2.24% | 24,374,186 | $40,807 |
[ 2.5% - 3.0% ] 2.75% | 20,744,230 | $40,506 |
[ 3.0% - 3.5% ] 3.25% | 20,716,289 | $39,364 |
[ 3.5% - 4.0% ] 3.74% | 16,820,495 | $39,006 |
[ 4.0% - 4.5% ] 4.24% | 14,616,067 | $39,818 |
[ 4.5% - 5.0% ] 4.74% | 14,908,178 | $39,399 |
[ 5.0% - 5.5% ] 5.24% | 13,609,205 | $41,381 |
[ 5.5% - 6.0% ] 5.76% | 13,820,273 | $38,403 |
[ 6.0% - 6.5% ] 6.23% | 11,794,207 | $37,852 |
[ 6.5% - 7.0% ] 6.72% | 11,733,002 | $38,490 |
[ 7.0% - 7.5% ] 7.26% | 10,993,057 | $38,543 |
[ 7.5% - 8.0% ] 7.75% | 9,112,953 | $39,852 |
[ 8.0% - 8.5% ] 8.24% | 8,302,468 | $38,139 |
[ 8.5% - 9.0% ] 8.69% | 12,419,014 | $37,449 |
[ 9.0% - 9.5% ] 9.24% | 7,615,941 | $38,931 |
[ 9.5% - 10.0% ] 9.75% | 5,933,455 | $37,793 |
[ 10.0% - 10.5% ] 10.26% | 6,434,006 | $37,396 |
[ 10.5% - 11.0% ] 10.76% | 6,063,292 | $38,322 |
[ 11.0% - 11.5% ] 11.27% | 6,010,392 | $37,908 |
[ 11.5% - 12.0% ] 11.75% | 6,645,814 | $36,946 |
[ 12.0% - 12.5% ] 12.24% | 5,844,662 | $36,551 |
[ 12.5% - 13.0% ] 12.73% | 5,234,196 | $37,077 |
[ 13.0% - 13.5% ] 13.26% | 5,605,880 | $36,696 |
[ 13.5% - 14.0% ] 13.72% | 4,985,574 | $35,749 |
[ 14.0% - 14.5% ] 14.23% | 4,374,124 | $33,941 |
[ 14.5% - 15.0% ] 14.73% | 4,194,986 | $34,915 |
[ 15.0% - 15.5% ] 15.25% | 4,403,387 | $35,278 |
[ 15.5% - 16.0% ] 15.75% | 3,604,304 | $36,366 |
[ 16.0% - 16.5% ] 16.25% | 3,267,490 | $34,570 |
[ 16.5% - 17.0% ] 16.75% | 3,415,932 | $37,193 |
[ 17.0% - 17.5% ] 17.22% | 3,499,140 | $34,062 |
[ 17.5% - 18.0% ] 17.77% | 3,683,520 | $36,088 |
[ 18.0% - 18.5% ] 18.26% | 3,604,071 | $33,926 |
[ 18.5% - 19.0% ] 18.73% | 3,675,360 | $36,634 |
[ 19.0% - 19.5% ] 19.23% | 3,051,855 | $34,357 |
[ 19.5% - 20.0% ] 19.75% | 2,546,019 | $35,538 |
[ 20.0% - 20.5% ] 20.23% | 2,758,827 | $34,963 |
[ 20.5% - 21.0% ] 20.77% | 2,354,852 | $34,443 |
[ 21.0% - 21.5% ] 21.29% | 2,726,442 | $38,410 |
[ 21.5% - 22.0% ] 21.77% | 3,741,366 | $36,792 |
[ 22.0% - 22.5% ] 22.31% | 4,861,251 | $34,195 |
[ 22.5% - 23.0% ] 22.72% | 3,021,124 | $36,826 |
[ 23.0% - 23.5% ] 23.15% | 11,615,140 | $42,285 |
[ 23.5% - 24.0% ] 23.75% | 3,974,360 | $34,396 |
[ 24.0% - 24.5% ] 24.22% | 2,193,521 | $34,112 |
[ 24.5% - 25.0% ] 24.74% | 1,991,015 | $36,103 |
[ 25.0% - 25.5% ] 25.28% | 1,591,724 | $35,177 |
[ 25.5% - 26.0% ] 25.71% | 1,468,160 | $34,264 |
[ 26.0% - 26.5% ] 26.22% | 1,910,858 | $34,787 |
[ 26.5% - 27.0% ] 26.77% | 2,136,779 | $37,203 |
[ 27.0% - 27.5% ] 27.23% | 1,791,293 | $35,584 |
[ 27.5% - 28.0% ] 27.75% | 1,488,888 | $33,542 |
[ 28.0% - 28.5% ] 28.22% | 1,991,029 | $36,255 |
[ 28.5% - 29.0% ] 28.80% | 4,739,590 | $38,784 |
[ 29.0% - 29.5% ] 29.24% | 3,241,233 | $33,575 |
[ 29.5% - 30.0% ] 29.77% | 1,874,000 | $32,980 |
[ 30.0% - 30.5% ] 30.35% | 2,233,671 | $35,876 |
[ 30.5% - 31.0% ] 30.81% | 1,190,983 | $31,663 |
[ 31.0% - 31.5% ] 31.29% | 965,764 | $35,030 |
[ 31.5% - 32.0% ] 31.79% | 1,020,771 | $34,453 |
[ 32.0% - 32.5% ] 32.27% | 1,278,876 | $33,347 |
[ 32.5% - 33.0% ] 32.74% | 742,074 | $33,961 |
[ 33.0% - 33.5% ] 33.25% | 1,248,328 | $32,801 |
[ 33.5% - 34.0% ] 33.75% | 911,942 | $33,168 |
[ 34.0% - 34.5% ] 34.28% | 835,027 | $33,409 |
[ 34.5% - 35.0% ] 34.79% | 920,710 | $33,302 |
[ 35.0% - 35.5% ] 35.24% | 1,769,920 | $36,436 |
[ 35.5% - 36.0% ] 35.74% | 1,280,740 | $32,495 |
[ 36.0% - 36.5% ] 36.23% | 1,184,369 | $34,247 |
[ 36.5% - 37.0% ] 36.75% | 565,301 | $31,733 |
[ 37.0% - 37.5% ] 37.25% | 923,551 | $33,773 |
[ 37.5% - 38.0% ] 37.80% | 835,207 | $29,635 |
[ 38.0% - 38.5% ] 38.19% | 953,134 | $29,098 |
[ 38.5% - 39.0% ] 38.70% | 1,443,911 | $31,194 |
[ 39.0% - 39.5% ] 39.31% | 535,749 | $32,070 |
[ 39.5% - 40.0% ] 39.68% | 909,573 | $32,928 |
[ 40.0% - 40.5% ] 40.16% | 2,710,751 | $35,173 |
[ 40.5% - 41.0% ] 40.73% | 1,180,499 | $30,478 |
[ 41.0% - 41.5% ] 41.26% | 1,034,861 | $33,745 |
[ 41.5% - 42.0% ] 41.76% | 960,745 | $35,944 |
[ 42.0% - 42.5% ] 42.25% | 882,545 | $30,384 |
[ 42.5% - 43.0% ] 42.73% | 1,023,808 | $34,046 |
[ 43.0% - 43.5% ] 43.19% | 1,007,119 | $32,729 |
[ 43.5% - 44.0% ] 43.82% | 995,422 | $35,511 |
[ 44.5% - 45.0% ] 44.74% | 681,228 | $30,727 |
[ 45.0% - 45.5% ] 45.34% | 694,261 | $31,712 |
[ 45.5% - 46.0% ] 45.74% | 600,939 | $28,742 |
[ 46.0% - 46.5% ] 46.24% | 748,046 | $36,167 |
[ 46.5% - 47.0% ] 46.72% | 1,075,090 | $30,891 |
[ 47.0% - 47.5% ] 47.16% | 750,687 | $30,655 |
[ 47.5% - 48.0% ] 47.65% | 1,071,659 | $38,978 |
[ 48.0% - 48.5% ] 48.26% | 303,155 | $32,228 |
[ 48.5% - 49.0% ] 48.84% | 490,450 | $32,628 |
[ 49.0% - 49.5% ] 49.22% | 485,142 | $30,153 |
[ 49.5% - 50.0% ] 49.74% | 550,537 | $31,187 |
[ 50.0% - 50.5% ] 50.24% | 941,860 | $34,305 |
[ 50.5% - 51.0% ] 50.77% | 200,759 | $25,705 |
[ 51.0% - 51.5% ] 51.29% | 576,466 | $33,322 |
[ 51.5% - 52.0% ] 51.63% | 659,267 | $33,659 |
[ 52.0% - 52.5% ] 52.28% | 538,397 | $31,659 |
[ 52.5% - 53.0% ] 52.63% | 674,832 | $28,899 |
[ 53.0% - 53.5% ] 53.22% | 697,408 | $30,657 |
[ 53.5% - 54.0% ] 53.72% | 388,113 | $37,509 |
[ 54.0% - 54.5% ] 54.32% | 685,983 | $33,534 |
[ 54.5% - 55.0% ] 54.71% | 352,488 | $31,926 |
[ 55.0% - 55.5% ] 55.28% | 445,721 | $35,980 |
[ 55.5% - 56.0% ] 55.69% | 467,050 | $28,705 |
[ 56.0% - 56.5% ] 56.31% | 564,490 | $30,666 |
[ 56.5% - 57.0% ] 56.67% | 514,975 | $30,751 |
[ 57.0% - 57.5% ] 57.10% | 688,240 | $34,860 |
[ 57.5% - 58.0% ] 57.77% | 312,210 | $30,490 |
[ 58.0% - 58.5% ] 58.25% | 364,426 | $33,789 |
[ 58.5% - 59.0% ] 58.76% | 286,390 | $34,053 |
[ 59.0% - 59.5% ] 59.21% | 337,635 | $32,794 |
[ 59.5% - 60.0% ] 59.79% | 365,306 | $31,887 |
[ 60.0% - 60.5% ] 60.22% | 270,605 | $26,760 |
[ 60.5% - 61.0% ] 60.74% | 454,672 | $32,187 |
[ 61.0% - 61.5% ] 61.26% | 881,469 | $40,044 |
[ 61.5% - 62.0% ] 61.73% | 425,748 | $32,869 |
[ 62.0% - 62.5% ] 62.27% | 432,056 | $31,965 |
[ 62.5% - 63.0% ] 62.78% | 517,597 | $34,203 |
[ 63.0% - 63.5% ] 63.24% | 299,141 | $32,836 |
[ 63.5% - 64.0% ] 63.75% | 416,787 | $33,890 |
[ 64.0% - 64.5% ] 64.30% | 1,054,540 | $34,581 |
[ 64.5% - 65.0% ] 64.71% | 328,035 | $34,693 |
[ 65.0% - 65.5% ] 65.21% | 551,921 | $31,875 |
[ 65.5% - 66.0% ] 65.77% | 278,461 | $34,030 |
[ 66.0% - 66.5% ] 66.28% | 271,020 | $32,304 |
[ 66.5% - 67.0% ] 66.83% | 337,729 | $38,564 |
[ 67.0% - 67.5% ] 67.20% | 241,525 | $36,361 |
[ 67.5% - 68.0% ] 67.68% | 192,403 | $34,127 |
[ 68.0% - 68.5% ] 68.16% | 157,947 | $30,125 |
[ 68.5% - 69.0% ] 68.63% | 497,468 | $32,187 |
[ 69.0% - 69.5% ] 69.27% | 206,503 | $30,791 |
[ 69.5% - 70.0% ] 69.77% | 133,407 | $35,249 |
[ 70.0% - 70.5% ] 70.26% | 276,409 | $30,108 |
[ 70.5% - 71.0% ] 70.70% | 389,521 | $34,612 |
[ 71.0% - 71.5% ] 71.27% | 303,846 | $32,280 |
[ 71.5% - 72.0% ] 71.71% | 224,505 | $32,726 |
[ 72.0% - 72.5% ] 72.20% | 236,749 | $30,739 |
[ 72.5% - 73.0% ] 72.65% | 182,936 | $29,731 |
[ 73.0% - 73.5% ] 73.16% | 264,132 | $32,057 |
[ 73.5% - 74.0% ] 73.78% | 356,554 | $30,859 |
[ 74.0% - 74.5% ] 74.25% | 248,171 | $31,856 |
[ 74.5% - 75.0% ] 74.67% | 278,277 | $30,382 |
[ 75.0% - 75.5% ] 75.24% | 179,693 | $34,565 |
[ 75.5% - 76.0% ] 75.77% | 255,251 | $31,504 |
[ 76.0% - 76.5% ] 76.30% | 239,466 | $31,354 |
[ 76.5% - 77.0% ] 76.66% | 116,065 | $30,170 |
[ 77.5% - 78.0% ] 77.78% | 840,081 | $30,601 |
[ 78.0% - 78.5% ] 78.22% | 230,805 | $34,046 |
[ 78.5% - 79.0% ] 78.83% | 262,715 | $33,840 |
[ 79.0% - 79.5% ] 79.27% | 273,066 | $32,498 |
[ 79.5% - 80.0% ] 79.71% | 132,409 | $27,756 |
[ 80.0% - 80.5% ] 80.21% | 284,424 | $35,790 |
[ 80.5% - 81.0% ] 80.65% | 232,838 | $35,631 |
[ 81.0% - 81.5% ] 81.29% | 240,280 | $32,238 |
[ 81.5% - 82.0% ] 81.68% | 300,403 | $37,615 |
[ 82.0% - 82.5% ] 82.19% | 443,991 | $31,470 |
[ 82.5% - 83.0% ] 82.75% | 166,622 | $39,913 |
[ 83.0% - 83.5% ] 83.34% | 86,599 | $38,975 |
[ 83.5% - 84.0% ] 83.87% | 65,425 | $29,081 |
[ 84.0% - 84.5% ] 84.33% | 187,741 | $31,760 |
[ 84.5% - 85.0% ] 84.73% | 166,061 | $33,222 |
[ 85.0% - 85.5% ] 85.25% | 143,743 | $33,732 |
[ 85.5% - 86.0% ] 85.78% | 144,140 | $31,046 |
[ 86.0% - 86.5% ] 86.33% | 144,599 | $43,481 |
[ 87.0% - 87.5% ] 87.27% | 177,312 | $42,264 |
[ 87.5% - 88.0% ] 87.74% | 209,596 | $36,731 |
[ 88.0% - 88.5% ] 88.28% | 149,447 | $36,245 |
[ 88.5% - 89.0% ] 88.76% | 204,668 | $31,217 |
[ 89.0% - 89.5% ] 89.16% | 154,571 | $33,924 |
[ 89.5% - 90.0% ] 89.70% | 224,533 | $29,994 |
[ 90.0% - 90.5% ] 90.19% | 88,587 | $25,846 |
[ 90.5% - 91.0% ] 90.87% | 107,548 | $29,777 |
[ 91.0% - 91.5% ] 91.23% | 371,884 | $38,921 |
[ 91.5% - 92.0% ] 91.80% | 139,533 | $32,769 |
[ 92.0% - 92.5% ] 92.26% | 98,700 | $30,439 |
[ 92.5% - 93.0% ] 92.70% | 161,890 | $30,642 |
[ 93.0% - 93.5% ] 93.22% | 186,783 | $28,803 |
[ 93.5% - 94.0% ] 93.70% | 269,377 | $32,456 |
[ 94.0% - 94.5% ] 94.37% | 118,711 | $26,587 |
[ 94.5% - 95.0% ] 94.72% | 106,168 | $31,219 |
[ 95.0% - 95.5% ] 95.23% | 85,691 | $27,944 |
[ 95.5% - 96.0% ] 95.81% | 79,800 | $26,650 |
[ 96.0% - 96.5% ] 96.27% | 44,866 | $23,126 |
[ 96.5% - 97.0% ] 96.83% | 15,372 | $34,299 |
[ 97.0% - 97.5% ] 97.18% | 4,320 | $20,616 |
[ 97.5% - 98.0% ] 97.67% | 1,973 | $31,353 |
[ 98.0% - 98.5% ] 98.32% | 10,229 | $30,486 |
[ 98.5% - 99.0% ] 98.62% | 16,061 | $24,352 |
[ 99.0% - 99.5% ] 99.20% | 15,705 | $27,935 |
[ 99.5% - 100.0% ] 99.95% | 14,363 | $26,908 |