Black/African American Single Mother Households
COMPARE
Black/African American
Select to Compare
Single Mother Households
Black/African American Single Mother Households
9.0%
SINGLE MOTHER HOUSEHOLDS
0.0/ 100
METRIC RATING
339th/ 347
METRIC RANK
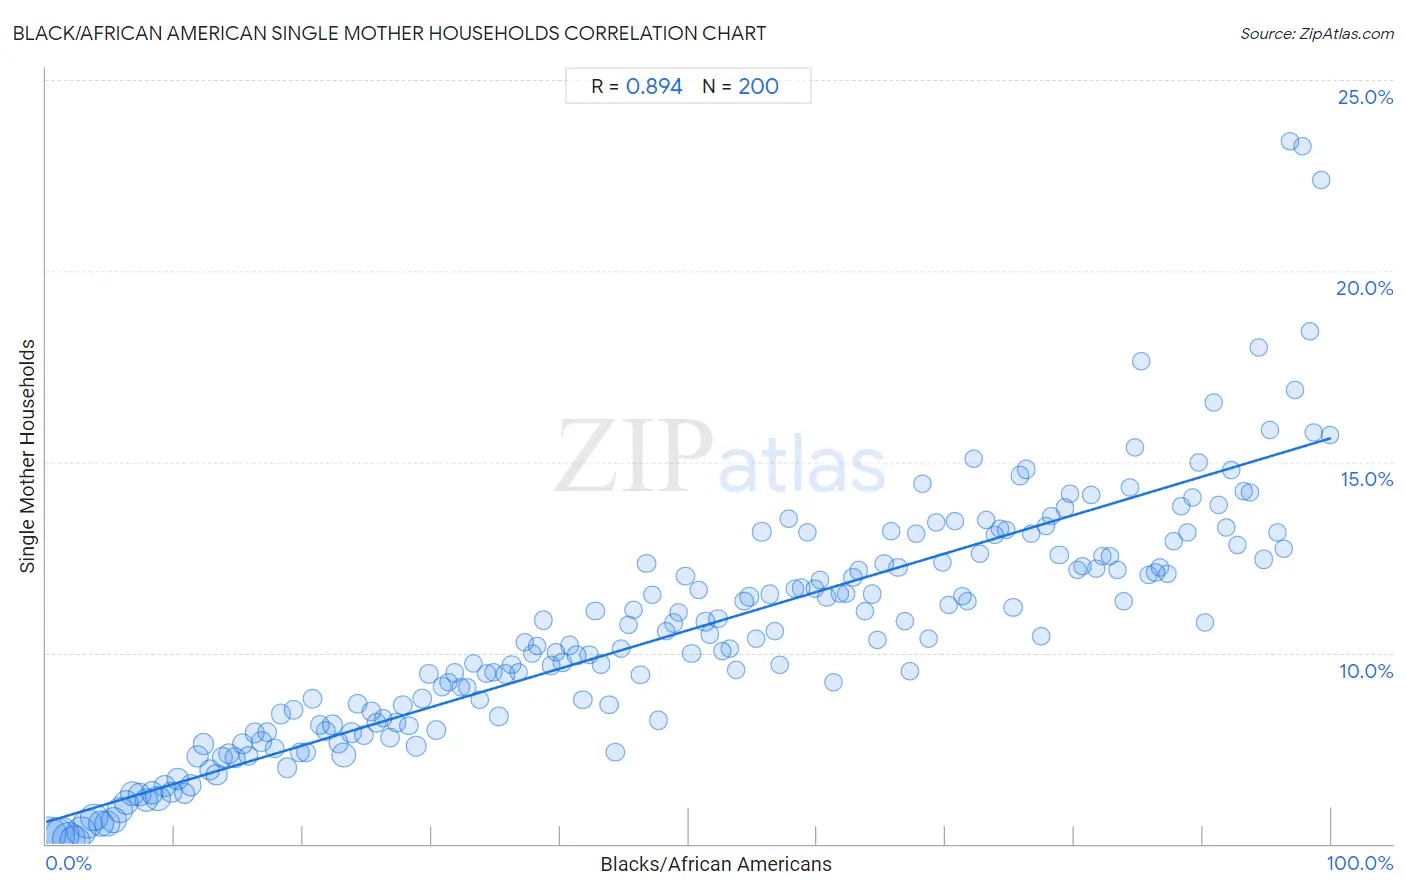
Black/African American Single Mother Households Correlation Chart
The statistical analysis conducted on geographies consisting of 561,713,889 people shows a very strong positive correlation between the proportion of Blacks/African Americans and percentage of single mother households in the United States with a correlation coefficient (R) of 0.894 and weighted average of 9.0%. On average, for every 1% (one percent) increase in Blacks/African Americans within a typical geography, there is an increase of 0.10% in percentage of single mother households.
It is essential to understand that the correlation between the percentage of Blacks/African Americans and percentage of single mother households does not imply a direct cause-and-effect relationship. It remains uncertain whether the presence of Blacks/African Americans influences an upward or downward trend in the level of percentage of single mother households within an area, or if Blacks/African Americans simply ended up residing in those areas with higher or lower levels of percentage of single mother households due to other factors.
Demographics Similar to Blacks/African Americans by Single Mother Households
In terms of single mother households, the demographic groups most similar to Blacks/African Americans are Lumbee (9.1%, a difference of 1.2%), Cape Verdean (8.9%, a difference of 1.5%), Tohono O'odham (9.1%, a difference of 1.6%), Navajo (8.8%, a difference of 1.7%), and Menominee (9.2%, a difference of 1.9%).
| Demographics | Rating | Rank | Single Mother Households |
| U.S. Virgin Islanders | 0.0 /100 | #332 | Tragic 8.6% |
| Liberians | 0.0 /100 | #333 | Tragic 8.6% |
| Immigrants from Liberia | 0.0 /100 | #334 | Tragic 8.7% |
| Immigrants from Dominica | 0.0 /100 | #335 | Tragic 8.7% |
| Puerto Ricans | 0.0 /100 | #336 | Tragic 8.7% |
| Navajo | 0.0 /100 | #337 | Tragic 8.8% |
| Cape Verdeans | 0.0 /100 | #338 | Tragic 8.9% |
| Blacks/African Americans | 0.0 /100 | #339 | Tragic 9.0% |
| Lumbee | 0.0 /100 | #340 | Tragic 9.1% |
| Tohono O'odham | 0.0 /100 | #341 | Tragic 9.1% |
| Menominee | 0.0 /100 | #342 | Tragic 9.2% |
| Dominicans | 0.0 /100 | #343 | Tragic 9.2% |
| Immigrants from Dominican Republic | 0.0 /100 | #344 | Tragic 9.5% |
| Immigrants from Cabo Verde | 0.0 /100 | #345 | Tragic 9.6% |
| Yuman | 0.0 /100 | #346 | Tragic 9.6% |
Black/African American Single Mother Households Correlation Summary
| Measurement | Black/African American Data | Single Mother Households Data |
| Minimum | 0.26% | 5.1% |
| Maximum | 99.9% | 23.4% |
| Range | 99.7% | 18.3% |
| Mean | 50.0% | 10.6% |
| Median | 50.0% | 10.4% |
| Interquartile 25% (IQ1) | 25.0% | 8.1% |
| Interquartile 75% (IQ3) | 75.0% | 12.5% |
| Interquartile Range (IQR) | 49.9% | 4.4% |
| Standard Deviation (Sample) | 28.9% | 3.3% |
| Standard Deviation (Population) | 28.9% | 3.2% |
Correlation Details
| Black/African American Percentile | Sample Size | Single Mother Households |
[ 0.0% - 0.5% ] 0.26% | 29,684,329 | 5.3% |
[ 0.5% - 1.0% ] 0.74% | 34,912,699 | 5.2% |
[ 1.0% - 1.5% ] 1.23% | 32,136,731 | 5.2% |
[ 1.5% - 2.0% ] 1.74% | 27,786,969 | 5.1% |
[ 2.0% - 2.5% ] 2.24% | 24,253,522 | 5.1% |
[ 2.5% - 3.0% ] 2.75% | 20,636,189 | 5.3% |
[ 3.0% - 3.5% ] 3.25% | 20,622,362 | 5.5% |
[ 3.5% - 4.0% ] 3.74% | 16,741,180 | 5.7% |
[ 4.0% - 4.5% ] 4.25% | 14,556,219 | 5.5% |
[ 4.5% - 5.0% ] 4.74% | 14,807,640 | 5.5% |
[ 5.0% - 5.5% ] 5.24% | 13,544,973 | 5.6% |
[ 5.5% - 6.0% ] 5.76% | 13,765,477 | 5.9% |
[ 6.0% - 6.5% ] 6.23% | 11,746,994 | 6.1% |
[ 6.5% - 7.0% ] 6.72% | 11,689,304 | 6.3% |
[ 7.0% - 7.5% ] 7.26% | 10,953,537 | 6.3% |
[ 7.5% - 8.0% ] 7.75% | 9,046,458 | 6.1% |
[ 8.0% - 8.5% ] 8.24% | 8,275,220 | 6.3% |
[ 8.5% - 9.0% ] 8.69% | 12,360,433 | 6.2% |
[ 9.0% - 9.5% ] 9.24% | 7,591,605 | 6.5% |
[ 9.5% - 10.0% ] 9.75% | 5,899,017 | 6.4% |
[ 10.0% - 10.5% ] 10.26% | 6,398,631 | 6.7% |
[ 10.5% - 11.0% ] 10.76% | 6,017,643 | 6.3% |
[ 11.0% - 11.5% ] 11.27% | 5,991,824 | 6.5% |
[ 11.5% - 12.0% ] 11.75% | 6,625,548 | 7.3% |
[ 12.0% - 12.5% ] 12.24% | 5,814,039 | 7.6% |
[ 12.5% - 13.0% ] 12.73% | 5,215,045 | 6.9% |
[ 13.0% - 13.5% ] 13.26% | 5,591,336 | 6.8% |
[ 13.5% - 14.0% ] 13.72% | 4,981,876 | 7.3% |
[ 14.0% - 14.5% ] 14.23% | 4,345,392 | 7.4% |
[ 14.5% - 15.0% ] 14.73% | 4,176,438 | 7.3% |
[ 15.0% - 15.5% ] 15.25% | 4,390,503 | 7.6% |
[ 15.5% - 16.0% ] 15.75% | 3,594,013 | 7.3% |
[ 16.0% - 16.5% ] 16.25% | 3,233,250 | 7.9% |
[ 16.5% - 17.0% ] 16.75% | 3,385,515 | 7.7% |
[ 17.0% - 17.5% ] 17.22% | 3,497,327 | 7.9% |
[ 17.5% - 18.0% ] 17.77% | 3,676,792 | 7.5% |
[ 18.0% - 18.5% ] 18.26% | 3,584,770 | 8.4% |
[ 18.5% - 19.0% ] 18.73% | 3,660,632 | 7.0% |
[ 19.0% - 19.5% ] 19.23% | 3,040,062 | 8.5% |
[ 19.5% - 20.0% ] 19.75% | 2,525,995 | 7.4% |
[ 20.0% - 20.5% ] 20.23% | 2,755,919 | 7.4% |
[ 20.5% - 21.0% ] 20.77% | 2,356,086 | 8.8% |
[ 21.0% - 21.5% ] 21.29% | 2,723,107 | 8.1% |
[ 21.5% - 22.0% ] 21.77% | 3,745,545 | 8.0% |
[ 22.0% - 22.5% ] 22.31% | 4,852,083 | 8.1% |
[ 22.5% - 23.0% ] 22.72% | 3,014,286 | 7.6% |
[ 23.0% - 23.5% ] 23.15% | 11,599,241 | 7.3% |
[ 23.5% - 24.0% ] 23.75% | 3,966,986 | 7.9% |
[ 24.0% - 24.5% ] 24.22% | 2,181,880 | 8.7% |
[ 24.5% - 25.0% ] 24.74% | 1,979,129 | 7.8% |
[ 25.0% - 25.5% ] 25.28% | 1,582,886 | 8.5% |
[ 25.5% - 26.0% ] 25.71% | 1,464,822 | 8.2% |
[ 26.0% - 26.5% ] 26.22% | 1,906,181 | 8.3% |
[ 26.5% - 27.0% ] 26.77% | 2,135,753 | 7.8% |
[ 27.0% - 27.5% ] 27.23% | 1,783,095 | 8.2% |
[ 27.5% - 28.0% ] 27.75% | 1,487,246 | 8.6% |
[ 28.0% - 28.5% ] 28.22% | 1,984,539 | 8.1% |
[ 28.5% - 29.0% ] 28.80% | 4,740,237 | 7.6% |
[ 29.0% - 29.5% ] 29.24% | 3,233,221 | 8.8% |
[ 29.5% - 30.0% ] 29.77% | 1,872,609 | 9.5% |
[ 30.0% - 30.5% ] 30.35% | 2,244,661 | 8.0% |
[ 30.5% - 31.0% ] 30.81% | 1,191,292 | 9.1% |
[ 31.0% - 31.5% ] 31.29% | 965,359 | 9.2% |
[ 31.5% - 32.0% ] 31.80% | 1,015,457 | 9.5% |
[ 32.0% - 32.5% ] 32.27% | 1,264,334 | 9.1% |
[ 32.5% - 33.0% ] 32.74% | 730,614 | 9.1% |
[ 33.0% - 33.5% ] 33.25% | 1,251,562 | 9.7% |
[ 33.5% - 34.0% ] 33.75% | 909,920 | 8.8% |
[ 34.0% - 34.5% ] 34.28% | 829,674 | 9.5% |
[ 34.5% - 35.0% ] 34.79% | 919,526 | 9.5% |
[ 35.0% - 35.5% ] 35.24% | 1,755,703 | 8.3% |
[ 35.5% - 36.0% ] 35.74% | 1,280,419 | 9.4% |
[ 36.0% - 36.5% ] 36.23% | 1,183,234 | 9.7% |
[ 36.5% - 37.0% ] 36.75% | 564,163 | 9.5% |
[ 37.0% - 37.5% ] 37.25% | 919,576 | 10.3% |
[ 37.5% - 38.0% ] 37.80% | 834,625 | 10.0% |
[ 38.0% - 38.5% ] 38.19% | 955,904 | 10.2% |
[ 38.5% - 39.0% ] 38.70% | 1,449,314 | 10.9% |
[ 39.0% - 39.5% ] 39.31% | 533,956 | 9.7% |
[ 39.5% - 40.0% ] 39.68% | 910,380 | 10.0% |
[ 40.0% - 40.5% ] 40.16% | 2,713,565 | 9.8% |
[ 40.5% - 41.0% ] 40.73% | 1,182,634 | 10.2% |
[ 41.0% - 41.5% ] 41.26% | 1,034,745 | 9.9% |
[ 41.5% - 42.0% ] 41.76% | 961,801 | 8.8% |
[ 42.0% - 42.5% ] 42.25% | 887,053 | 9.9% |
[ 42.5% - 43.0% ] 42.73% | 1,017,471 | 11.1% |
[ 43.0% - 43.5% ] 43.19% | 1,012,697 | 9.7% |
[ 43.5% - 44.0% ] 43.82% | 997,117 | 8.6% |
[ 44.0% - 44.5% ] 44.29% | 1,186,426 | 7.4% |
[ 44.5% - 45.0% ] 44.74% | 674,093 | 10.1% |
[ 45.0% - 45.5% ] 45.34% | 693,744 | 10.7% |
[ 45.5% - 46.0% ] 45.74% | 598,340 | 11.1% |
[ 46.0% - 46.5% ] 46.24% | 745,129 | 9.4% |
[ 46.5% - 47.0% ] 46.72% | 1,070,165 | 12.3% |
[ 47.0% - 47.5% ] 47.16% | 744,875 | 11.5% |
[ 47.5% - 48.0% ] 47.65% | 1,069,011 | 8.2% |
[ 48.0% - 48.5% ] 48.26% | 298,160 | 10.6% |
[ 48.5% - 49.0% ] 48.84% | 490,063 | 10.8% |
[ 49.0% - 49.5% ] 49.23% | 485,281 | 11.0% |
[ 49.5% - 50.0% ] 49.74% | 548,660 | 12.0% |
[ 50.0% - 50.5% ] 50.24% | 940,479 | 10.0% |
[ 50.5% - 51.0% ] 50.77% | 201,894 | 11.7% |
[ 51.0% - 51.5% ] 51.29% | 576,326 | 10.8% |
[ 51.5% - 52.0% ] 51.63% | 660,719 | 10.5% |
[ 52.0% - 52.5% ] 52.28% | 533,179 | 10.9% |
[ 52.5% - 53.0% ] 52.63% | 675,996 | 10.1% |
[ 53.0% - 53.5% ] 53.22% | 700,323 | 10.1% |
[ 53.5% - 54.0% ] 53.72% | 387,400 | 9.5% |
[ 54.0% - 54.5% ] 54.32% | 687,909 | 11.4% |
[ 54.5% - 55.0% ] 54.71% | 351,791 | 11.5% |
[ 55.0% - 55.5% ] 55.28% | 449,064 | 10.4% |
[ 55.5% - 56.0% ] 55.68% | 460,821 | 13.2% |
[ 56.0% - 56.5% ] 56.31% | 563,819 | 11.5% |
[ 56.5% - 57.0% ] 56.67% | 515,115 | 10.6% |
[ 57.0% - 57.5% ] 57.10% | 686,451 | 9.7% |
[ 57.5% - 58.0% ] 57.77% | 316,912 | 13.5% |
[ 58.0% - 58.5% ] 58.25% | 368,481 | 11.7% |
[ 58.5% - 59.0% ] 58.76% | 286,978 | 11.7% |
[ 59.0% - 59.5% ] 59.21% | 337,163 | 13.1% |
[ 59.5% - 60.0% ] 59.79% | 364,101 | 11.7% |
[ 60.0% - 60.5% ] 60.22% | 271,184 | 11.9% |
[ 60.5% - 61.0% ] 60.74% | 455,360 | 11.5% |
[ 61.0% - 61.5% ] 61.26% | 880,456 | 9.2% |
[ 61.5% - 62.0% ] 61.73% | 423,438 | 11.6% |
[ 62.0% - 62.5% ] 62.27% | 434,817 | 11.6% |
[ 62.5% - 63.0% ] 62.78% | 517,702 | 12.0% |
[ 63.0% - 63.5% ] 63.24% | 298,436 | 12.2% |
[ 63.5% - 64.0% ] 63.75% | 418,331 | 11.1% |
[ 64.0% - 64.5% ] 64.30% | 1,052,115 | 11.5% |
[ 64.5% - 65.0% ] 64.71% | 329,115 | 10.3% |
[ 65.0% - 65.5% ] 65.21% | 550,878 | 12.3% |
[ 65.5% - 66.0% ] 65.77% | 278,961 | 13.2% |
[ 66.0% - 66.5% ] 66.29% | 269,706 | 12.2% |
[ 66.5% - 67.0% ] 66.83% | 339,950 | 10.8% |
[ 67.0% - 67.5% ] 67.20% | 241,054 | 9.5% |
[ 67.5% - 68.0% ] 67.68% | 191,968 | 13.1% |
[ 68.0% - 68.5% ] 68.16% | 156,772 | 14.4% |
[ 68.5% - 69.0% ] 68.63% | 498,322 | 10.4% |
[ 69.0% - 69.5% ] 69.27% | 207,247 | 13.4% |
[ 69.5% - 70.0% ] 69.77% | 133,545 | 12.4% |
[ 70.0% - 70.5% ] 70.26% | 275,893 | 11.3% |
[ 70.5% - 71.0% ] 70.70% | 389,467 | 13.4% |
[ 71.0% - 71.5% ] 71.27% | 303,846 | 11.5% |
[ 71.5% - 72.0% ] 71.71% | 224,167 | 11.4% |
[ 72.0% - 72.5% ] 72.20% | 236,281 | 15.1% |
[ 72.5% - 73.0% ] 72.65% | 181,497 | 12.6% |
[ 73.0% - 73.5% ] 73.16% | 263,820 | 13.5% |
[ 73.5% - 74.0% ] 73.78% | 356,765 | 13.1% |
[ 74.0% - 74.5% ] 74.25% | 250,267 | 13.3% |
[ 74.5% - 75.0% ] 74.67% | 279,597 | 13.2% |
[ 75.0% - 75.5% ] 75.24% | 179,339 | 11.2% |
[ 75.5% - 76.0% ] 75.76% | 255,696 | 14.6% |
[ 76.0% - 76.5% ] 76.30% | 238,029 | 14.8% |
[ 76.5% - 77.0% ] 76.66% | 115,058 | 13.1% |
[ 77.0% - 77.5% ] 77.38% | 232,771 | 10.4% |
[ 77.5% - 78.0% ] 77.78% | 840,919 | 13.3% |
[ 78.0% - 78.5% ] 78.22% | 228,671 | 13.6% |
[ 78.5% - 79.0% ] 78.83% | 262,425 | 12.6% |
[ 79.0% - 79.5% ] 79.27% | 273,010 | 13.8% |
[ 79.5% - 80.0% ] 79.70% | 130,821 | 14.2% |
[ 80.0% - 80.5% ] 80.21% | 288,329 | 12.2% |
[ 80.5% - 81.0% ] 80.64% | 231,427 | 12.3% |
[ 81.0% - 81.5% ] 81.29% | 241,079 | 14.1% |
[ 81.5% - 82.0% ] 81.68% | 300,403 | 12.2% |
[ 82.0% - 82.5% ] 82.19% | 444,388 | 12.5% |
[ 82.5% - 83.0% ] 82.75% | 167,120 | 12.5% |
[ 83.0% - 83.5% ] 83.34% | 86,599 | 12.2% |
[ 83.5% - 84.0% ] 83.88% | 63,772 | 11.4% |
[ 84.0% - 84.5% ] 84.33% | 187,697 | 14.3% |
[ 84.5% - 85.0% ] 84.73% | 166,668 | 15.4% |
[ 85.0% - 85.5% ] 85.25% | 144,505 | 17.6% |
[ 85.5% - 86.0% ] 85.78% | 141,661 | 12.0% |
[ 86.0% - 86.5% ] 86.33% | 144,912 | 12.1% |
[ 86.5% - 87.0% ] 86.65% | 270,981 | 12.2% |
[ 87.0% - 87.5% ] 87.27% | 175,943 | 12.1% |
[ 87.5% - 88.0% ] 87.74% | 209,555 | 12.9% |
[ 88.0% - 88.5% ] 88.28% | 149,473 | 13.8% |
[ 88.5% - 89.0% ] 88.77% | 205,121 | 13.1% |
[ 89.0% - 89.5% ] 89.16% | 154,571 | 14.1% |
[ 89.5% - 90.0% ] 89.70% | 226,262 | 15.0% |
[ 90.0% - 90.5% ] 90.19% | 88,550 | 10.8% |
[ 90.5% - 91.0% ] 90.87% | 106,823 | 16.5% |
[ 91.0% - 91.5% ] 91.23% | 370,818 | 13.9% |
[ 91.5% - 92.0% ] 91.80% | 140,920 | 13.3% |
[ 92.0% - 92.5% ] 92.26% | 98,594 | 14.8% |
[ 92.5% - 93.0% ] 92.70% | 161,712 | 12.8% |
[ 93.0% - 93.5% ] 93.22% | 187,498 | 14.2% |
[ 93.5% - 94.0% ] 93.70% | 269,057 | 14.2% |
[ 94.0% - 94.5% ] 94.37% | 118,162 | 18.0% |
[ 94.5% - 95.0% ] 94.72% | 105,757 | 12.4% |
[ 95.0% - 95.5% ] 95.23% | 87,287 | 15.8% |
[ 95.5% - 96.0% ] 95.80% | 80,782 | 13.1% |
[ 96.0% - 96.5% ] 96.26% | 45,982 | 12.7% |
[ 96.5% - 97.0% ] 96.83% | 15,372 | 23.4% |
[ 97.0% - 97.5% ] 97.19% | 4,809 | 16.9% |
[ 97.5% - 98.0% ] 97.77% | 2,650 | 23.3% |
[ 98.0% - 98.5% ] 98.32% | 10,027 | 18.4% |
[ 98.5% - 99.0% ] 98.63% | 16,256 | 15.8% |
[ 99.0% - 99.5% ] 99.22% | 14,544 | 22.4% |
[ 99.5% - 100.0% ] 99.94% | 12,163 | 15.7% |