Immigrants from Iran vs Serbian Married-couple Households

COMPARE

Immigrants from Iran
Race
Ancestry
AfghanAfricanAlaska NativeAlaskan AthabascanAlbanianAleutAlsatianAmericanApacheArabArapahoArgentineanArmenianAssyrian/Chaldean/SyriacAustralianAustrianBahamianBangladeshiBarbadianBasqueBelgianBelizeanBermudanBhutaneseBlackfeetBolivianBrazilianBritishBritish West IndianBulgarianBurmeseCajunCambodianCanadianCape VerdeanCarpatho RusynCelticCentral AmericanCentral American IndianCherokeeCheyenneChickasawChileanChineseChippewaChoctawColombianColvilleComancheCosta RicanCreeCreekCroatianCrowCubanCypriotCzechCzechoslovakianDanishDelawareDominicanDutchDutch West IndianEastern EuropeanEcuadorianEgyptianEnglishEstonianEthiopianEuropeanFijianFilipinoFinnishFrenchFrench American IndianFrench CanadianGermanGerman RussianGhanaianGreekGuamanian/ChamorroGuatemalanGuyaneseHaitianHmongHonduranHopiHoumaHungarianIcelanderIndian (Asian)IndonesianInupiatIranianIraqiIrishIroquoisIsraeliItalianJamaicanJapaneseJordanianKenyanKiowaKoreanLaotianLatvianLebaneseLiberianLithuanianLumbeeLuxembourgerMacedonianMalaysianMalteseMarshalleseMenomineeMexicanMexican American IndianMongolianMoroccanNative HawaiianNavajoNepaleseNew ZealanderNicaraguanNigerianNorthern EuropeanNorwegianOkinawanOsageOttawaPaiutePakistaniPalestinianPanamanianParaguayanPennsylvania GermanPeruvianPimaPolishPortuguesePotawatomiPuebloPuerto RicanPuget Sound SalishRomanianRussianSalvadoranSamoanScandinavianScotch-IrishScottishSeminoleSenegaleseShoshoneSierra LeoneanSiouxSlavicSlovakSloveneSomaliSouth AfricanSouth AmericanSouth American IndianSoviet UnionSpaniardSpanishSpanish AmericanSpanish American IndianSri LankanSubsaharan AfricanSudaneseSwedishSwissSyrianTaiwaneseThaiTlingit-HaidaTohono O'OdhamTonganTrinidadian and TobagonianTsimshianTurkishU.S. Virgin IslanderUgandanUkrainianUruguayanUteVenezuelanVietnameseWelshWest IndianYakamaYaquiYugoslavianYumanYup'ikZimbabwean
Immigration
NonimmigrantsImmigrantsAfghanistanAfricaAlbaniaArgentinaArmeniaAsiaAustraliaAustriaBahamasBangladeshBarbadosBelarusBelgiumBelizeBoliviaBosnia and HerzegovinaBrazilBulgariaBurma/MyanmarCabo VerdeCambodiaCameroonCanadaCaribbeanCentral AmericaChileChinaColombiaCongoCosta RicaCroatiaCubaCzechoslovakiaDenmarkDominicaDominican RepublicEastern AfricaEastern AsiaEastern EuropeEcuadorEgyptEl SalvadorEnglandEritreaEthiopiaEuropeFijiFranceGermanyGhanaGreeceGrenadaGuatemalaGuyanaHaitiHondurasHong KongHungaryIndiaIndonesiaIranIraqIrelandIsraelItalyJamaicaJapanJordanKazakhstanKenyaKoreaKuwaitLaosLatin AmericaLatviaLebanonLiberiaLithuaniaMalaysiaMexicoMicronesiaMiddle AfricaMoldovaMoroccoNepalNetherlandsNicaraguaNigeriaNorth AmericaNorth MacedoniaNorthern AfricaNorthern EuropeNorwayOceaniaPakistanPanamaPeruPhilippinesPolandPortugalRomaniaRussiaSaudi ArabiaScotlandSenegalSerbiaSierra LeoneSingaporeSomaliaSouth AfricaSouth AmericaSouth Central AsiaSouth Eastern AsiaSouthern EuropeSpainSri LankaSt. Vincent and the GrenadinesSudanSwedenSwitzerlandSyriaTaiwanThailandTrinidad and TobagoTurkeyUgandaUkraineUruguayUzbekistanVenezuelaVietnamWest IndiesWestern AfricaWestern AsiaWestern EuropeYemenZaireZimbabweAzores
Serbian
Race
Ancestry
AfghanAfricanAlaska NativeAlaskan AthabascanAlbanianAleutAlsatianAmericanApacheArabArapahoArgentineanArmenianAssyrian/Chaldean/SyriacAustralianAustrianBahamianBangladeshiBarbadianBasqueBelgianBelizeanBermudanBhutaneseBlackfeetBolivianBrazilianBritishBritish West IndianBulgarianBurmeseCajunCambodianCanadianCape VerdeanCarpatho RusynCelticCentral AmericanCentral American IndianCherokeeCheyenneChickasawChileanChineseChippewaChoctawColombianColvilleComancheCosta RicanCreeCreekCroatianCrowCubanCypriotCzechCzechoslovakianDanishDelawareDominicanDutchDutch West IndianEastern EuropeanEcuadorianEgyptianEnglishEstonianEthiopianEuropeanFijianFilipinoFinnishFrenchFrench American IndianFrench CanadianGermanGerman RussianGhanaianGreekGuamanian/ChamorroGuatemalanGuyaneseHaitianHmongHonduranHopiHoumaHungarianIcelanderIndian (Asian)IndonesianInupiatIranianIraqiIrishIroquoisIsraeliItalianJamaicanJapaneseJordanianKenyanKiowaKoreanLaotianLatvianLebaneseLiberianLithuanianLumbeeLuxembourgerMacedonianMalaysianMalteseMarshalleseMenomineeMexicanMexican American IndianMongolianMoroccanNative HawaiianNavajoNepaleseNew ZealanderNicaraguanNigerianNorthern EuropeanNorwegianOkinawanOsageOttawaPaiutePakistaniPalestinianPanamanianParaguayanPennsylvania GermanPeruvianPimaPolishPortuguesePotawatomiPuebloPuerto RicanPuget Sound SalishRomanianRussianSalvadoranSamoanScandinavianScotch-IrishScottishSeminoleSenegaleseSerbianShoshoneSierra LeoneanSiouxSlavicSlovakSloveneSomaliSouth AfricanSouth AmericanSouth American IndianSoviet UnionSpaniardSpanishSpanish AmericanSpanish American IndianSri LankanSubsaharan AfricanSudaneseSwedishSwissSyrianTaiwaneseThaiTlingit-HaidaTohono O'OdhamTonganTrinidadian and TobagonianTsimshianTurkishU.S. Virgin IslanderUgandanUkrainianUruguayanUteVenezuelanVietnameseWelshWest IndianYakamaYaquiYugoslavianYumanYup'ikZimbabwean
Immigration
NonimmigrantsImmigrantsAfghanistanAfricaAlbaniaArgentinaArmeniaAsiaAustraliaAustriaBahamasBangladeshBarbadosBelarusBelgiumBelizeBoliviaBosnia and HerzegovinaBrazilBulgariaBurma/MyanmarCabo VerdeCambodiaCameroonCanadaCaribbeanCentral AmericaChileChinaColombiaCongoCosta RicaCroatiaCubaCzechoslovakiaDenmarkDominicaDominican RepublicEastern AfricaEastern AsiaEastern EuropeEcuadorEgyptEl SalvadorEnglandEritreaEthiopiaEuropeFijiFranceGermanyGhanaGreeceGrenadaGuatemalaGuyanaHaitiHondurasHong KongHungaryIndiaIndonesiaIraqIrelandIsraelItalyJamaicaJapanJordanKazakhstanKenyaKoreaKuwaitLaosLatin AmericaLatviaLebanonLiberiaLithuaniaMalaysiaMexicoMicronesiaMiddle AfricaMoldovaMoroccoNepalNetherlandsNicaraguaNigeriaNorth AmericaNorth MacedoniaNorthern AfricaNorthern EuropeNorwayOceaniaPakistanPanamaPeruPhilippinesPolandPortugalRomaniaRussiaSaudi ArabiaScotlandSenegalSerbiaSierra LeoneSingaporeSomaliaSouth AfricaSouth AmericaSouth Central AsiaSouth Eastern AsiaSouthern EuropeSpainSri LankaSt. Vincent and the GrenadinesSudanSwedenSwitzerlandSyriaTaiwanThailandTrinidad and TobagoTurkeyUgandaUkraineUruguayUzbekistanVenezuelaVietnamWest IndiesWestern AfricaWestern AsiaWestern EuropeYemenZaireZimbabweAzores
Married-couple Households
Income
Poverty
Unemployment
Labor Participation
Family Structure
Vehicle Availability
Education Level
Disability

Married-couple Households Comparison

Immigrants from Iran

Serbians

Exceptional
Good
48.8%
MARRIED-COUPLE HOUSEHOLDS
99.6/ 100
METRIC RATING
43rd/ 347
METRIC RANK
47.0%
MARRIED-COUPLE HOUSEHOLDS
76.3/ 100
METRIC RATING
152nd/ 347
METRIC RANK

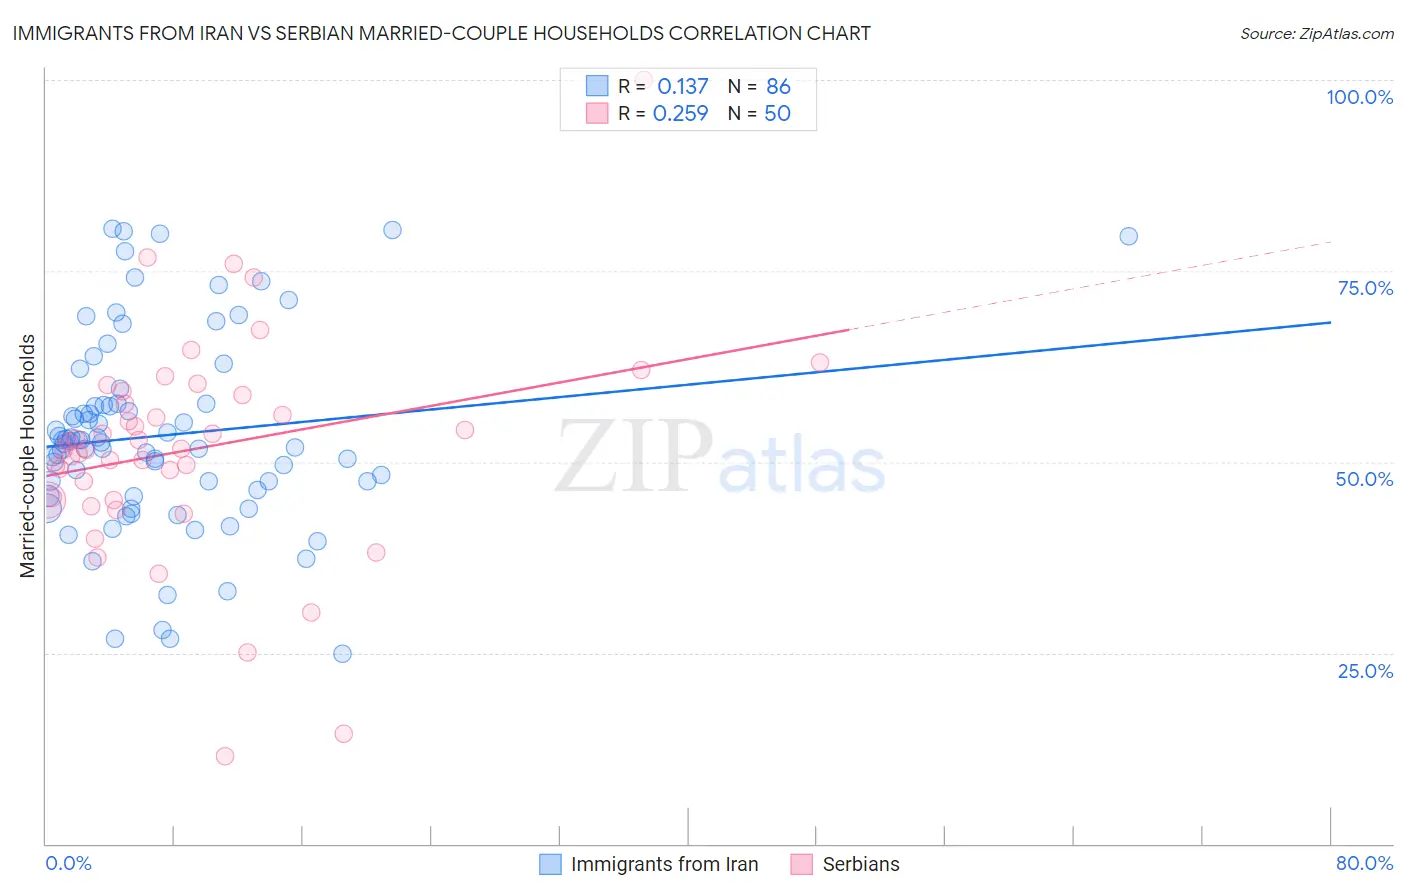
Immigrants from Iran vs Serbian Married-couple Households Correlation Chart

The statistical analysis conducted on geographies consisting of 279,826,479 people shows a poor positive correlation between the proportion of Immigrants from Iran and percentage of married-couple family households in the United States with a correlation coefficient (R) of 0.137 and weighted average of 48.8%. Similarly, the statistical analysis conducted on geographies consisting of 267,530,139 people shows a weak positive correlation between the proportion of Serbians and percentage of married-couple family households in the United States with a correlation coefficient (R) of 0.259 and weighted average of 47.0%, a difference of 3.9%.
Immigrants from Iran vs Serbian Married-couple Households

Married-couple Households Correlation Summary

MeasurementImmigrants from IranSerbian
Minimum24.8%11.4%
Maximum80.5%100.0%
Range55.7%88.6%
Mean53.5%51.7%
Median52.7%51.7%
Interquartile 25% (IQ1)46.2%45.0%
Interquartile 75% (IQ3)57.6%58.7%
Interquartile Range (IQR)11.3%13.7%
Standard Deviation (Sample)12.6%14.6%
Standard Deviation (Population)12.6%14.5%

Similar Demographics by Married-couple Households

Demographics Similar to Immigrants from Iran by Married-couple Households

In terms of married-couple households, the demographic groups most similar to Immigrants from Iran are Welsh (48.8%, a difference of 0.050%), Immigrants from Vietnam (48.8%, a difference of 0.060%), Immigrants from Eastern Asia (48.8%, a difference of 0.080%), Immigrants from Lebanon (48.9%, a difference of 0.10%), and Tsimshian (48.7%, a difference of 0.13%).
DemographicsRating | RankMarried-couple Households
Iranians
99.7
/100
|
#36
Exceptional
49.0%
Sri Lankans
99.7
/100
|
#37
Exceptional
49.0%
Greeks
99.7
/100
|
#38
Exceptional
48.9%
Lithuanians
99.6
/100
|
#39
Exceptional
48.9%
Immigrants | Bolivia
99.6
/100
|
#40
Exceptional
48.9%
Immigrants | Lebanon
99.6
/100
|
#41
Exceptional
48.9%
Immigrants | Vietnam
99.6
/100
|
#42
Exceptional
48.8%
Immigrants | Iran
99.6
/100
|
#43
Exceptional
48.8%
Welsh
99.5
/100
|
#44
Exceptional
48.8%
Immigrants | Eastern Asia
99.5
/100
|
#45
Exceptional
48.8%
Tsimshian
99.5
/100
|
#46
Exceptional
48.7%
British
99.5
/100
|
#47
Exceptional
48.7%
Indians (Asian)
99.4
/100
|
#48
Exceptional
48.7%
Immigrants | Sri Lanka
99.4
/100
|
#49
Exceptional
48.7%
Samoans
99.4
/100
|
#50
Exceptional
48.7%

Demographics Similar to Serbians by Married-couple Households

In terms of married-couple households, the demographic groups most similar to Serbians are Hmong (47.0%, a difference of 0.010%), Immigrants from Western Asia (46.9%, a difference of 0.010%), Immigrants from Bulgaria (47.0%, a difference of 0.020%), Arab (46.9%, a difference of 0.020%), and Armenian (46.9%, a difference of 0.050%).
DemographicsRating | RankMarried-couple Households
Slovenes
81.7
/100
|
#145
Excellent
47.1%
Immigrants | Western Europe
81.6
/100
|
#146
Excellent
47.1%
Immigrants | Syria
81.6
/100
|
#147
Excellent
47.1%
Icelanders
79.5
/100
|
#148
Good
47.0%
Paraguayans
78.7
/100
|
#149
Good
47.0%
Immigrants | Russia
77.6
/100
|
#150
Good
47.0%
Immigrants | Bulgaria
76.8
/100
|
#151
Good
47.0%
Serbians
76.3
/100
|
#152
Good
47.0%
Hmong
76.2
/100
|
#153
Good
47.0%
Immigrants | Western Asia
76.1
/100
|
#154
Good
46.9%
Arabs
76.0
/100
|
#155
Good
46.9%
Armenians
75.4
/100
|
#156
Good
46.9%
Immigrants | Oceania
74.8
/100
|
#157
Good
46.9%
Immigrants | Nonimmigrants
73.3
/100
|
#158
Good
46.9%
Osage
73.2
/100
|
#159
Good
46.9%