Argentinean vs Dutch Married-couple Households
COMPARE
Argentinean
Dutch
Married-couple Households
Married-couple Households Comparison
Argentineans
Dutch
47.5%
MARRIED-COUPLE HOUSEHOLDS
92.5/ 100
METRIC RATING
116th/ 347
METRIC RANK
49.5%
MARRIED-COUPLE HOUSEHOLDS
99.9/ 100
METRIC RATING
23rd/ 347
METRIC RANK
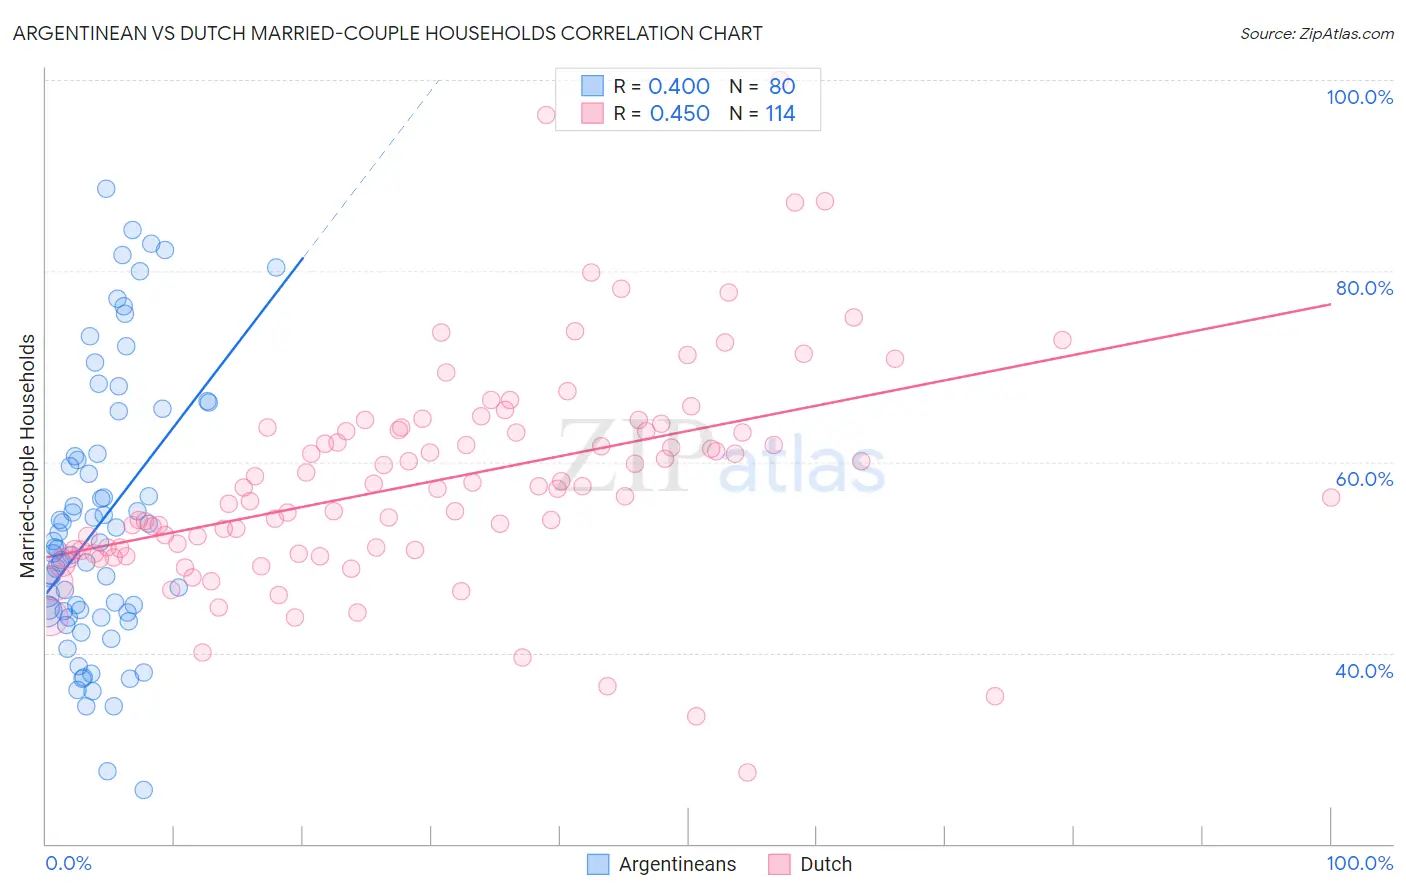
Argentinean vs Dutch Married-couple Households Correlation Chart
The statistical analysis conducted on geographies consisting of 296,995,795 people shows a mild positive correlation between the proportion of Argentineans and percentage of married-couple family households in the United States with a correlation coefficient (R) of 0.400 and weighted average of 47.5%. Similarly, the statistical analysis conducted on geographies consisting of 553,839,750 people shows a moderate positive correlation between the proportion of Dutch and percentage of married-couple family households in the United States with a correlation coefficient (R) of 0.450 and weighted average of 49.5%, a difference of 4.1%.
Married-couple Households Correlation Summary
| Measurement | Argentinean | Dutch |
| Minimum | 25.6% | 27.5% |
| Maximum | 88.5% | 100.0% |
| Range | 62.9% | 72.5% |
| Mean | 53.7% | 58.0% |
| Median | 51.0% | 57.3% |
| Interquartile 25% (IQ1) | 44.3% | 50.8% |
| Interquartile 75% (IQ3) | 60.7% | 63.3% |
| Interquartile Range (IQR) | 16.4% | 12.5% |
| Standard Deviation (Sample) | 14.3% | 11.6% |
| Standard Deviation (Population) | 14.2% | 11.5% |
Similar Demographics by Married-couple Households
Demographics Similar to Argentineans by Married-couple Households
In terms of married-couple households, the demographic groups most similar to Argentineans are French Canadian (47.5%, a difference of 0.010%), Immigrants from Germany (47.5%, a difference of 0.020%), Slovak (47.6%, a difference of 0.050%), Chilean (47.5%, a difference of 0.050%), and Immigrants from Europe (47.6%, a difference of 0.17%).
| Demographics | Rating | Rank | Married-couple Households |
| Immigrants | Jordan | 94.1 /100 | #109 | Exceptional 47.7% |
| Macedonians | 93.9 /100 | #110 | Exceptional 47.6% |
| Syrians | 93.9 /100 | #111 | Exceptional 47.6% |
| Peruvians | 93.8 /100 | #112 | Exceptional 47.6% |
| Venezuelans | 93.8 /100 | #113 | Exceptional 47.6% |
| Immigrants | Europe | 93.7 /100 | #114 | Exceptional 47.6% |
| Slovaks | 92.9 /100 | #115 | Exceptional 47.6% |
| Argentineans | 92.5 /100 | #116 | Exceptional 47.5% |
| French Canadians | 92.4 /100 | #117 | Exceptional 47.5% |
| Immigrants | Germany | 92.4 /100 | #118 | Exceptional 47.5% |
| Chileans | 92.2 /100 | #119 | Exceptional 47.5% |
| Puget Sound Salish | 90.5 /100 | #120 | Exceptional 47.4% |
| Immigrants | Eastern Europe | 90.3 /100 | #121 | Exceptional 47.4% |
| Okinawans | 90.1 /100 | #122 | Exceptional 47.4% |
| Immigrants | Venezuela | 89.3 /100 | #123 | Excellent 47.4% |
Demographics Similar to Dutch by Married-couple Households
In terms of married-couple households, the demographic groups most similar to Dutch are Asian (49.5%, a difference of 0.010%), Czech (49.4%, a difference of 0.080%), Norwegian (49.5%, a difference of 0.12%), European (49.6%, a difference of 0.18%), and Scandinavian (49.6%, a difference of 0.18%).
| Demographics | Rating | Rank | Married-couple Households |
| Swedes | 99.9 /100 | #16 | Exceptional 49.7% |
| Immigrants | Hong Kong | 99.9 /100 | #17 | Exceptional 49.6% |
| English | 99.9 /100 | #18 | Exceptional 49.6% |
| Europeans | 99.9 /100 | #19 | Exceptional 49.6% |
| Scandinavians | 99.9 /100 | #20 | Exceptional 49.6% |
| Norwegians | 99.9 /100 | #21 | Exceptional 49.5% |
| Asians | 99.9 /100 | #22 | Exceptional 49.5% |
| Dutch | 99.9 /100 | #23 | Exceptional 49.5% |
| Czechs | 99.9 /100 | #24 | Exceptional 49.4% |
| Immigrants | Philippines | 99.9 /100 | #25 | Exceptional 49.3% |
| Immigrants | Scotland | 99.8 /100 | #26 | Exceptional 49.3% |
| Bhutanese | 99.8 /100 | #27 | Exceptional 49.3% |
| Germans | 99.8 /100 | #28 | Exceptional 49.2% |
| Maltese | 99.8 /100 | #29 | Exceptional 49.2% |
| Bolivians | 99.8 /100 | #30 | Exceptional 49.2% |