Immigrants from Western Europe vs Immigrants from Kuwait Married-couple Households

COMPARE

Immigrants from Western Europe
Race
Ancestry
AfghanAfricanAlaska NativeAlaskan AthabascanAlbanianAleutAlsatianAmericanApacheArabArapahoArgentineanArmenianAssyrian/Chaldean/SyriacAustralianAustrianBahamianBangladeshiBarbadianBasqueBelgianBelizeanBermudanBhutaneseBlackfeetBolivianBrazilianBritishBritish West IndianBulgarianBurmeseCajunCambodianCanadianCape VerdeanCarpatho RusynCelticCentral AmericanCentral American IndianCherokeeCheyenneChickasawChileanChineseChippewaChoctawColombianColvilleComancheCosta RicanCreeCreekCroatianCrowCubanCypriotCzechCzechoslovakianDanishDelawareDominicanDutchDutch West IndianEastern EuropeanEcuadorianEgyptianEnglishEstonianEthiopianEuropeanFijianFilipinoFinnishFrenchFrench American IndianFrench CanadianGermanGerman RussianGhanaianGreekGuamanian/ChamorroGuatemalanGuyaneseHaitianHmongHonduranHopiHoumaHungarianIcelanderIndian (Asian)IndonesianInupiatIranianIraqiIrishIroquoisIsraeliItalianJamaicanJapaneseJordanianKenyanKiowaKoreanLaotianLatvianLebaneseLiberianLithuanianLumbeeLuxembourgerMacedonianMalaysianMalteseMarshalleseMenomineeMexicanMexican American IndianMongolianMoroccanNative HawaiianNavajoNepaleseNew ZealanderNicaraguanNigerianNorthern EuropeanNorwegianOkinawanOsageOttawaPaiutePakistaniPalestinianPanamanianParaguayanPennsylvania GermanPeruvianPimaPolishPortuguesePotawatomiPuebloPuerto RicanPuget Sound SalishRomanianRussianSalvadoranSamoanScandinavianScotch-IrishScottishSeminoleSenegaleseSerbianShoshoneSierra LeoneanSiouxSlavicSlovakSloveneSomaliSouth AfricanSouth AmericanSouth American IndianSoviet UnionSpaniardSpanishSpanish AmericanSpanish American IndianSri LankanSubsaharan AfricanSudaneseSwedishSwissSyrianTaiwaneseThaiTlingit-HaidaTohono O'OdhamTonganTrinidadian and TobagonianTsimshianTurkishU.S. Virgin IslanderUgandanUkrainianUruguayanUteVenezuelanVietnameseWelshWest IndianYakamaYaquiYugoslavianYumanYup'ikZimbabwean
Immigration
NonimmigrantsImmigrantsAfghanistanAfricaAlbaniaArgentinaArmeniaAsiaAustraliaAustriaBahamasBangladeshBarbadosBelarusBelgiumBelizeBoliviaBosnia and HerzegovinaBrazilBulgariaBurma/MyanmarCabo VerdeCambodiaCameroonCanadaCaribbeanCentral AmericaChileChinaColombiaCongoCosta RicaCroatiaCubaCzechoslovakiaDenmarkDominicaDominican RepublicEastern AfricaEastern AsiaEastern EuropeEcuadorEgyptEl SalvadorEnglandEritreaEthiopiaEuropeFijiFranceGermanyGhanaGreeceGrenadaGuatemalaGuyanaHaitiHondurasHong KongHungaryIndiaIndonesiaIranIraqIrelandIsraelItalyJamaicaJapanJordanKazakhstanKenyaKoreaLaosLatin AmericaLatviaLebanonLiberiaLithuaniaMalaysiaMexicoMicronesiaMiddle AfricaMoldovaMoroccoNepalNetherlandsNicaraguaNigeriaNorth AmericaNorth MacedoniaNorthern AfricaNorthern EuropeNorwayOceaniaPakistanPanamaPeruPhilippinesPolandPortugalRomaniaRussiaSaudi ArabiaScotlandSenegalSerbiaSierra LeoneSingaporeSomaliaSouth AfricaSouth AmericaSouth Central AsiaSouth Eastern AsiaSouthern EuropeSpainSri LankaSt. Vincent and the GrenadinesSudanSwedenSwitzerlandSyriaTaiwanThailandTrinidad and TobagoTurkeyUgandaUkraineUruguayUzbekistanVenezuelaVietnamWest IndiesWestern AfricaWestern AsiaWestern EuropeYemenZaireZimbabweAzores
Immigrants from Kuwait
Race
Ancestry
AfghanAfricanAlaska NativeAlaskan AthabascanAlbanianAleutAlsatianAmericanApacheArabArapahoArgentineanArmenianAssyrian/Chaldean/SyriacAustralianAustrianBahamianBangladeshiBarbadianBasqueBelgianBelizeanBermudanBhutaneseBlackfeetBolivianBrazilianBritishBritish West IndianBulgarianBurmeseCajunCambodianCanadianCape VerdeanCarpatho RusynCelticCentral AmericanCentral American IndianCherokeeCheyenneChickasawChileanChineseChippewaChoctawColombianColvilleComancheCosta RicanCreeCreekCroatianCrowCubanCypriotCzechCzechoslovakianDanishDelawareDominicanDutchDutch West IndianEastern EuropeanEcuadorianEgyptianEnglishEstonianEthiopianEuropeanFijianFilipinoFinnishFrenchFrench American IndianFrench CanadianGermanGerman RussianGhanaianGreekGuamanian/ChamorroGuatemalanGuyaneseHaitianHmongHonduranHopiHoumaHungarianIcelanderIndian (Asian)IndonesianInupiatIranianIraqiIrishIroquoisIsraeliItalianJamaicanJapaneseJordanianKenyanKiowaKoreanLaotianLatvianLebaneseLiberianLithuanianLumbeeLuxembourgerMacedonianMalaysianMalteseMarshalleseMenomineeMexicanMexican American IndianMongolianMoroccanNative HawaiianNavajoNepaleseNew ZealanderNicaraguanNigerianNorthern EuropeanNorwegianOkinawanOsageOttawaPaiutePakistaniPalestinianPanamanianParaguayanPennsylvania GermanPeruvianPimaPolishPortuguesePotawatomiPuebloPuerto RicanPuget Sound SalishRomanianRussianSalvadoranSamoanScandinavianScotch-IrishScottishSeminoleSenegaleseSerbianShoshoneSierra LeoneanSiouxSlavicSlovakSloveneSomaliSouth AfricanSouth AmericanSouth American IndianSoviet UnionSpaniardSpanishSpanish AmericanSpanish American IndianSri LankanSubsaharan AfricanSudaneseSwedishSwissSyrianTaiwaneseThaiTlingit-HaidaTohono O'OdhamTonganTrinidadian and TobagonianTsimshianTurkishU.S. Virgin IslanderUgandanUkrainianUruguayanUteVenezuelanVietnameseWelshWest IndianYakamaYaquiYugoslavianYumanYup'ikZimbabwean
Immigration
NonimmigrantsImmigrantsAfghanistanAfricaAlbaniaArgentinaArmeniaAsiaAustraliaAustriaBahamasBangladeshBarbadosBelarusBelgiumBelizeBoliviaBosnia and HerzegovinaBrazilBulgariaBurma/MyanmarCabo VerdeCambodiaCameroonCanadaCaribbeanCentral AmericaChileChinaColombiaCongoCosta RicaCroatiaCubaCzechoslovakiaDenmarkDominicaDominican RepublicEastern AfricaEastern AsiaEastern EuropeEcuadorEgyptEl SalvadorEnglandEritreaEthiopiaEuropeFijiFranceGermanyGhanaGreeceGrenadaGuatemalaGuyanaHaitiHondurasHong KongHungaryIndiaIndonesiaIranIraqIrelandIsraelItalyJamaicaJapanJordanKazakhstanKenyaKoreaKuwaitLaosLatin AmericaLatviaLebanonLiberiaLithuaniaMalaysiaMexicoMicronesiaMiddle AfricaMoldovaMoroccoNepalNetherlandsNicaraguaNigeriaNorth AmericaNorth MacedoniaNorthern AfricaNorthern EuropeNorwayOceaniaPakistanPanamaPeruPhilippinesPolandPortugalRomaniaRussiaSaudi ArabiaScotlandSenegalSerbiaSierra LeoneSingaporeSomaliaSouth AfricaSouth AmericaSouth Central AsiaSouth Eastern AsiaSouthern EuropeSpainSri LankaSt. Vincent and the GrenadinesSudanSwedenSwitzerlandSyriaTaiwanThailandTrinidad and TobagoTurkeyUgandaUkraineUruguayUzbekistanVenezuelaVietnamWest IndiesWestern AfricaWestern AsiaYemenZaireZimbabweAzores
Married-couple Households
Income
Poverty
Unemployment
Labor Participation
Family Structure
Vehicle Availability
Education Level
Disability

Married-couple Households Comparison

Immigrants from Western Europe

Immigrants from Kuwait

Excellent
Fair
47.1%
MARRIED-COUPLE HOUSEHOLDS
81.6/ 100
METRIC RATING
146th/ 347
METRIC RANK
46.0%
MARRIED-COUPLE HOUSEHOLDS
25.6/ 100
METRIC RATING
190th/ 347
METRIC RANK

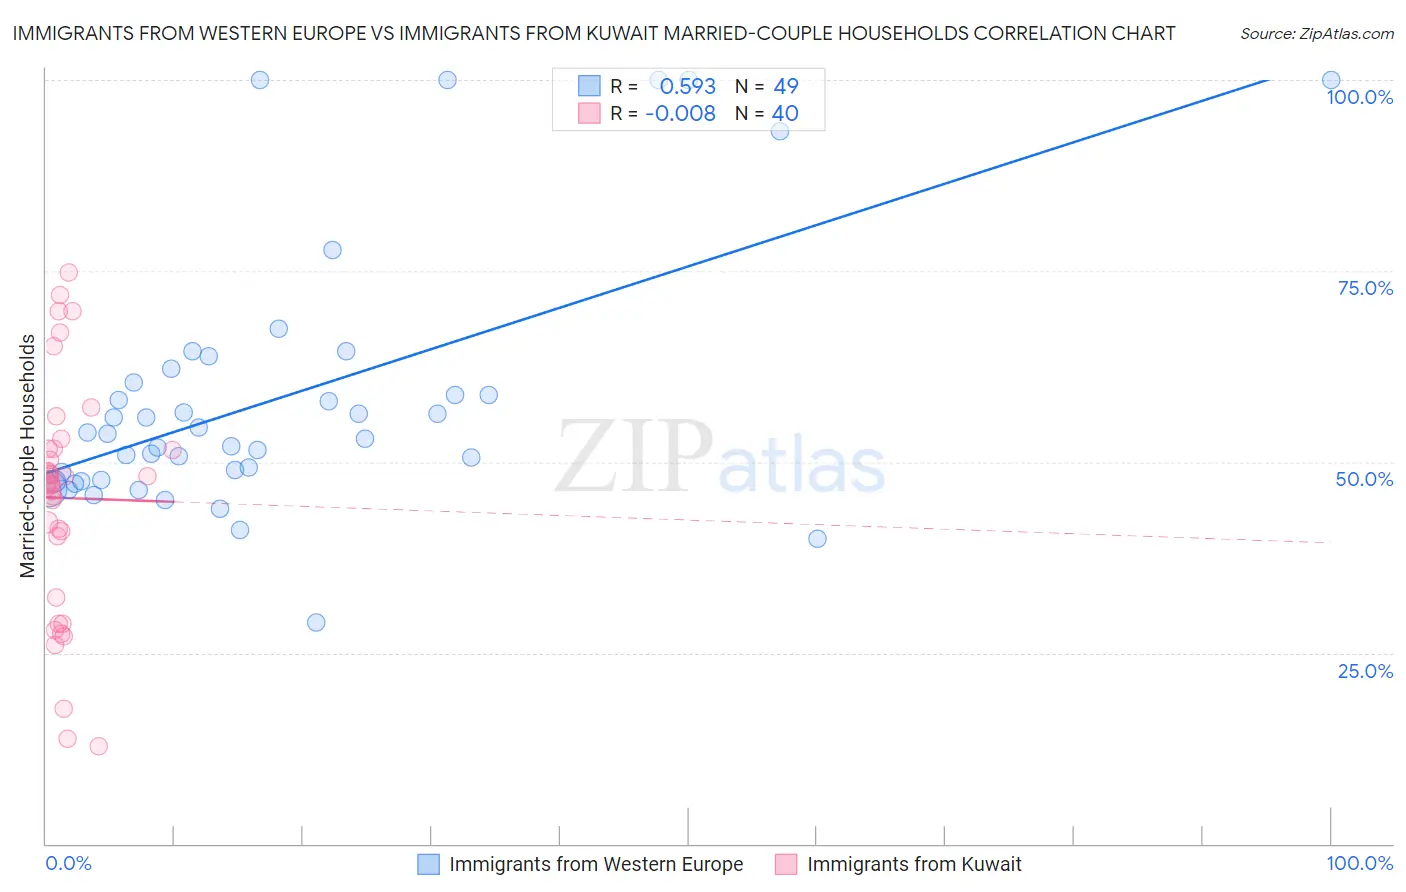
Immigrants from Western Europe vs Immigrants from Kuwait Married-couple Households Correlation Chart

The statistical analysis conducted on geographies consisting of 493,807,996 people shows a substantial positive correlation between the proportion of Immigrants from Western Europe and percentage of married-couple family households in the United States with a correlation coefficient (R) of 0.593 and weighted average of 47.1%. Similarly, the statistical analysis conducted on geographies consisting of 136,888,250 people shows no correlation between the proportion of Immigrants from Kuwait and percentage of married-couple family households in the United States with a correlation coefficient (R) of -0.008 and weighted average of 46.0%, a difference of 2.4%.
Immigrants from Western Europe vs Immigrants from Kuwait Married-couple Households

Married-couple Households Correlation Summary

MeasurementImmigrants from Western EuropeImmigrants from Kuwait
Minimum29.0%12.7%
Maximum100.0%74.9%
Range71.0%62.1%
Mean58.4%45.3%
Median53.7%47.2%
Interquartile 25% (IQ1)47.6%36.3%
Interquartile 75% (IQ3)61.3%51.7%
Interquartile Range (IQR)13.7%15.5%
Standard Deviation (Sample)17.2%15.3%
Standard Deviation (Population)17.0%15.1%

Similar Demographics by Married-couple Households

Demographics Similar to Immigrants from Western Europe by Married-couple Households

In terms of married-couple households, the demographic groups most similar to Immigrants from Western Europe are Slovene (47.1%, a difference of 0.0%), Immigrants from Syria (47.1%, a difference of 0.0%), Mexican (47.1%, a difference of 0.12%), Icelander (47.0%, a difference of 0.13%), and Immigrants from Belarus (47.2%, a difference of 0.14%).
DemographicsRating | RankMarried-couple Households
Immigrants | Sweden
84.7
/100
|
#139
Excellent
47.2%
Spanish
84.5
/100
|
#140
Excellent
47.2%
Costa Ricans
84.4
/100
|
#141
Excellent
47.2%
Spaniards
84.1
/100
|
#142
Excellent
47.2%
Immigrants | Belarus
83.8
/100
|
#143
Excellent
47.2%
Mexicans
83.4
/100
|
#144
Excellent
47.1%
Slovenes
81.7
/100
|
#145
Excellent
47.1%
Immigrants | Western Europe
81.6
/100
|
#146
Excellent
47.1%
Immigrants | Syria
81.6
/100
|
#147
Excellent
47.1%
Icelanders
79.5
/100
|
#148
Good
47.0%
Paraguayans
78.7
/100
|
#149
Good
47.0%
Immigrants | Russia
77.6
/100
|
#150
Good
47.0%
Immigrants | Bulgaria
76.8
/100
|
#151
Good
47.0%
Serbians
76.3
/100
|
#152
Good
47.0%
Hmong
76.2
/100
|
#153
Good
47.0%

Demographics Similar to Immigrants from Kuwait by Married-couple Households

In terms of married-couple households, the demographic groups most similar to Immigrants from Kuwait are Choctaw (46.0%, a difference of 0.030%), Immigrants from Northern Africa (46.0%, a difference of 0.050%), Immigrants from Latvia (46.0%, a difference of 0.060%), Taiwanese (45.9%, a difference of 0.11%), and Mexican American Indian (45.9%, a difference of 0.12%).
DemographicsRating | RankMarried-couple Households
Immigrants | Brazil
38.3
/100
|
#183
Fair
46.2%
Immigrants | Switzerland
36.9
/100
|
#184
Fair
46.2%
Brazilians
35.9
/100
|
#185
Fair
46.2%
Albanians
31.1
/100
|
#186
Fair
46.1%
Fijians
29.2
/100
|
#187
Fair
46.1%
South American Indians
28.4
/100
|
#188
Fair
46.0%
Immigrants | Latvia
26.9
/100
|
#189
Fair
46.0%
Immigrants | Kuwait
25.6
/100
|
#190
Fair
46.0%
Choctaw
24.9
/100
|
#191
Fair
46.0%
Immigrants | Northern Africa
24.6
/100
|
#192
Fair
46.0%
Taiwanese
23.4
/100
|
#193
Fair
45.9%
Mexican American Indians
23.3
/100
|
#194
Fair
45.9%
Chickasaw
22.7
/100
|
#195
Fair
45.9%
Immigrants | South America
22.2
/100
|
#196
Fair
45.9%
Cambodians
21.3
/100
|
#197
Fair
45.9%