Immigrants from Northern Africa vs Immigrants from Jordan Married-couple Households
COMPARE
Immigrants from Northern Africa
Immigrants from Jordan
Married-couple Households
Married-couple Households Comparison
Immigrants from Northern Africa
Immigrants from Jordan
46.0%
MARRIED-COUPLE HOUSEHOLDS
24.6/ 100
METRIC RATING
192nd/ 347
METRIC RANK
47.7%
MARRIED-COUPLE HOUSEHOLDS
94.1/ 100
METRIC RATING
109th/ 347
METRIC RANK
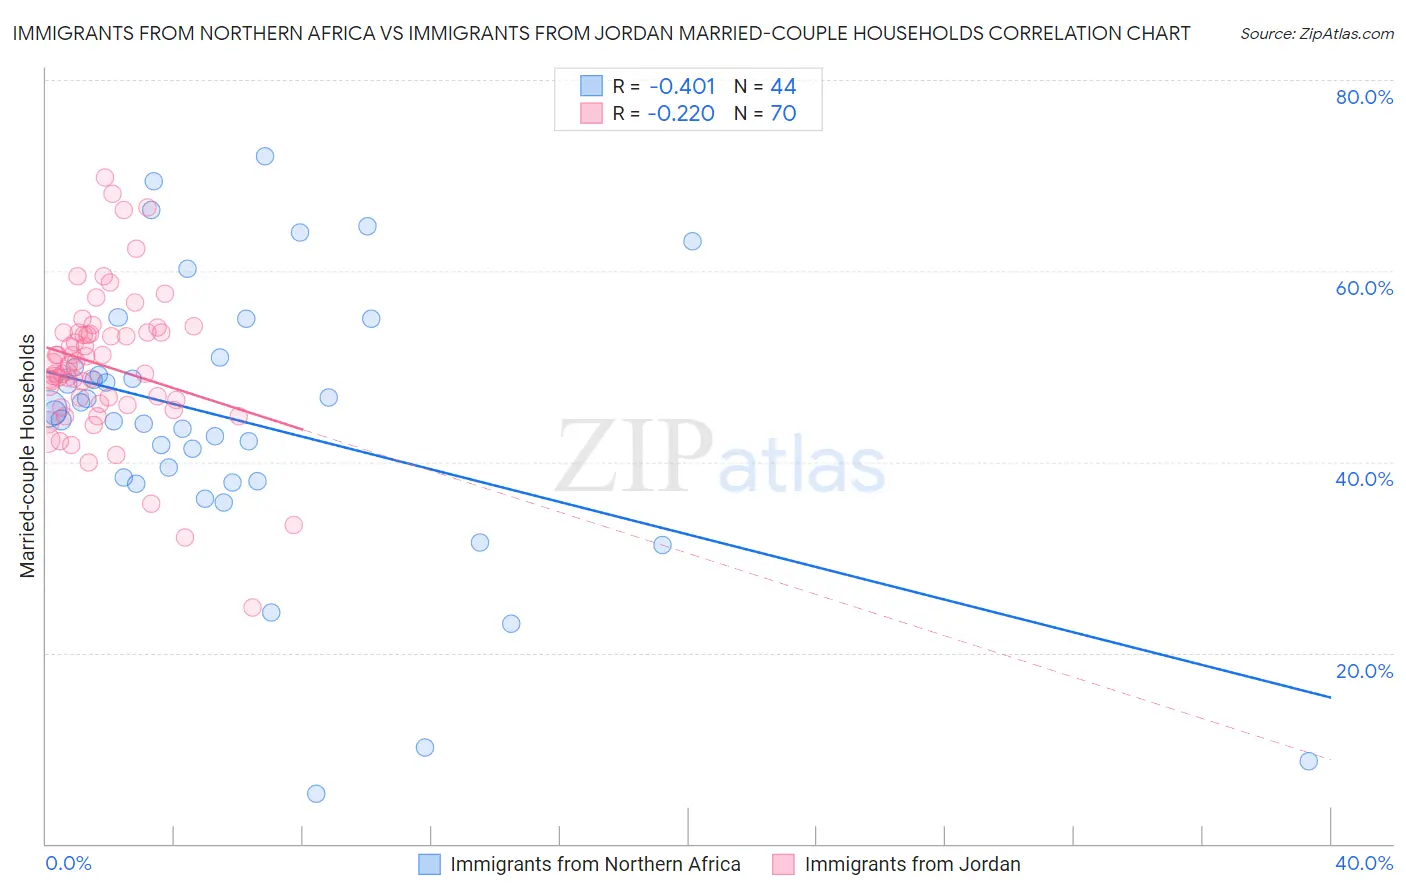
Immigrants from Northern Africa vs Immigrants from Jordan Married-couple Households Correlation Chart
The statistical analysis conducted on geographies consisting of 321,083,250 people shows a moderate negative correlation between the proportion of Immigrants from Northern Africa and percentage of married-couple family households in the United States with a correlation coefficient (R) of -0.401 and weighted average of 46.0%. Similarly, the statistical analysis conducted on geographies consisting of 181,252,999 people shows a weak negative correlation between the proportion of Immigrants from Jordan and percentage of married-couple family households in the United States with a correlation coefficient (R) of -0.220 and weighted average of 47.7%, a difference of 3.7%.
Married-couple Households Correlation Summary
| Measurement | Immigrants from Northern Africa | Immigrants from Jordan |
| Minimum | 5.3% | 24.7% |
| Maximum | 72.0% | 69.8% |
| Range | 66.8% | 45.1% |
| Mean | 44.1% | 50.1% |
| Median | 44.8% | 49.9% |
| Interquartile 25% (IQ1) | 37.9% | 46.0% |
| Interquartile 75% (IQ3) | 50.5% | 53.6% |
| Interquartile Range (IQR) | 12.6% | 7.5% |
| Standard Deviation (Sample) | 14.7% | 7.7% |
| Standard Deviation (Population) | 14.6% | 7.7% |
Similar Demographics by Married-couple Households
Demographics Similar to Immigrants from Northern Africa by Married-couple Households
In terms of married-couple households, the demographic groups most similar to Immigrants from Northern Africa are Choctaw (46.0%, a difference of 0.020%), Immigrants from Kuwait (46.0%, a difference of 0.050%), Taiwanese (45.9%, a difference of 0.060%), Mexican American Indian (45.9%, a difference of 0.070%), and Chickasaw (45.9%, a difference of 0.10%).
| Demographics | Rating | Rank | Married-couple Households |
| Brazilians | 35.9 /100 | #185 | Fair 46.2% |
| Albanians | 31.1 /100 | #186 | Fair 46.1% |
| Fijians | 29.2 /100 | #187 | Fair 46.1% |
| South American Indians | 28.4 /100 | #188 | Fair 46.0% |
| Immigrants | Latvia | 26.9 /100 | #189 | Fair 46.0% |
| Immigrants | Kuwait | 25.6 /100 | #190 | Fair 46.0% |
| Choctaw | 24.9 /100 | #191 | Fair 46.0% |
| Immigrants | Northern Africa | 24.6 /100 | #192 | Fair 46.0% |
| Taiwanese | 23.4 /100 | #193 | Fair 45.9% |
| Mexican American Indians | 23.3 /100 | #194 | Fair 45.9% |
| Chickasaw | 22.7 /100 | #195 | Fair 45.9% |
| Immigrants | South America | 22.2 /100 | #196 | Fair 45.9% |
| Cambodians | 21.3 /100 | #197 | Fair 45.9% |
| Ottawa | 19.4 /100 | #198 | Poor 45.8% |
| Carpatho Rusyns | 15.7 /100 | #199 | Poor 45.7% |
Demographics Similar to Immigrants from Jordan by Married-couple Households
In terms of married-couple households, the demographic groups most similar to Immigrants from Jordan are Macedonian (47.6%, a difference of 0.020%), Syrian (47.6%, a difference of 0.030%), Peruvian (47.6%, a difference of 0.040%), Immigrants from Japan (47.7%, a difference of 0.050%), and Venezuelan (47.6%, a difference of 0.050%).
| Demographics | Rating | Rank | Married-couple Households |
| Slavs | 96.0 /100 | #102 | Exceptional 47.8% |
| Hawaiians | 96.0 /100 | #103 | Exceptional 47.8% |
| Immigrants | South Africa | 96.0 /100 | #104 | Exceptional 47.8% |
| Immigrants | Czechoslovakia | 95.5 /100 | #105 | Exceptional 47.8% |
| Portuguese | 95.5 /100 | #106 | Exceptional 47.8% |
| Estonians | 94.7 /100 | #107 | Exceptional 47.7% |
| Immigrants | Japan | 94.4 /100 | #108 | Exceptional 47.7% |
| Immigrants | Jordan | 94.1 /100 | #109 | Exceptional 47.7% |
| Macedonians | 93.9 /100 | #110 | Exceptional 47.6% |
| Syrians | 93.9 /100 | #111 | Exceptional 47.6% |
| Peruvians | 93.8 /100 | #112 | Exceptional 47.6% |
| Venezuelans | 93.8 /100 | #113 | Exceptional 47.6% |
| Immigrants | Europe | 93.7 /100 | #114 | Exceptional 47.6% |
| Slovaks | 92.9 /100 | #115 | Exceptional 47.6% |
| Argentineans | 92.5 /100 | #116 | Exceptional 47.5% |