Crow Female Disability
COMPARE
Crow
Select to Compare
Female Disability
Crow Female Disability
12.7%
DISABILITY | FEMALES
1.6/ 100
METRIC RATING
251st/ 347
METRIC RANK
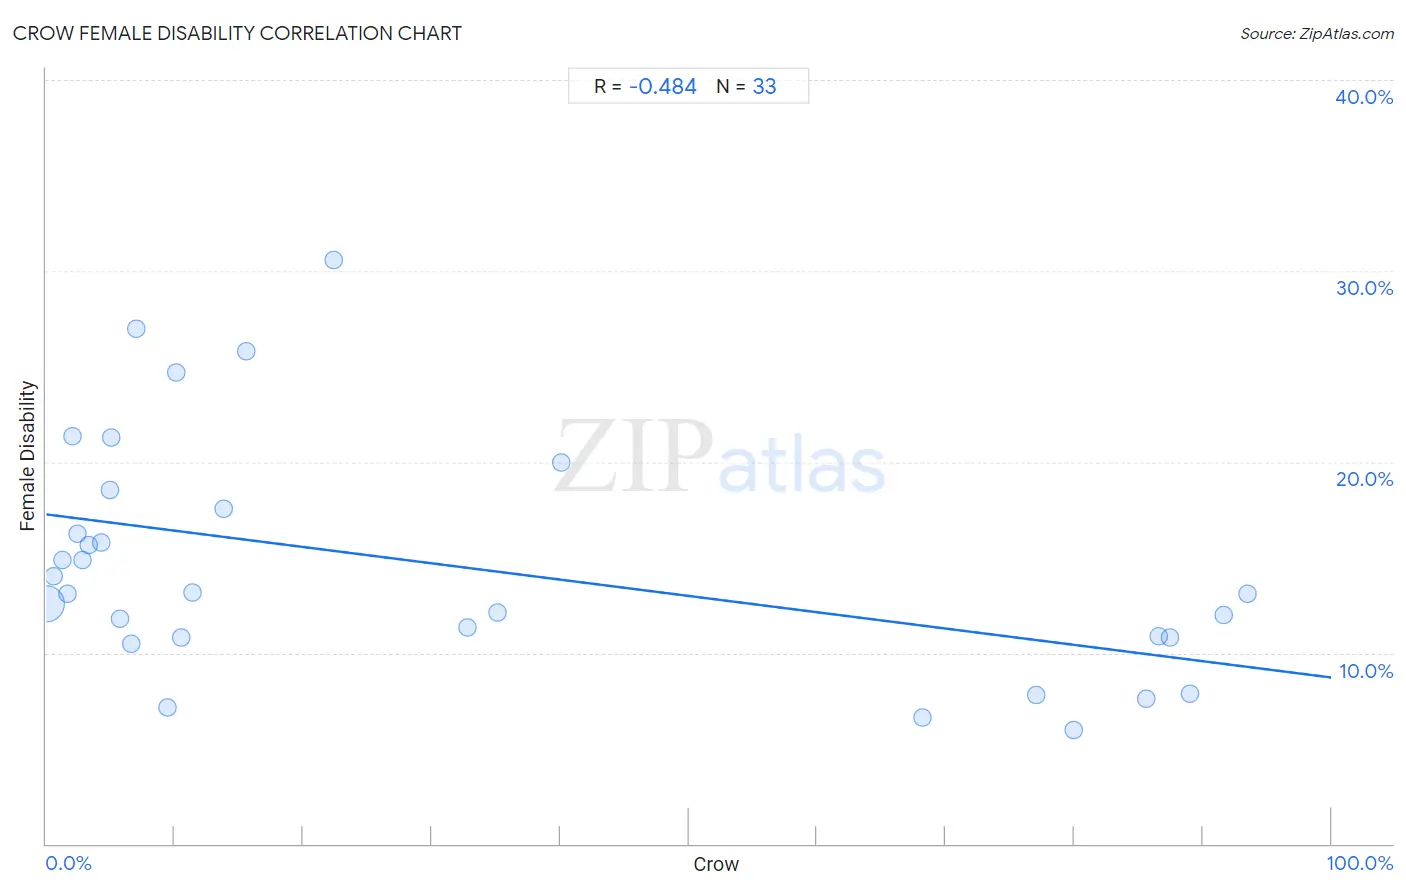
Crow Female Disability Correlation Chart
The statistical analysis conducted on geographies consisting of 59,203,851 people shows a moderate negative correlation between the proportion of Crow and percentage of females with a disability in the United States with a correlation coefficient (R) of -0.484 and weighted average of 12.7%. On average, for every 1% (one percent) increase in Crow within a typical geography, there is a decrease of 0.085% in percentage of females with a disability.
It is essential to understand that the correlation between the percentage of Crow and percentage of females with a disability does not imply a direct cause-and-effect relationship. It remains uncertain whether the presence of Crow influences an upward or downward trend in the level of percentage of females with a disability within an area, or if Crow simply ended up residing in those areas with higher or lower levels of percentage of females with a disability due to other factors.
Demographics Similar to Crow by Female Disability
In terms of female disability, the demographic groups most similar to Crow are Slovene (12.7%, a difference of 0.060%), Immigrants from Caribbean (12.7%, a difference of 0.080%), Jamaican (12.7%, a difference of 0.090%), Immigrants from Congo (12.7%, a difference of 0.10%), and Hawaiian (12.7%, a difference of 0.12%).
| Demographics | Rating | Rank | Female Disability |
| Alsatians | 2.5 /100 | #244 | Tragic 12.6% |
| Immigrants from Jamaica | 2.2 /100 | #245 | Tragic 12.6% |
| Spanish American Indians | 2.1 /100 | #246 | Tragic 12.6% |
| Menominee | 2.1 /100 | #247 | Tragic 12.6% |
| Carpatho Rusyns | 2.0 /100 | #248 | Tragic 12.6% |
| Immigrants from Congo | 1.8 /100 | #249 | Tragic 12.7% |
| Slovenes | 1.7 /100 | #250 | Tragic 12.7% |
| Crow | 1.6 /100 | #251 | Tragic 12.7% |
| Immigrants from Caribbean | 1.4 /100 | #252 | Tragic 12.7% |
| Jamaicans | 1.4 /100 | #253 | Tragic 12.7% |
| Hawaiians | 1.4 /100 | #254 | Tragic 12.7% |
| Immigrants from Germany | 1.3 /100 | #255 | Tragic 12.7% |
| British West Indians | 1.2 /100 | #256 | Tragic 12.7% |
| Liberians | 1.1 /100 | #257 | Tragic 12.7% |
| Aleuts | 1.1 /100 | #258 | Tragic 12.7% |
Crow Female Disability Correlation Summary
| Measurement | Crow Data | Female Disability Data |
| Minimum | 0.023% | 5.9% |
| Maximum | 93.4% | 30.6% |
| Range | 93.4% | 24.7% |
| Mean | 30.5% | 14.6% |
| Median | 10.5% | 13.1% |
| Interquartile 25% (IQ1) | 3.8% | 10.8% |
| Interquartile 75% (IQ3) | 72.7% | 18.0% |
| Interquartile Range (IQR) | 68.9% | 7.2% |
| Standard Deviation (Sample) | 35.0% | 6.2% |
| Standard Deviation (Population) | 34.5% | 6.1% |
Correlation Details
| Crow Percentile | Sample Size | Female Disability |
[ 0.0% - 0.5% ] 0.023% | 58,539,702 | 12.6% |
[ 0.5% - 1.0% ] 0.59% | 294,827 | 14.0% |
[ 1.0% - 1.5% ] 1.26% | 166,103 | 14.9% |
[ 1.5% - 2.0% ] 1.61% | 93,100 | 13.1% |
[ 2.0% - 2.5% ] 2.07% | 7,192 | 21.4% |
[ 2.0% - 2.5% ] 2.45% | 49,253 | 16.2% |
[ 2.5% - 3.0% ] 2.87% | 2,129 | 14.9% |
[ 3.0% - 3.5% ] 3.26% | 11,598 | 15.7% |
[ 4.0% - 4.5% ] 4.26% | 1,128 | 15.8% |
[ 4.5% - 5.0% ] 4.97% | 5,276 | 18.5% |
[ 5.0% - 5.5% ] 5.10% | 1,019 | 21.3% |
[ 5.5% - 6.0% ] 5.79% | 1,953 | 11.8% |
[ 6.5% - 7.0% ] 6.61% | 4,223 | 10.5% |
[ 7.0% - 7.5% ] 7.01% | 785 | 26.9% |
[ 9.0% - 9.5% ] 9.45% | 2,064 | 7.1% |
[ 10.0% - 10.5% ] 10.08% | 2,817 | 24.7% |
[ 10.5% - 11.0% ] 10.53% | 190 | 10.8% |
[ 11.0% - 11.5% ] 11.36% | 176 | 13.2% |
[ 13.5% - 14.0% ] 13.79% | 428 | 17.5% |
[ 15.5% - 16.0% ] 15.56% | 1,125 | 25.8% |
[ 22.0% - 22.5% ] 22.35% | 783 | 30.6% |
[ 32.5% - 33.0% ] 32.74% | 3,803 | 11.3% |
[ 35.0% - 35.5% ] 35.12% | 5,199 | 12.1% |
[ 40.0% - 40.5% ] 40.12% | 172 | 20.0% |
[ 68.0% - 68.5% ] 68.23% | 576 | 6.6% |
[ 77.0% - 77.5% ] 77.09% | 1,602 | 7.8% |
[ 79.5% - 80.0% ] 79.96% | 459 | 5.9% |
[ 85.5% - 86.0% ] 85.61% | 660 | 7.6% |
[ 86.5% - 87.0% ] 86.61% | 2,180 | 10.9% |
[ 87.0% - 87.5% ] 87.40% | 262 | 10.8% |
[ 89.0% - 89.5% ] 89.03% | 629 | 7.8% |
[ 91.5% - 92.0% ] 91.65% | 1,965 | 12.0% |
[ 93.0% - 93.5% ] 93.45% | 473 | 13.1% |