Crow vs Immigrants from South America Married-couple Households
COMPARE
Crow
Immigrants from South America
Married-couple Households
Married-couple Households Comparison
Crow
Immigrants from South America
41.4%
MARRIED-COUPLE HOUSEHOLDS
0.0/ 100
METRIC RATING
308th/ 347
METRIC RANK
45.9%
MARRIED-COUPLE HOUSEHOLDS
22.2/ 100
METRIC RATING
196th/ 347
METRIC RANK
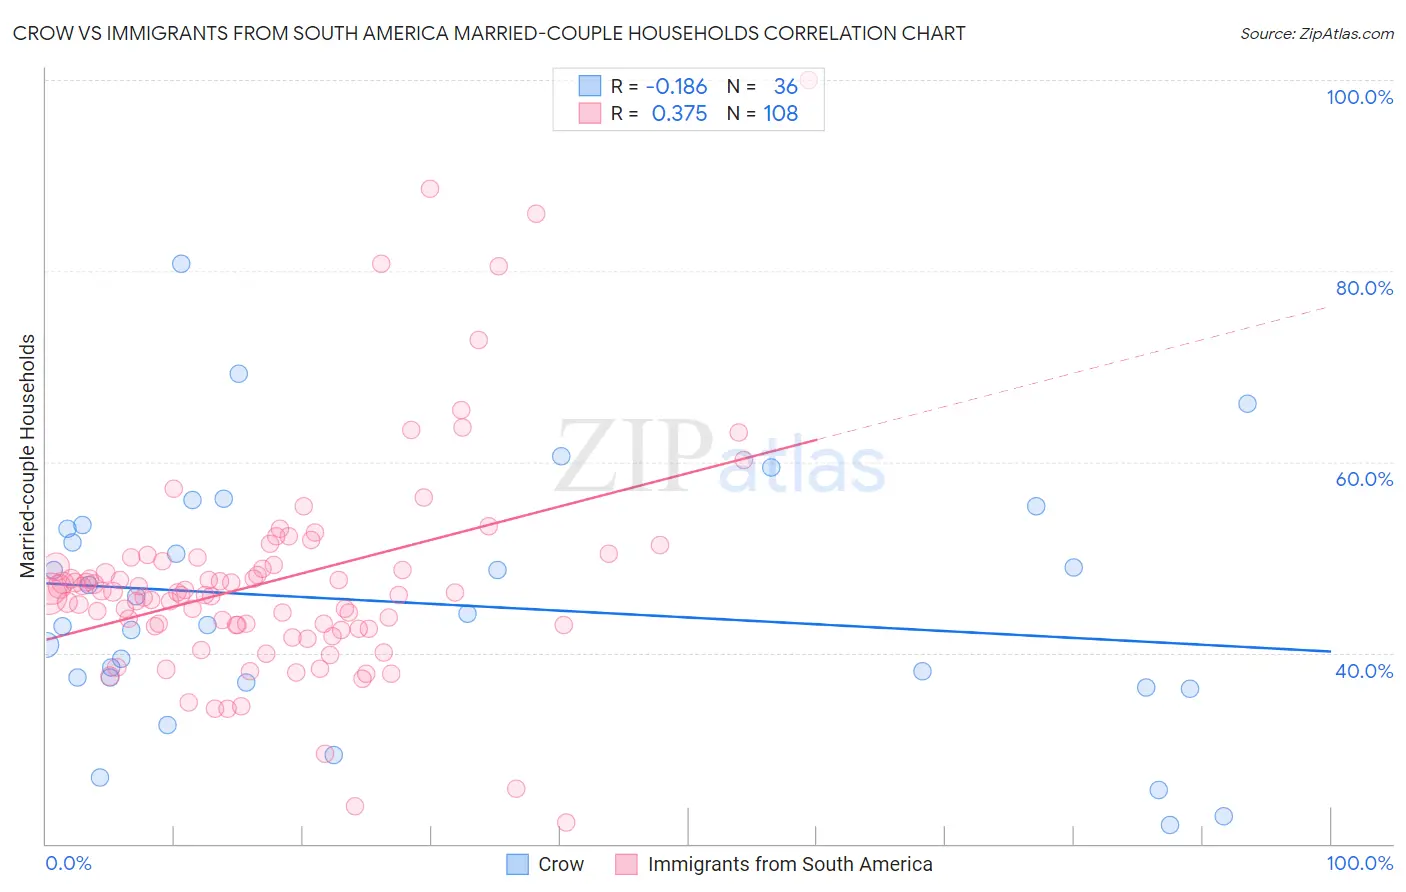
Crow vs Immigrants from South America Married-couple Households Correlation Chart
The statistical analysis conducted on geographies consisting of 59,202,817 people shows a poor negative correlation between the proportion of Crow and percentage of married-couple family households in the United States with a correlation coefficient (R) of -0.186 and weighted average of 41.4%. Similarly, the statistical analysis conducted on geographies consisting of 486,013,684 people shows a mild positive correlation between the proportion of Immigrants from South America and percentage of married-couple family households in the United States with a correlation coefficient (R) of 0.375 and weighted average of 45.9%, a difference of 11.0%.
Married-couple Households Correlation Summary
| Measurement | Crow | Immigrants from South America |
| Minimum | 21.9% | 22.2% |
| Maximum | 80.8% | 100.0% |
| Range | 58.9% | 77.8% |
| Mean | 45.1% | 47.6% |
| Median | 43.5% | 46.2% |
| Interquartile 25% (IQ1) | 37.1% | 42.7% |
| Interquartile 75% (IQ3) | 53.2% | 49.4% |
| Interquartile Range (IQR) | 16.0% | 6.7% |
| Standard Deviation (Sample) | 13.1% | 11.7% |
| Standard Deviation (Population) | 12.9% | 11.6% |
Similar Demographics by Married-couple Households
Demographics Similar to Crow by Married-couple Households
In terms of married-couple households, the demographic groups most similar to Crow are Guyanese (41.4%, a difference of 0.010%), Immigrants from Western Africa (41.4%, a difference of 0.010%), Immigrants from Trinidad and Tobago (41.2%, a difference of 0.35%), Sioux (41.5%, a difference of 0.38%), and Haitian (41.2%, a difference of 0.42%).
| Demographics | Rating | Rank | Married-couple Households |
| Immigrants | Bahamas | 0.0 /100 | #301 | Tragic 41.7% |
| Immigrants | Honduras | 0.0 /100 | #302 | Tragic 41.6% |
| Sub-Saharan Africans | 0.0 /100 | #303 | Tragic 41.6% |
| Immigrants | Guyana | 0.0 /100 | #304 | Tragic 41.6% |
| Sioux | 0.0 /100 | #305 | Tragic 41.5% |
| Guyanese | 0.0 /100 | #306 | Tragic 41.4% |
| Immigrants | Western Africa | 0.0 /100 | #307 | Tragic 41.4% |
| Crow | 0.0 /100 | #308 | Tragic 41.4% |
| Immigrants | Trinidad and Tobago | 0.0 /100 | #309 | Tragic 41.2% |
| Haitians | 0.0 /100 | #310 | Tragic 41.2% |
| Colville | 0.0 /100 | #311 | Tragic 41.0% |
| Africans | 0.0 /100 | #312 | Tragic 40.9% |
| Immigrants | Haiti | 0.0 /100 | #313 | Tragic 40.9% |
| Jamaicans | 0.0 /100 | #314 | Tragic 40.9% |
| Trinidadians and Tobagonians | 0.0 /100 | #315 | Tragic 40.9% |
Demographics Similar to Immigrants from South America by Married-couple Households
In terms of married-couple households, the demographic groups most similar to Immigrants from South America are Chickasaw (45.9%, a difference of 0.030%), Cambodian (45.9%, a difference of 0.050%), Mexican American Indian (45.9%, a difference of 0.060%), Taiwanese (45.9%, a difference of 0.070%), and Immigrants from Northern Africa (46.0%, a difference of 0.13%).
| Demographics | Rating | Rank | Married-couple Households |
| Immigrants | Latvia | 26.9 /100 | #189 | Fair 46.0% |
| Immigrants | Kuwait | 25.6 /100 | #190 | Fair 46.0% |
| Choctaw | 24.9 /100 | #191 | Fair 46.0% |
| Immigrants | Northern Africa | 24.6 /100 | #192 | Fair 46.0% |
| Taiwanese | 23.4 /100 | #193 | Fair 45.9% |
| Mexican American Indians | 23.3 /100 | #194 | Fair 45.9% |
| Chickasaw | 22.7 /100 | #195 | Fair 45.9% |
| Immigrants | South America | 22.2 /100 | #196 | Fair 45.9% |
| Cambodians | 21.3 /100 | #197 | Fair 45.9% |
| Ottawa | 19.4 /100 | #198 | Poor 45.8% |
| Carpatho Rusyns | 15.7 /100 | #199 | Poor 45.7% |
| Potawatomi | 15.6 /100 | #200 | Poor 45.7% |
| Immigrants | Serbia | 15.2 /100 | #201 | Poor 45.7% |
| Immigrants | Central America | 14.2 /100 | #202 | Poor 45.7% |
| Alaska Natives | 13.0 /100 | #203 | Poor 45.6% |