Okinawan vs Trinidadian and Tobagonian Married-couple Households
COMPARE
Okinawan
Trinidadian and Tobagonian
Married-couple Households
Married-couple Households Comparison
Okinawans
Trinidadians and Tobagonians
47.4%
MARRIED-COUPLE HOUSEHOLDS
90.1/ 100
METRIC RATING
122nd/ 347
METRIC RANK
40.9%
MARRIED-COUPLE HOUSEHOLDS
0.0/ 100
METRIC RATING
315th/ 347
METRIC RANK
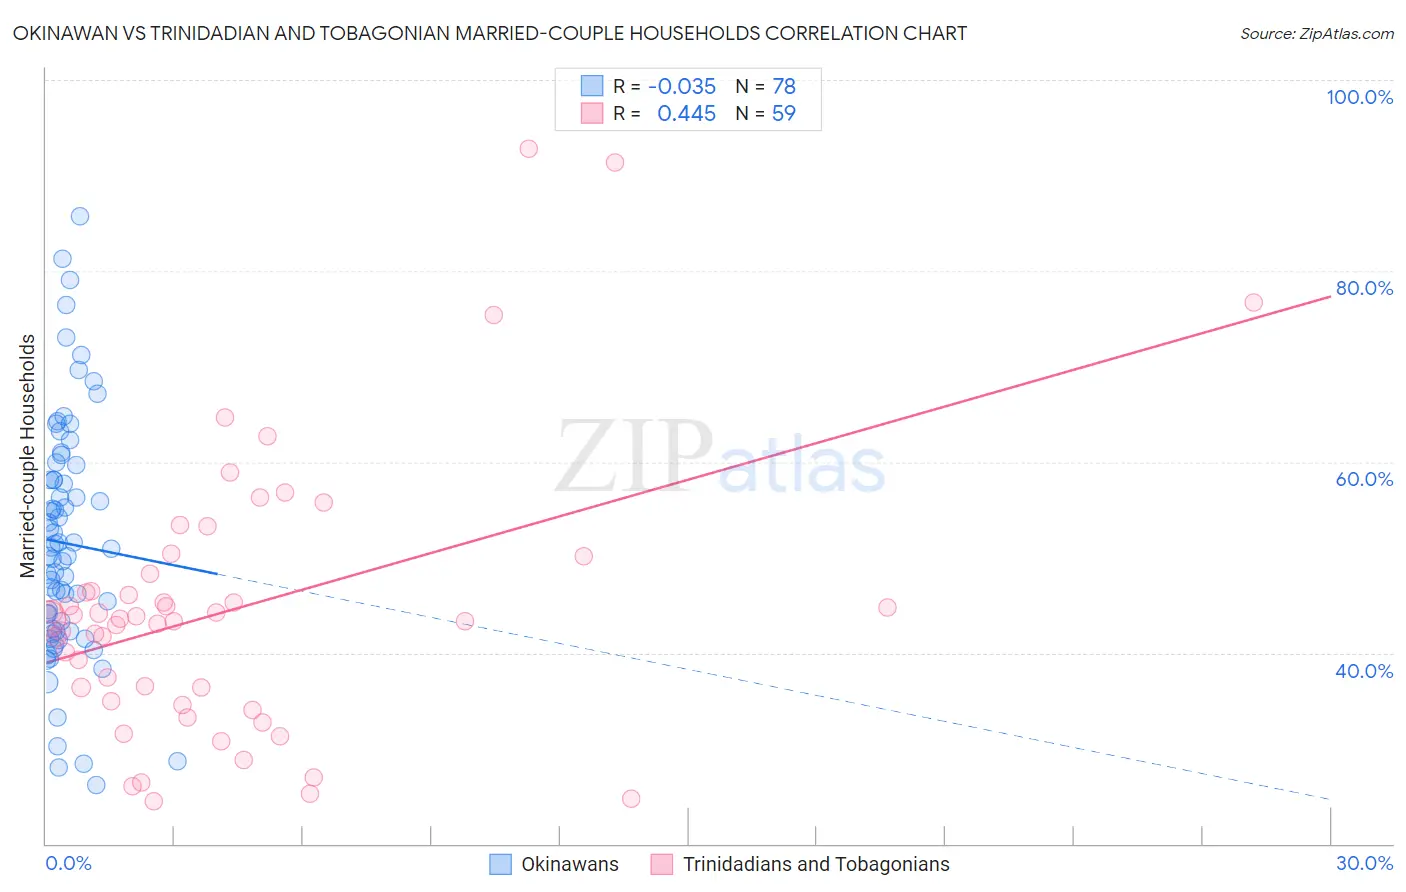
Okinawan vs Trinidadian and Tobagonian Married-couple Households Correlation Chart
The statistical analysis conducted on geographies consisting of 73,726,117 people shows no correlation between the proportion of Okinawans and percentage of married-couple family households in the United States with a correlation coefficient (R) of -0.035 and weighted average of 47.4%. Similarly, the statistical analysis conducted on geographies consisting of 219,710,717 people shows a moderate positive correlation between the proportion of Trinidadians and Tobagonians and percentage of married-couple family households in the United States with a correlation coefficient (R) of 0.445 and weighted average of 40.9%, a difference of 16.1%.
Married-couple Households Correlation Summary
| Measurement | Okinawan | Trinidadian and Tobagonian |
| Minimum | 26.1% | 24.5% |
| Maximum | 85.7% | 92.8% |
| Range | 59.6% | 68.3% |
| Mean | 51.5% | 44.6% |
| Median | 50.5% | 43.5% |
| Interquartile 25% (IQ1) | 42.3% | 34.9% |
| Interquartile 75% (IQ3) | 58.1% | 48.2% |
| Interquartile Range (IQR) | 15.9% | 13.3% |
| Standard Deviation (Sample) | 12.5% | 14.3% |
| Standard Deviation (Population) | 12.4% | 14.2% |
Similar Demographics by Married-couple Households
Demographics Similar to Okinawans by Married-couple Households
In terms of married-couple households, the demographic groups most similar to Okinawans are Immigrants from Eastern Europe (47.4%, a difference of 0.020%), Puget Sound Salish (47.4%, a difference of 0.040%), Immigrants from Venezuela (47.4%, a difference of 0.080%), Zimbabwean (47.4%, a difference of 0.090%), and Australian (47.4%, a difference of 0.11%).
| Demographics | Rating | Rank | Married-couple Households |
| Slovaks | 92.9 /100 | #115 | Exceptional 47.6% |
| Argentineans | 92.5 /100 | #116 | Exceptional 47.5% |
| French Canadians | 92.4 /100 | #117 | Exceptional 47.5% |
| Immigrants | Germany | 92.4 /100 | #118 | Exceptional 47.5% |
| Chileans | 92.2 /100 | #119 | Exceptional 47.5% |
| Puget Sound Salish | 90.5 /100 | #120 | Exceptional 47.4% |
| Immigrants | Eastern Europe | 90.3 /100 | #121 | Exceptional 47.4% |
| Okinawans | 90.1 /100 | #122 | Exceptional 47.4% |
| Immigrants | Venezuela | 89.3 /100 | #123 | Excellent 47.4% |
| Zimbabweans | 89.2 /100 | #124 | Excellent 47.4% |
| Australians | 89.0 /100 | #125 | Excellent 47.4% |
| Pakistanis | 88.6 /100 | #126 | Excellent 47.3% |
| Celtics | 88.1 /100 | #127 | Excellent 47.3% |
| Immigrants | Peru | 87.9 /100 | #128 | Excellent 47.3% |
| Immigrants | Iraq | 87.8 /100 | #129 | Excellent 47.3% |
Demographics Similar to Trinidadians and Tobagonians by Married-couple Households
In terms of married-couple households, the demographic groups most similar to Trinidadians and Tobagonians are Jamaican (40.9%, a difference of 0.080%), Immigrants from Haiti (40.9%, a difference of 0.15%), Immigrants from Caribbean (40.8%, a difference of 0.18%), African (40.9%, a difference of 0.22%), and Colville (41.0%, a difference of 0.30%).
| Demographics | Rating | Rank | Married-couple Households |
| Crow | 0.0 /100 | #308 | Tragic 41.4% |
| Immigrants | Trinidad and Tobago | 0.0 /100 | #309 | Tragic 41.2% |
| Haitians | 0.0 /100 | #310 | Tragic 41.2% |
| Colville | 0.0 /100 | #311 | Tragic 41.0% |
| Africans | 0.0 /100 | #312 | Tragic 40.9% |
| Immigrants | Haiti | 0.0 /100 | #313 | Tragic 40.9% |
| Jamaicans | 0.0 /100 | #314 | Tragic 40.9% |
| Trinidadians and Tobagonians | 0.0 /100 | #315 | Tragic 40.9% |
| Immigrants | Caribbean | 0.0 /100 | #316 | Tragic 40.8% |
| Immigrants | Jamaica | 0.0 /100 | #317 | Tragic 40.7% |
| Liberians | 0.0 /100 | #318 | Tragic 40.7% |
| Bahamians | 0.0 /100 | #319 | Tragic 40.5% |
| West Indians | 0.0 /100 | #320 | Tragic 40.3% |
| Immigrants | Liberia | 0.0 /100 | #321 | Tragic 40.3% |
| Immigrants | Zaire | 0.0 /100 | #322 | Tragic 40.1% |