Immigrants from Singapore vs Liberian Married-couple Households

COMPARE

Immigrants from Singapore
Race
Ancestry
AfghanAfricanAlaska NativeAlaskan AthabascanAlbanianAleutAlsatianAmericanApacheArabArapahoArgentineanArmenianAssyrian/Chaldean/SyriacAustralianAustrianBahamianBangladeshiBarbadianBasqueBelgianBelizeanBermudanBhutaneseBlackfeetBolivianBrazilianBritishBritish West IndianBulgarianBurmeseCajunCambodianCanadianCape VerdeanCarpatho RusynCelticCentral AmericanCentral American IndianCherokeeCheyenneChickasawChileanChineseChippewaChoctawColombianColvilleComancheCosta RicanCreeCreekCroatianCrowCubanCypriotCzechCzechoslovakianDanishDelawareDominicanDutchDutch West IndianEastern EuropeanEcuadorianEgyptianEnglishEstonianEthiopianEuropeanFijianFilipinoFinnishFrenchFrench American IndianFrench CanadianGermanGerman RussianGhanaianGreekGuamanian/ChamorroGuatemalanGuyaneseHaitianHmongHonduranHopiHoumaHungarianIcelanderIndian (Asian)IndonesianInupiatIranianIraqiIrishIroquoisIsraeliItalianJamaicanJapaneseJordanianKenyanKiowaKoreanLaotianLatvianLebaneseLithuanianLumbeeLuxembourgerMacedonianMalaysianMalteseMarshalleseMenomineeMexicanMexican American IndianMongolianMoroccanNative HawaiianNavajoNepaleseNew ZealanderNicaraguanNigerianNorthern EuropeanNorwegianOkinawanOsageOttawaPaiutePakistaniPalestinianPanamanianParaguayanPennsylvania GermanPeruvianPimaPolishPortuguesePotawatomiPuebloPuerto RicanPuget Sound SalishRomanianRussianSalvadoranSamoanScandinavianScotch-IrishScottishSeminoleSenegaleseSerbianShoshoneSierra LeoneanSiouxSlavicSlovakSloveneSomaliSouth AfricanSouth AmericanSouth American IndianSoviet UnionSpaniardSpanishSpanish AmericanSpanish American IndianSri LankanSubsaharan AfricanSudaneseSwedishSwissSyrianTaiwaneseThaiTlingit-HaidaTohono O'OdhamTonganTrinidadian and TobagonianTsimshianTurkishU.S. Virgin IslanderUgandanUkrainianUruguayanUteVenezuelanVietnameseWelshWest IndianYakamaYaquiYugoslavianYumanYup'ikZimbabwean
Immigration
NonimmigrantsImmigrantsAfghanistanAfricaAlbaniaArgentinaArmeniaAsiaAustraliaAustriaBahamasBangladeshBarbadosBelarusBelgiumBelizeBoliviaBosnia and HerzegovinaBrazilBulgariaBurma/MyanmarCabo VerdeCambodiaCameroonCanadaCaribbeanCentral AmericaChileChinaColombiaCongoCosta RicaCroatiaCubaCzechoslovakiaDenmarkDominicaDominican RepublicEastern AfricaEastern AsiaEastern EuropeEcuadorEgyptEl SalvadorEnglandEritreaEthiopiaEuropeFijiFranceGermanyGhanaGreeceGrenadaGuatemalaGuyanaHaitiHondurasHong KongHungaryIndiaIndonesiaIranIraqIrelandIsraelItalyJamaicaJapanJordanKazakhstanKenyaKoreaKuwaitLaosLatin AmericaLatviaLebanonLiberiaLithuaniaMalaysiaMexicoMicronesiaMiddle AfricaMoldovaMoroccoNepalNetherlandsNicaraguaNigeriaNorth AmericaNorth MacedoniaNorthern AfricaNorthern EuropeNorwayOceaniaPakistanPanamaPeruPhilippinesPolandPortugalRomaniaRussiaSaudi ArabiaScotlandSenegalSerbiaSierra LeoneSingaporeSomaliaSouth AfricaSouth AmericaSouth Central AsiaSouth Eastern AsiaSouthern EuropeSpainSri LankaSt. Vincent and the GrenadinesSudanSwedenSwitzerlandSyriaTaiwanThailandTrinidad and TobagoTurkeyUgandaUkraineUruguayUzbekistanVenezuelaVietnamWest IndiesWestern AfricaWestern AsiaWestern EuropeYemenZaireZimbabweAzores
Liberian
Race
Ancestry
AfghanAfricanAlaska NativeAlaskan AthabascanAlbanianAleutAlsatianAmericanApacheArabArapahoArgentineanArmenianAssyrian/Chaldean/SyriacAustralianAustrianBahamianBangladeshiBarbadianBasqueBelgianBelizeanBermudanBhutaneseBlackfeetBolivianBrazilianBritishBritish West IndianBulgarianBurmeseCajunCambodianCanadianCape VerdeanCarpatho RusynCelticCentral AmericanCentral American IndianCherokeeCheyenneChickasawChileanChineseChippewaChoctawColombianColvilleComancheCosta RicanCreeCreekCroatianCrowCubanCypriotCzechCzechoslovakianDanishDelawareDominicanDutchDutch West IndianEastern EuropeanEcuadorianEgyptianEnglishEstonianEthiopianEuropeanFijianFilipinoFinnishFrenchFrench American IndianFrench CanadianGermanGerman RussianGhanaianGreekGuamanian/ChamorroGuatemalanGuyaneseHaitianHmongHonduranHopiHoumaHungarianIcelanderIndian (Asian)IndonesianInupiatIranianIraqiIrishIroquoisIsraeliItalianJamaicanJapaneseJordanianKenyanKiowaKoreanLaotianLatvianLebaneseLiberianLithuanianLumbeeLuxembourgerMacedonianMalaysianMalteseMarshalleseMenomineeMexicanMexican American IndianMongolianMoroccanNative HawaiianNavajoNepaleseNew ZealanderNicaraguanNigerianNorthern EuropeanNorwegianOkinawanOsageOttawaPaiutePakistaniPalestinianPanamanianParaguayanPennsylvania GermanPeruvianPimaPolishPortuguesePotawatomiPuebloPuerto RicanPuget Sound SalishRomanianRussianSalvadoranSamoanScandinavianScotch-IrishScottishSeminoleSenegaleseSerbianShoshoneSierra LeoneanSiouxSlavicSlovakSloveneSomaliSouth AfricanSouth AmericanSouth American IndianSoviet UnionSpaniardSpanishSpanish AmericanSpanish American IndianSri LankanSubsaharan AfricanSudaneseSwedishSwissSyrianTaiwaneseThaiTlingit-HaidaTohono O'OdhamTonganTrinidadian and TobagonianTsimshianTurkishU.S. Virgin IslanderUgandanUkrainianUruguayanUteVenezuelanVietnameseWelshWest IndianYakamaYaquiYugoslavianYumanYup'ikZimbabwean
Immigration
NonimmigrantsImmigrantsAfghanistanAfricaAlbaniaArgentinaArmeniaAsiaAustraliaAustriaBahamasBangladeshBarbadosBelarusBelgiumBelizeBoliviaBosnia and HerzegovinaBrazilBulgariaBurma/MyanmarCabo VerdeCambodiaCameroonCanadaCaribbeanCentral AmericaChileChinaColombiaCongoCosta RicaCroatiaCubaCzechoslovakiaDenmarkDominicaDominican RepublicEastern AfricaEastern AsiaEastern EuropeEcuadorEgyptEl SalvadorEnglandEritreaEthiopiaEuropeFijiFranceGermanyGhanaGreeceGrenadaGuatemalaGuyanaHaitiHondurasHong KongHungaryIndiaIndonesiaIranIraqIrelandIsraelItalyJamaicaJapanJordanKazakhstanKenyaKoreaKuwaitLaosLatin AmericaLatviaLebanonLiberiaLithuaniaMalaysiaMexicoMicronesiaMiddle AfricaMoldovaMoroccoNepalNetherlandsNicaraguaNigeriaNorth AmericaNorth MacedoniaNorthern AfricaNorthern EuropeNorwayOceaniaPakistanPanamaPeruPhilippinesPolandPortugalRomaniaRussiaSaudi ArabiaScotlandSenegalSerbiaSierra LeoneSomaliaSouth AfricaSouth AmericaSouth Central AsiaSouth Eastern AsiaSouthern EuropeSpainSri LankaSt. Vincent and the GrenadinesSudanSwedenSwitzerlandSyriaTaiwanThailandTrinidad and TobagoTurkeyUgandaUkraineUruguayUzbekistanVenezuelaVietnamWest IndiesWestern AfricaWestern AsiaWestern EuropeYemenZaireZimbabweAzores
Married-couple Households
Income
Poverty
Unemployment
Labor Participation
Family Structure
Vehicle Availability
Education Level
Disability

Married-couple Households Comparison

Immigrants from Singapore

Liberians

Exceptional
Tragic
48.3%
MARRIED-COUPLE HOUSEHOLDS
98.6/ 100
METRIC RATING
73rd/ 347
METRIC RANK
40.7%
MARRIED-COUPLE HOUSEHOLDS
0.0/ 100
METRIC RATING
318th/ 347
METRIC RANK

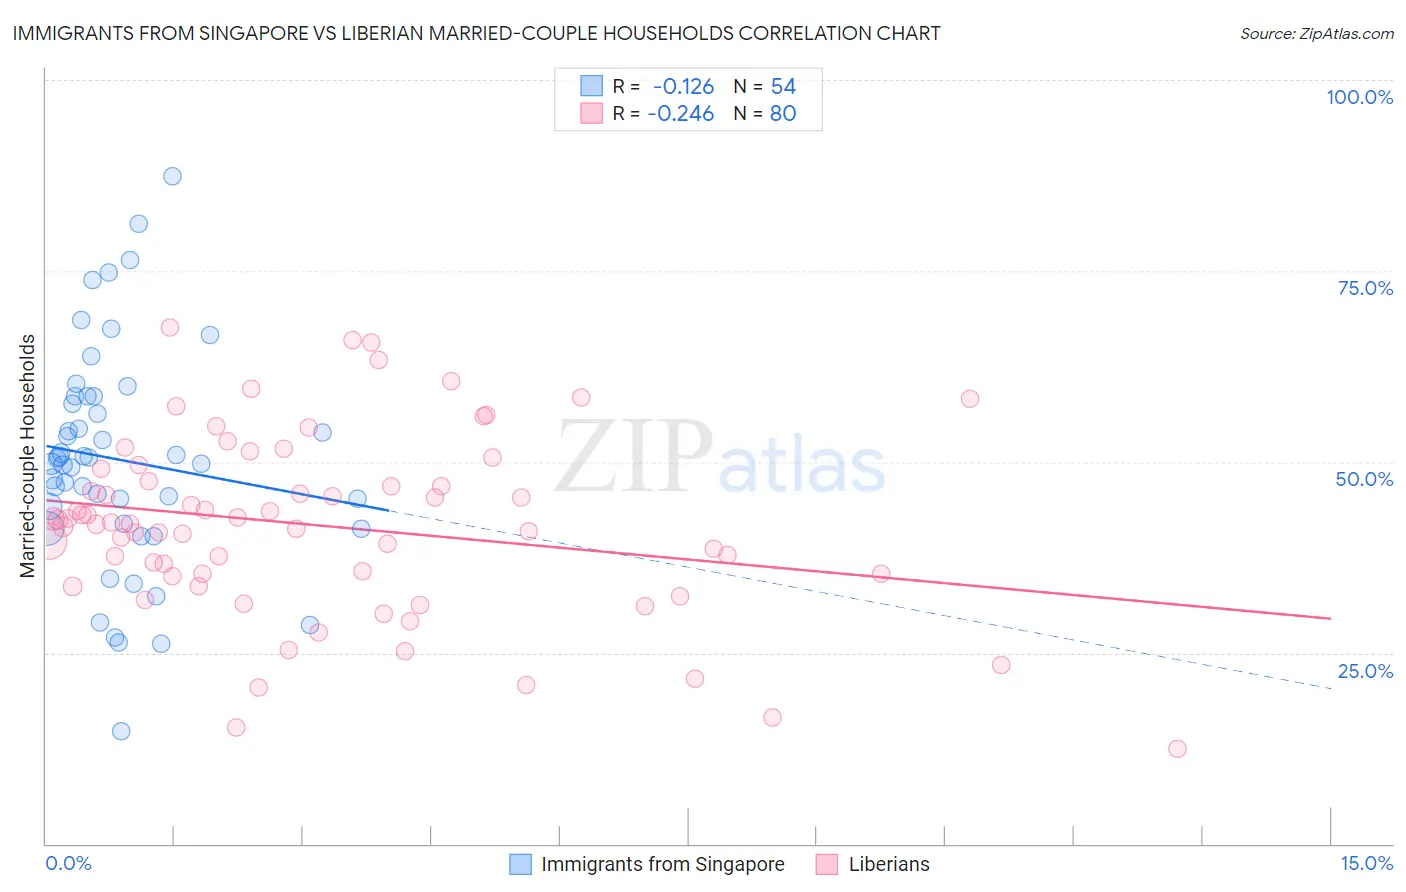
Immigrants from Singapore vs Liberian Married-couple Households Correlation Chart

The statistical analysis conducted on geographies consisting of 137,440,387 people shows a poor negative correlation between the proportion of Immigrants from Singapore and percentage of married-couple family households in the United States with a correlation coefficient (R) of -0.126 and weighted average of 48.3%. Similarly, the statistical analysis conducted on geographies consisting of 118,032,066 people shows a weak negative correlation between the proportion of Liberians and percentage of married-couple family households in the United States with a correlation coefficient (R) of -0.246 and weighted average of 40.7%, a difference of 18.8%.
Immigrants from Singapore vs Liberian Married-couple Households

Married-couple Households Correlation Summary

MeasurementImmigrants from SingaporeLiberian
Minimum14.8%12.5%
Maximum87.3%67.6%
Range72.5%55.1%
Mean50.2%41.7%
Median50.1%42.0%
Interquartile 25% (IQ1)41.8%35.1%
Interquartile 75% (IQ3)58.6%48.2%
Interquartile Range (IQR)16.7%13.1%
Standard Deviation (Sample)14.5%11.9%
Standard Deviation (Population)14.3%11.8%

Similar Demographics by Married-couple Households

Demographics Similar to Immigrants from Singapore by Married-couple Households

In terms of married-couple households, the demographic groups most similar to Immigrants from Singapore are Immigrants from Romania (48.3%, a difference of 0.010%), Scotch-Irish (48.3%, a difference of 0.020%), Immigrants from England (48.2%, a difference of 0.10%), Immigrants from Fiji (48.2%, a difference of 0.10%), and Laotian (48.4%, a difference of 0.19%).
DemographicsRating | RankMarried-couple Households
Jordanians
98.9
/100
|
#66
Exceptional
48.4%
Romanians
98.9
/100
|
#67
Exceptional
48.4%
Immigrants | South Eastern Asia
98.9
/100
|
#68
Exceptional
48.4%
Immigrants | China
98.9
/100
|
#69
Exceptional
48.4%
Immigrants | North America
98.9
/100
|
#70
Exceptional
48.4%
Laotians
98.8
/100
|
#71
Exceptional
48.4%
Scotch-Irish
98.6
/100
|
#72
Exceptional
48.3%
Immigrants | Singapore
98.6
/100
|
#73
Exceptional
48.3%
Immigrants | Romania
98.6
/100
|
#74
Exceptional
48.3%
Immigrants | England
98.4
/100
|
#75
Exceptional
48.2%
Immigrants | Fiji
98.4
/100
|
#76
Exceptional
48.2%
Canadians
98.2
/100
|
#77
Exceptional
48.2%
Egyptians
98.2
/100
|
#78
Exceptional
48.2%
Immigrants | Netherlands
98.2
/100
|
#79
Exceptional
48.2%
Russians
98.1
/100
|
#80
Exceptional
48.2%

Demographics Similar to Liberians by Married-couple Households

In terms of married-couple households, the demographic groups most similar to Liberians are Immigrants from Jamaica (40.7%, a difference of 0.010%), Immigrants from Caribbean (40.8%, a difference of 0.30%), Bahamian (40.5%, a difference of 0.35%), Trinidadian and Tobagonian (40.9%, a difference of 0.48%), and Jamaican (40.9%, a difference of 0.56%).
DemographicsRating | RankMarried-couple Households
Colville
0.0
/100
|
#311
Tragic
41.0%
Africans
0.0
/100
|
#312
Tragic
40.9%
Immigrants | Haiti
0.0
/100
|
#313
Tragic
40.9%
Jamaicans
0.0
/100
|
#314
Tragic
40.9%
Trinidadians and Tobagonians
0.0
/100
|
#315
Tragic
40.9%
Immigrants | Caribbean
0.0
/100
|
#316
Tragic
40.8%
Immigrants | Jamaica
0.0
/100
|
#317
Tragic
40.7%
Liberians
0.0
/100
|
#318
Tragic
40.7%
Bahamians
0.0
/100
|
#319
Tragic
40.5%
West Indians
0.0
/100
|
#320
Tragic
40.3%
Immigrants | Liberia
0.0
/100
|
#321
Tragic
40.3%
Immigrants | Zaire
0.0
/100
|
#322
Tragic
40.1%
Puerto Ricans
0.0
/100
|
#323
Tragic
40.1%
Navajo
0.0
/100
|
#324
Tragic
40.1%
Pueblo
0.0
/100
|
#325
Tragic
40.0%