Immigrants from Italy 3 or more Vehicles in Household
COMPARE
Immigrants from Italy
Select to Compare
3 or more Vehicles in Household
Immigrants from Italy 3 or more Vehicles in Household
18.7%
3+ VEHICLES AVAILABLE
10.2/ 100
METRIC RATING
217th/ 347
METRIC RANK
Immigrants from Italy 3 or more Vehicles in Household Correlation Chart
The statistical analysis conducted on geographies consisting of 324,064,061 people shows a moderate positive correlation between the proportion of Immigrants from Italy and percentage of households with 3 or more vehicles available in the United States with a correlation coefficient (R) of 0.490 and weighted average of 18.7%. On average, for every 1% (one percent) increase in Immigrants from Italy within a typical geography, there is an increase of 1.2% in percentage of households with 3 or more vehicles available.
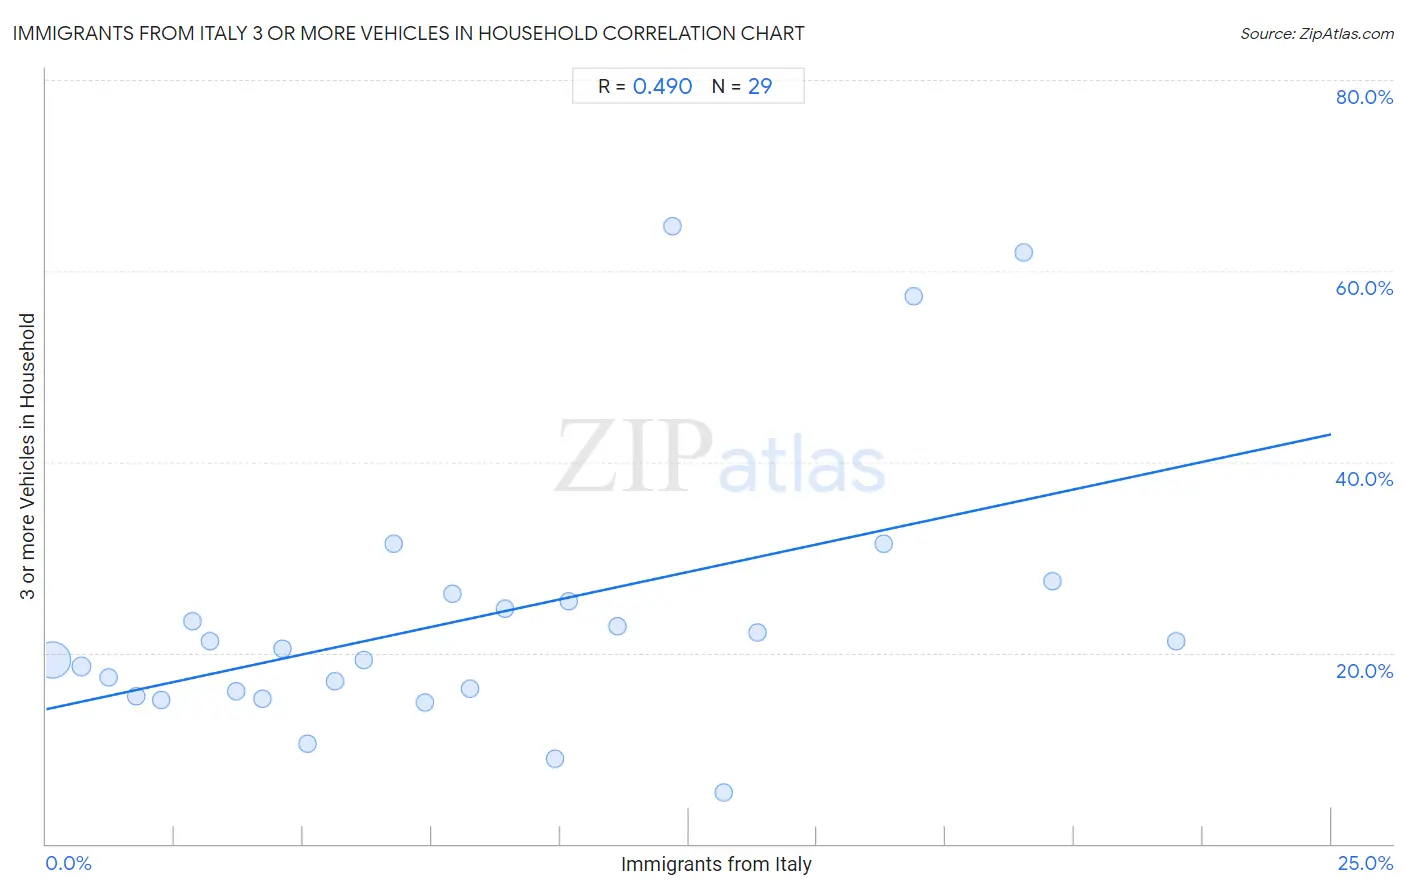
It is essential to understand that the correlation between the percentage of Immigrants from Italy and percentage of households with 3 or more vehicles available does not imply a direct cause-and-effect relationship. It remains uncertain whether the presence of Immigrants from Italy influences an upward or downward trend in the level of percentage of households with 3 or more vehicles available within an area, or if Immigrants from Italy simply ended up residing in those areas with higher or lower levels of percentage of households with 3 or more vehicles available due to other factors.
Demographics Similar to Immigrants from Italy by 3 or more Vehicles in Household
In terms of 3 or more vehicles in household, the demographic groups most similar to Immigrants from Italy are Immigrants from Nigeria (18.7%, a difference of 0.020%), Eastern European (18.7%, a difference of 0.080%), Immigrants from Sierra Leone (18.7%, a difference of 0.13%), Panamanian (18.8%, a difference of 0.28%), and Immigrants from Cuba (18.8%, a difference of 0.28%).
| Demographics | Rating | Rank | 3 or more Vehicles in Household |
| Bulgarians | 13.1 /100 | #210 | Poor 18.8% |
| Immigrants from Kenya | 12.4 /100 | #211 | Poor 18.8% |
| Panamanians | 11.6 /100 | #212 | Poor 18.8% |
| Immigrants from Cuba | 11.6 /100 | #213 | Poor 18.8% |
| Immigrants from Sierra Leone | 10.8 /100 | #214 | Poor 18.7% |
| Eastern Europeans | 10.6 /100 | #215 | Poor 18.7% |
| Immigrants from Nigeria | 10.3 /100 | #216 | Poor 18.7% |
| Immigrants from Italy | 10.2 /100 | #217 | Poor 18.7% |
| Immigrants from Portugal | 8.9 /100 | #218 | Tragic 18.6% |
| Immigrants from Armenia | 8.6 /100 | #219 | Tragic 18.6% |
| Nigerians | 7.9 /100 | #220 | Tragic 18.6% |
| Immigrants from Poland | 7.5 /100 | #221 | Tragic 18.6% |
| Belizeans | 7.3 /100 | #222 | Tragic 18.6% |
| Immigrants from Czechoslovakia | 5.9 /100 | #223 | Tragic 18.5% |
| Immigrants from Argentina | 5.6 /100 | #224 | Tragic 18.5% |
Immigrants from Italy 3 or more Vehicles in Household Correlation Summary
| Measurement | Immigrants from Italy Data | 3 or more Vehicles in Household Data |
| Minimum | 0.12% | 5.4% |
| Maximum | 22.0% | 64.7% |
| Range | 21.9% | 59.3% |
| Mean | 8.4% | 23.8% |
| Median | 7.4% | 20.4% |
| Interquartile 25% (IQ1) | 3.4% | 15.7% |
| Interquartile 75% (IQ3) | 12.7% | 25.7% |
| Interquartile Range (IQR) | 9.2% | 10.0% |
| Standard Deviation (Sample) | 6.1% | 14.3% |
| Standard Deviation (Population) | 6.0% | 14.1% |
Correlation Details
| Immigrants from Italy Percentile | Sample Size | 3 or more Vehicles in Household |
[ 0.0% - 0.5% ] 0.12% | 302,692,191 | 19.3% |
[ 0.5% - 1.0% ] 0.68% | 15,189,023 | 18.6% |
[ 1.0% - 1.5% ] 1.21% | 3,538,387 | 17.4% |
[ 1.5% - 2.0% ] 1.76% | 1,197,218 | 15.5% |
[ 2.0% - 2.5% ] 2.23% | 811,229 | 15.1% |
[ 2.5% - 3.0% ] 2.84% | 132,910 | 23.3% |
[ 3.0% - 3.5% ] 3.18% | 208,125 | 21.2% |
[ 3.5% - 4.0% ] 3.69% | 84,013 | 16.0% |
[ 4.0% - 4.5% ] 4.20% | 130,511 | 15.2% |
[ 4.5% - 5.0% ] 4.61% | 19,537 | 20.4% |
[ 5.0% - 5.5% ] 5.07% | 34,820 | 10.4% |
[ 5.5% - 6.0% ] 5.61% | 2,959 | 17.1% |
[ 6.0% - 6.5% ] 6.18% | 4,614 | 19.3% |
[ 6.5% - 7.0% ] 6.77% | 3,768 | 31.4% |
[ 7.0% - 7.5% ] 7.37% | 3,149 | 14.8% |
[ 7.5% - 8.0% ] 7.91% | 1,910 | 26.1% |
[ 8.0% - 8.5% ] 8.24% | 825 | 16.2% |
[ 8.5% - 9.0% ] 8.93% | 1,164 | 24.7% |
[ 9.5% - 10.0% ] 9.89% | 1,294 | 8.9% |
[ 10.0% - 10.5% ] 10.17% | 1,072 | 25.3% |
[ 11.0% - 11.5% ] 11.11% | 153 | 22.7% |
[ 12.0% - 12.5% ] 12.20% | 41 | 64.7% |
[ 13.0% - 13.5% ] 13.18% | 2,998 | 5.4% |
[ 13.5% - 14.0% ] 13.84% | 289 | 22.1% |
[ 16.0% - 16.5% ] 16.30% | 92 | 31.4% |
[ 16.5% - 17.0% ] 16.88% | 160 | 57.4% |
[ 19.0% - 19.5% ] 19.01% | 142 | 61.9% |
[ 19.5% - 20.0% ] 19.58% | 1,144 | 27.5% |
[ 21.5% - 22.0% ] 21.98% | 323 | 21.2% |