Immigrants from Italy vs Uruguayan Married-couple Households

COMPARE

Immigrants from Italy
Race
Ancestry
AfghanAfricanAlaska NativeAlaskan AthabascanAlbanianAleutAlsatianAmericanApacheArabArapahoArgentineanArmenianAssyrian/Chaldean/SyriacAustralianAustrianBahamianBangladeshiBarbadianBasqueBelgianBelizeanBermudanBhutaneseBlackfeetBolivianBrazilianBritishBritish West IndianBulgarianBurmeseCajunCambodianCanadianCape VerdeanCarpatho RusynCelticCentral AmericanCentral American IndianCherokeeCheyenneChickasawChileanChineseChippewaChoctawColombianColvilleComancheCosta RicanCreeCreekCroatianCrowCubanCypriotCzechCzechoslovakianDanishDelawareDominicanDutchDutch West IndianEastern EuropeanEcuadorianEgyptianEnglishEstonianEthiopianEuropeanFijianFilipinoFinnishFrenchFrench American IndianFrench CanadianGermanGerman RussianGhanaianGreekGuamanian/ChamorroGuatemalanGuyaneseHaitianHmongHonduranHopiHoumaHungarianIcelanderIndian (Asian)IndonesianInupiatIranianIraqiIrishIroquoisIsraeliItalianJamaicanJapaneseJordanianKenyanKiowaKoreanLaotianLatvianLebaneseLiberianLithuanianLumbeeLuxembourgerMacedonianMalaysianMalteseMarshalleseMenomineeMexicanMexican American IndianMongolianMoroccanNative HawaiianNavajoNepaleseNew ZealanderNicaraguanNigerianNorthern EuropeanNorwegianOkinawanOsageOttawaPaiutePakistaniPalestinianPanamanianParaguayanPennsylvania GermanPeruvianPimaPolishPortuguesePotawatomiPuebloPuerto RicanPuget Sound SalishRomanianRussianSalvadoranSamoanScandinavianScotch-IrishScottishSeminoleSenegaleseSerbianShoshoneSierra LeoneanSiouxSlavicSlovakSloveneSomaliSouth AfricanSouth AmericanSouth American IndianSoviet UnionSpaniardSpanishSpanish AmericanSpanish American IndianSri LankanSubsaharan AfricanSudaneseSwedishSwissSyrianTaiwaneseThaiTlingit-HaidaTohono O'OdhamTonganTrinidadian and TobagonianTsimshianTurkishU.S. Virgin IslanderUgandanUkrainianUteVenezuelanVietnameseWelshWest IndianYakamaYaquiYugoslavianYumanYup'ikZimbabwean
Immigration
NonimmigrantsImmigrantsAfghanistanAfricaAlbaniaArgentinaArmeniaAsiaAustraliaAustriaBahamasBangladeshBarbadosBelarusBelgiumBelizeBoliviaBosnia and HerzegovinaBrazilBulgariaBurma/MyanmarCabo VerdeCambodiaCameroonCanadaCaribbeanCentral AmericaChileChinaColombiaCongoCosta RicaCroatiaCubaCzechoslovakiaDenmarkDominicaDominican RepublicEastern AfricaEastern AsiaEastern EuropeEcuadorEgyptEl SalvadorEnglandEritreaEthiopiaEuropeFijiFranceGermanyGhanaGreeceGrenadaGuatemalaGuyanaHaitiHondurasHong KongHungaryIndiaIndonesiaIranIraqIrelandIsraelItalyJamaicaJapanJordanKazakhstanKenyaKoreaKuwaitLaosLatin AmericaLatviaLebanonLiberiaLithuaniaMalaysiaMexicoMicronesiaMiddle AfricaMoldovaMoroccoNepalNetherlandsNicaraguaNigeriaNorth AmericaNorth MacedoniaNorthern AfricaNorthern EuropeNorwayOceaniaPakistanPanamaPeruPhilippinesPolandPortugalRomaniaRussiaSaudi ArabiaScotlandSenegalSerbiaSierra LeoneSingaporeSomaliaSouth AfricaSouth AmericaSouth Central AsiaSouth Eastern AsiaSouthern EuropeSpainSri LankaSt. Vincent and the GrenadinesSudanSwedenSwitzerlandSyriaTaiwanThailandTrinidad and TobagoTurkeyUgandaUkraineUruguayUzbekistanVenezuelaVietnamWest IndiesWestern AfricaWestern AsiaWestern EuropeYemenZaireZimbabweAzores
Uruguayan
Race
Ancestry
AfghanAfricanAlaska NativeAlaskan AthabascanAlbanianAleutAlsatianAmericanApacheArabArapahoArgentineanArmenianAssyrian/Chaldean/SyriacAustralianAustrianBahamianBangladeshiBarbadianBasqueBelgianBelizeanBermudanBhutaneseBlackfeetBolivianBrazilianBritishBritish West IndianBulgarianBurmeseCajunCambodianCanadianCape VerdeanCarpatho RusynCelticCentral AmericanCentral American IndianCherokeeCheyenneChickasawChileanChineseChippewaChoctawColombianColvilleComancheCosta RicanCreeCreekCroatianCrowCubanCypriotCzechCzechoslovakianDanishDelawareDominicanDutchDutch West IndianEastern EuropeanEcuadorianEgyptianEnglishEstonianEthiopianEuropeanFijianFilipinoFinnishFrenchFrench American IndianFrench CanadianGermanGerman RussianGhanaianGreekGuamanian/ChamorroGuatemalanGuyaneseHaitianHmongHonduranHopiHoumaHungarianIcelanderIndian (Asian)IndonesianInupiatIranianIraqiIrishIroquoisIsraeliItalianJamaicanJapaneseJordanianKenyanKiowaKoreanLaotianLatvianLebaneseLiberianLithuanianLumbeeLuxembourgerMacedonianMalaysianMalteseMarshalleseMenomineeMexicanMexican American IndianMongolianMoroccanNative HawaiianNavajoNepaleseNew ZealanderNicaraguanNigerianNorthern EuropeanNorwegianOkinawanOsageOttawaPaiutePakistaniPalestinianPanamanianParaguayanPennsylvania GermanPeruvianPimaPolishPortuguesePotawatomiPuebloPuerto RicanPuget Sound SalishRomanianRussianSalvadoranSamoanScandinavianScotch-IrishScottishSeminoleSenegaleseSerbianShoshoneSierra LeoneanSiouxSlavicSlovakSloveneSomaliSouth AfricanSouth AmericanSouth American IndianSoviet UnionSpaniardSpanishSpanish AmericanSpanish American IndianSri LankanSubsaharan AfricanSudaneseSwedishSwissSyrianTaiwaneseThaiTlingit-HaidaTohono O'OdhamTonganTrinidadian and TobagonianTsimshianTurkishU.S. Virgin IslanderUgandanUkrainianUruguayanUteVenezuelanVietnameseWelshWest IndianYakamaYaquiYugoslavianYumanYup'ikZimbabwean
Immigration
NonimmigrantsImmigrantsAfghanistanAfricaAlbaniaArgentinaArmeniaAsiaAustraliaAustriaBahamasBangladeshBarbadosBelarusBelgiumBelizeBoliviaBosnia and HerzegovinaBrazilBulgariaBurma/MyanmarCabo VerdeCambodiaCameroonCanadaCaribbeanCentral AmericaChileChinaColombiaCongoCosta RicaCroatiaCubaCzechoslovakiaDenmarkDominicaDominican RepublicEastern AfricaEastern AsiaEastern EuropeEcuadorEgyptEl SalvadorEnglandEritreaEthiopiaEuropeFijiFranceGermanyGhanaGreeceGrenadaGuatemalaGuyanaHaitiHondurasHong KongHungaryIndiaIndonesiaIranIraqIrelandIsraelJamaicaJapanJordanKazakhstanKenyaKoreaKuwaitLaosLatin AmericaLatviaLebanonLiberiaLithuaniaMalaysiaMexicoMicronesiaMiddle AfricaMoldovaMoroccoNepalNetherlandsNicaraguaNigeriaNorth AmericaNorth MacedoniaNorthern AfricaNorthern EuropeNorwayOceaniaPakistanPanamaPeruPhilippinesPolandPortugalRomaniaRussiaSaudi ArabiaScotlandSenegalSerbiaSierra LeoneSingaporeSomaliaSouth AfricaSouth AmericaSouth Central AsiaSouth Eastern AsiaSouthern EuropeSpainSri LankaSt. Vincent and the GrenadinesSudanSwedenSwitzerlandSyriaTaiwanThailandTrinidad and TobagoTurkeyUgandaUkraineUruguayUzbekistanVenezuelaVietnamWest IndiesWestern AfricaWestern AsiaWestern EuropeYemenZaireZimbabweAzores
Married-couple Households
Income
Poverty
Unemployment
Labor Participation
Family Structure
Vehicle Availability
Education Level
Disability

Married-couple Households Comparison

Immigrants from Italy

Uruguayans

Exceptional
Poor
47.9%
MARRIED-COUPLE HOUSEHOLDS
96.3/ 100
METRIC RATING
100th/ 347
METRIC RANK
45.5%
MARRIED-COUPLE HOUSEHOLDS
10.4/ 100
METRIC RATING
206th/ 347
METRIC RANK

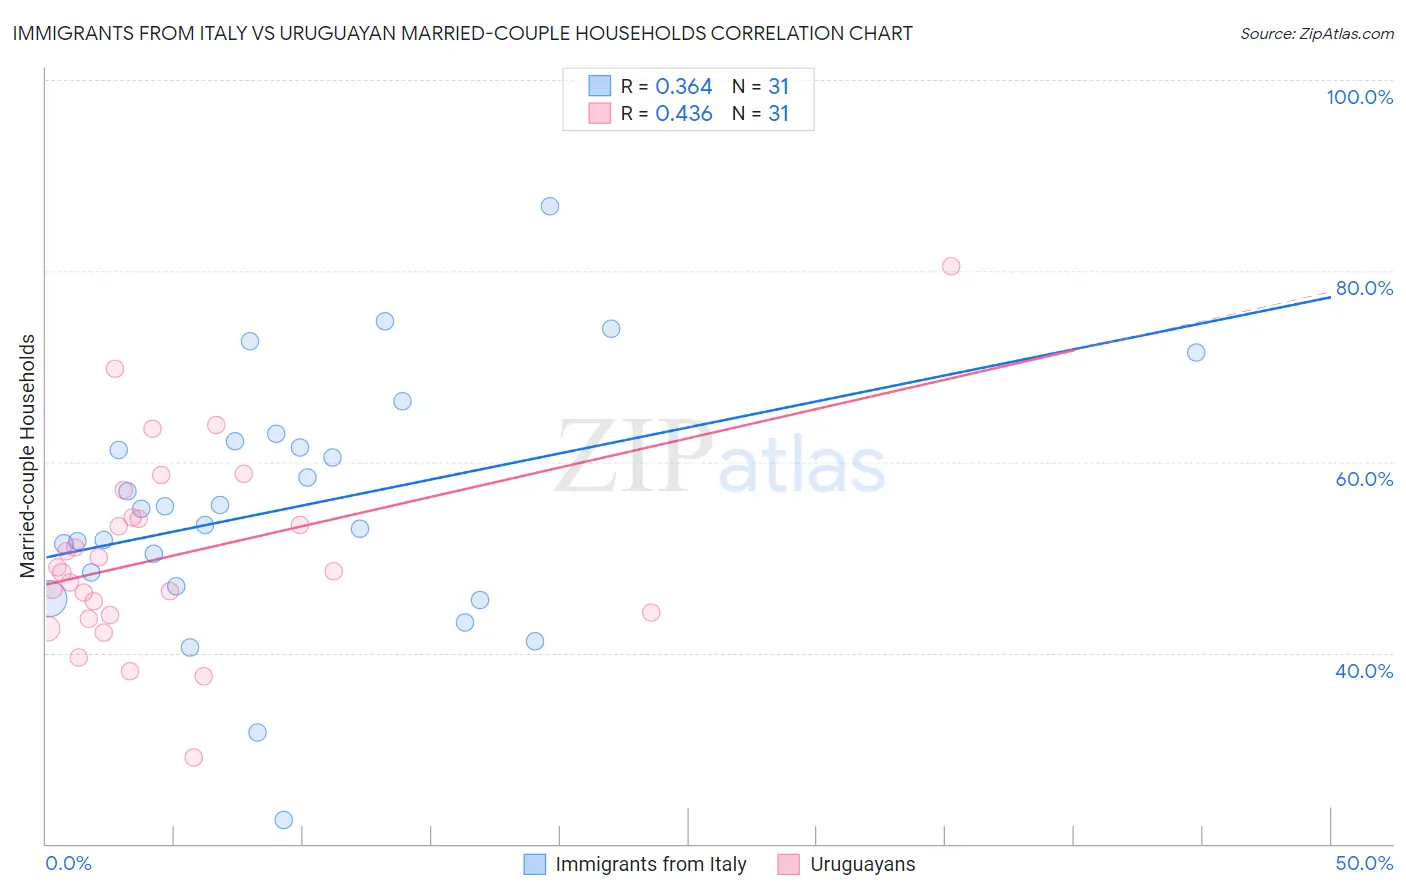
Immigrants from Italy vs Uruguayan Married-couple Households Correlation Chart

The statistical analysis conducted on geographies consisting of 324,146,965 people shows a mild positive correlation between the proportion of Immigrants from Italy and percentage of married-couple family households in the United States with a correlation coefficient (R) of 0.364 and weighted average of 47.9%. Similarly, the statistical analysis conducted on geographies consisting of 144,757,843 people shows a moderate positive correlation between the proportion of Uruguayans and percentage of married-couple family households in the United States with a correlation coefficient (R) of 0.436 and weighted average of 45.5%, a difference of 5.2%.
Immigrants from Italy vs Uruguayan Married-couple Households

Married-couple Households Correlation Summary

MeasurementImmigrants from ItalyUruguayan
Minimum22.5%29.0%
Maximum86.8%80.5%
Range64.2%51.4%
Mean55.3%50.2%
Median55.1%48.5%
Interquartile 25% (IQ1)47.0%44.0%
Interquartile 75% (IQ3)62.1%54.2%
Interquartile Range (IQR)15.1%10.2%
Standard Deviation (Sample)13.2%10.2%
Standard Deviation (Population)12.9%10.0%

Similar Demographics by Married-couple Households

Demographics Similar to Immigrants from Italy by Married-couple Households

In terms of married-couple households, the demographic groups most similar to Immigrants from Italy are Immigrants from Austria (47.9%, a difference of 0.010%), Immigrants from North Macedonia (47.9%, a difference of 0.020%), Latvian (47.9%, a difference of 0.030%), Immigrants from Egypt (47.9%, a difference of 0.060%), and Turkish (47.8%, a difference of 0.060%).
DemographicsRating | RankMarried-couple Households
Lebanese
96.9
/100
|
#93
Exceptional
47.9%
Americans
96.9
/100
|
#94
Exceptional
47.9%
Immigrants | Belgium
96.8
/100
|
#95
Exceptional
47.9%
Immigrants | Egypt
96.6
/100
|
#96
Exceptional
47.9%
Latvians
96.5
/100
|
#97
Exceptional
47.9%
Immigrants | North Macedonia
96.4
/100
|
#98
Exceptional
47.9%
Immigrants | Austria
96.4
/100
|
#99
Exceptional
47.9%
Immigrants | Italy
96.3
/100
|
#100
Exceptional
47.9%
Turks
96.1
/100
|
#101
Exceptional
47.8%
Slavs
96.0
/100
|
#102
Exceptional
47.8%
Hawaiians
96.0
/100
|
#103
Exceptional
47.8%
Immigrants | South Africa
96.0
/100
|
#104
Exceptional
47.8%
Immigrants | Czechoslovakia
95.5
/100
|
#105
Exceptional
47.8%
Portuguese
95.5
/100
|
#106
Exceptional
47.8%
Estonians
94.7
/100
|
#107
Exceptional
47.7%

Demographics Similar to Uruguayans by Married-couple Households

In terms of married-couple households, the demographic groups most similar to Uruguayans are Nepalese (45.6%, a difference of 0.14%), Immigrants from France (45.4%, a difference of 0.18%), Hispanic or Latino (45.4%, a difference of 0.19%), Aleut (45.6%, a difference of 0.20%), and Immigrants from Uzbekistan (45.4%, a difference of 0.23%).
DemographicsRating | RankMarried-couple Households
Carpatho Rusyns
15.7
/100
|
#199
Poor
45.7%
Potawatomi
15.6
/100
|
#200
Poor
45.7%
Immigrants | Serbia
15.2
/100
|
#201
Poor
45.7%
Immigrants | Central America
14.2
/100
|
#202
Poor
45.7%
Alaska Natives
13.0
/100
|
#203
Poor
45.6%
Aleuts
12.5
/100
|
#204
Poor
45.6%
Nepalese
11.9
/100
|
#205
Poor
45.6%
Uruguayans
10.4
/100
|
#206
Poor
45.5%
Immigrants | France
8.8
/100
|
#207
Tragic
45.4%
Hispanics or Latinos
8.7
/100
|
#208
Tragic
45.4%
Immigrants | Uzbekistan
8.4
/100
|
#209
Tragic
45.4%
Cubans
7.7
/100
|
#210
Tragic
45.4%
Immigrants | Spain
7.3
/100
|
#211
Tragic
45.3%
Creek
6.4
/100
|
#212
Tragic
45.3%
Yakama
5.8
/100
|
#213
Tragic
45.2%