Immigrants from Italy 1 or more Vehicles in Household

COMPARE

Immigrants from Italy
Race
Ancestry
AfghanAfricanAlaska NativeAlaskan AthabascanAlbanianAleutAlsatianAmericanApacheArabArapahoArgentineanArmenianAssyrian/Chaldean/SyriacAustralianAustrianBahamianBangladeshiBarbadianBasqueBelgianBelizeanBermudanBhutaneseBlackfeetBolivianBrazilianBritishBritish West IndianBulgarianBurmeseCajunCambodianCanadianCape VerdeanCarpatho RusynCelticCentral AmericanCentral American IndianCherokeeCheyenneChickasawChileanChineseChippewaChoctawColombianColvilleComancheCosta RicanCreeCreekCroatianCrowCubanCypriotCzechCzechoslovakianDanishDelawareDominicanDutchDutch West IndianEastern EuropeanEcuadorianEgyptianEnglishEstonianEthiopianEuropeanFijianFilipinoFinnishFrenchFrench American IndianFrench CanadianGermanGerman RussianGhanaianGreekGuamanian/ChamorroGuatemalanGuyaneseHaitianHmongHonduranHopiHoumaHungarianIcelanderIndian (Asian)IndonesianInupiatIranianIraqiIrishIroquoisIsraeliItalianJamaicanJapaneseJordanianKenyanKiowaKoreanLaotianLatvianLebaneseLiberianLithuanianLumbeeLuxembourgerMacedonianMalaysianMalteseMarshalleseMenomineeMexicanMexican American IndianMongolianMoroccanNative HawaiianNavajoNepaleseNew ZealanderNicaraguanNigerianNorthern EuropeanNorwegianOkinawanOsageOttawaPaiutePakistaniPalestinianPanamanianParaguayanPennsylvania GermanPeruvianPimaPolishPortuguesePotawatomiPuebloPuerto RicanPuget Sound SalishRomanianRussianSalvadoranSamoanScandinavianScotch-IrishScottishSeminoleSenegaleseSerbianShoshoneSierra LeoneanSiouxSlavicSlovakSloveneSomaliSouth AfricanSouth AmericanSouth American IndianSoviet UnionSpaniardSpanishSpanish AmericanSpanish American IndianSri LankanSubsaharan AfricanSudaneseSwedishSwissSyrianTaiwaneseThaiTlingit-HaidaTohono O'OdhamTonganTrinidadian and TobagonianTsimshianTurkishU.S. Virgin IslanderUgandanUkrainianUruguayanUteVenezuelanVietnameseWelshWest IndianYakamaYaquiYugoslavianYumanYup'ikZimbabwean
Immigration
NonimmigrantsImmigrantsAfghanistanAfricaAlbaniaArgentinaArmeniaAsiaAustraliaAustriaBahamasBangladeshBarbadosBelarusBelgiumBelizeBoliviaBosnia and HerzegovinaBrazilBulgariaBurma/MyanmarCabo VerdeCambodiaCameroonCanadaCaribbeanCentral AmericaChileChinaColombiaCongoCosta RicaCroatiaCubaCzechoslovakiaDenmarkDominicaDominican RepublicEastern AfricaEastern AsiaEastern EuropeEcuadorEgyptEl SalvadorEnglandEritreaEthiopiaEuropeFijiFranceGermanyGhanaGreeceGrenadaGuatemalaGuyanaHaitiHondurasHong KongHungaryIndiaIndonesiaIranIraqIrelandIsraelItalyJamaicaJapanJordanKazakhstanKenyaKoreaKuwaitLaosLatin AmericaLatviaLebanonLiberiaLithuaniaMalaysiaMexicoMicronesiaMiddle AfricaMoldovaMoroccoNepalNetherlandsNicaraguaNigeriaNorth AmericaNorth MacedoniaNorthern AfricaNorthern EuropeNorwayOceaniaPakistanPanamaPeruPhilippinesPolandPortugalRomaniaRussiaSaudi ArabiaScotlandSenegalSerbiaSierra LeoneSingaporeSomaliaSouth AfricaSouth AmericaSouth Central AsiaSouth Eastern AsiaSouthern EuropeSpainSri LankaSt. Vincent and the GrenadinesSudanSwedenSwitzerlandSyriaTaiwanThailandTrinidad and TobagoTurkeyUgandaUkraineUruguayUzbekistanVenezuelaVietnamWest IndiesWestern AfricaWestern AsiaWestern EuropeYemenZaireZimbabweAzores
Select to Compare
Race
Ancestry
AfghanAfricanAlaska NativeAlaskan AthabascanAlbanianAleutAlsatianAmericanApacheArabArapahoArgentineanArmenianAssyrian/Chaldean/SyriacAustralianAustrianBahamianBangladeshiBarbadianBasqueBelgianBelizeanBermudanBhutaneseBlackfeetBolivianBrazilianBritishBritish West IndianBulgarianBurmeseCajunCambodianCanadianCape VerdeanCarpatho RusynCelticCentral AmericanCentral American IndianCherokeeCheyenneChickasawChileanChineseChippewaChoctawColombianColvilleComancheCosta RicanCreeCreekCroatianCrowCubanCypriotCzechCzechoslovakianDanishDelawareDominicanDutchDutch West IndianEastern EuropeanEcuadorianEgyptianEnglishEstonianEthiopianEuropeanFijianFilipinoFinnishFrenchFrench American IndianFrench CanadianGermanGerman RussianGhanaianGreekGuamanian/ChamorroGuatemalanGuyaneseHaitianHmongHonduranHopiHoumaHungarianIcelanderIndian (Asian)IndonesianInupiatIranianIraqiIrishIroquoisIsraeliItalianJamaicanJapaneseJordanianKenyanKiowaKoreanLaotianLatvianLebaneseLiberianLithuanianLumbeeLuxembourgerMacedonianMalaysianMalteseMarshalleseMenomineeMexicanMexican American IndianMongolianMoroccanNative HawaiianNavajoNepaleseNew ZealanderNicaraguanNigerianNorthern EuropeanNorwegianOkinawanOsageOttawaPaiutePakistaniPalestinianPanamanianParaguayanPennsylvania GermanPeruvianPimaPolishPortuguesePotawatomiPuebloPuerto RicanPuget Sound SalishRomanianRussianSalvadoranSamoanScandinavianScotch-IrishScottishSeminoleSenegaleseSerbianShoshoneSierra LeoneanSiouxSlavicSlovakSloveneSomaliSouth AfricanSouth AmericanSouth American IndianSoviet UnionSpaniardSpanishSpanish AmericanSpanish American IndianSri LankanSubsaharan AfricanSudaneseSwedishSwissSyrianTaiwaneseThaiTlingit-HaidaTohono O'OdhamTonganTrinidadian and TobagonianTsimshianTurkishU.S. Virgin IslanderUgandanUkrainianUruguayanUteVenezuelanVietnameseWelshWest IndianYakamaYaquiYugoslavianYumanYup'ikZimbabwean
Immigration
NonimmigrantsImmigrantsAfghanistanAfricaAlbaniaArgentinaArmeniaAsiaAustraliaAustriaBahamasBangladeshBarbadosBelarusBelgiumBelizeBoliviaBosnia and HerzegovinaBrazilBulgariaBurma/MyanmarCabo VerdeCambodiaCameroonCanadaCaribbeanCentral AmericaChileChinaColombiaCongoCosta RicaCroatiaCubaCzechoslovakiaDenmarkDominicaDominican RepublicEastern AfricaEastern AsiaEastern EuropeEcuadorEgyptEl SalvadorEnglandEritreaEthiopiaEuropeFijiFranceGermanyGhanaGreeceGrenadaGuatemalaGuyanaHaitiHondurasHong KongHungaryIndiaIndonesiaIranIraqIrelandIsraelJamaicaJapanJordanKazakhstanKenyaKoreaKuwaitLaosLatin AmericaLatviaLebanonLiberiaLithuaniaMalaysiaMexicoMicronesiaMiddle AfricaMoldovaMoroccoNepalNetherlandsNicaraguaNigeriaNorth AmericaNorth MacedoniaNorthern AfricaNorthern EuropeNorwayOceaniaPakistanPanamaPeruPhilippinesPolandPortugalRomaniaRussiaSaudi ArabiaScotlandSenegalSerbiaSierra LeoneSingaporeSomaliaSouth AfricaSouth AmericaSouth Central AsiaSouth Eastern AsiaSouthern EuropeSpainSri LankaSt. Vincent and the GrenadinesSudanSwedenSwitzerlandSyriaTaiwanThailandTrinidad and TobagoTurkeyUgandaUkraineUruguayUzbekistanVenezuelaVietnamWest IndiesWestern AfricaWestern AsiaWestern EuropeYemenZaireZimbabweAzores
1 or more Vehicles in Household
Income
Poverty
Unemployment
Labor Participation
Family Structure
Vehicle Availability
Education Level
Disability

Immigrants from Italy 1 or more Vehicles in Household
Poor

89.1%
1+ VEHICLES AVAILABLE
14.0/ 100
METRIC RATING
209th/ 347
METRIC RANK

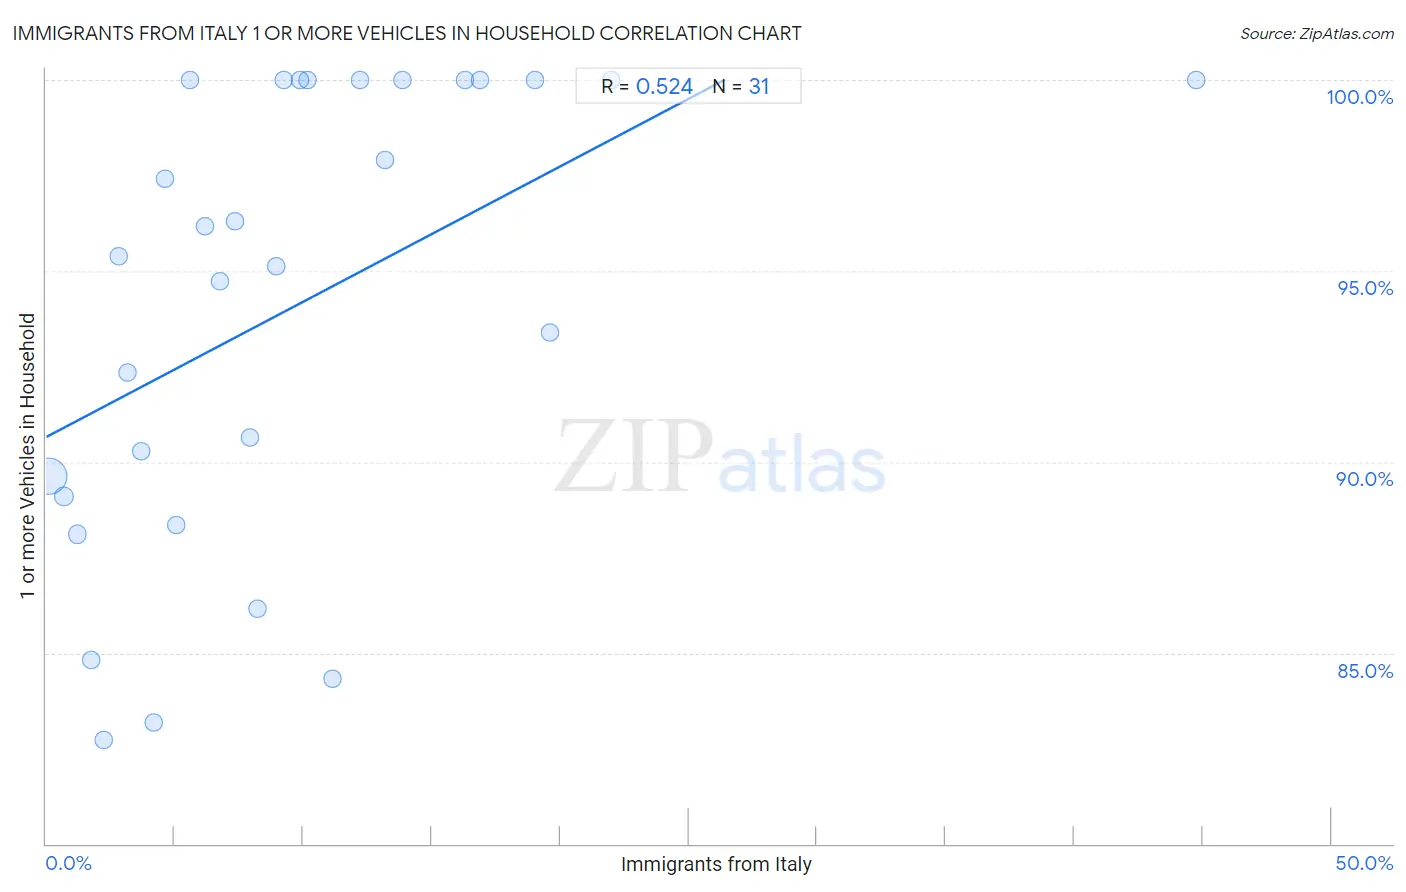
Immigrants from Italy 1 or more Vehicles in Household Correlation Chart

The statistical analysis conducted on geographies consisting of 324,164,676 people shows a substantial positive correlation between the proportion of Immigrants from Italy and percentage of households with 1 or more vehicles available in the United States with a correlation coefficient (R) of 0.524 and weighted average of 89.1%. On average, for every 1% (one percent) increase in Immigrants from Italy within a typical geography, there is an increase of 0.35% in percentage of households with 1 or more vehicles available.
Immigrants from Italy 1 or more Vehicles in Household
It is essential to understand that the correlation between the percentage of Immigrants from Italy and percentage of households with 1 or more vehicles available does not imply a direct cause-and-effect relationship. It remains uncertain whether the presence of Immigrants from Italy influences an upward or downward trend in the level of percentage of households with 1 or more vehicles available within an area, or if Immigrants from Italy simply ended up residing in those areas with higher or lower levels of percentage of households with 1 or more vehicles available due to other factors.

Demographics Similar to Immigrants from Italy by 1 or more Vehicles in Household

In terms of 1 or more vehicles in household, the demographic groups most similar to Immigrants from Italy are Immigrants from Chile (89.1%, a difference of 0.010%), Dutch West Indian (89.0%, a difference of 0.020%), Immigrants from Denmark (89.1%, a difference of 0.030%), Sierra Leonean (89.0%, a difference of 0.030%), and Somali (89.0%, a difference of 0.040%).
DemographicsRating | Rank1 or more Vehicles in Household
Iroquois
19.8
/100
|
#202
Poor
89.2%
Cambodians
18.9
/100
|
#203
Poor
89.2%
Romanians
18.2
/100
|
#204
Poor
89.2%
Guatemalans
17.8
/100
|
#205
Poor
89.2%
Apache
16.2
/100
|
#206
Poor
89.1%
Immigrants from Denmark
14.8
/100
|
#207
Poor
89.1%
Immigrants from Chile
14.4
/100
|
#208
Poor
89.1%
Immigrants from Italy
14.0
/100
|
#209
Poor
89.1%
Dutch West Indians
13.5
/100
|
#210
Poor
89.0%
Sierra Leoneans
13.0
/100
|
#211
Poor
89.0%
Somalis
12.8
/100
|
#212
Poor
89.0%
Immigrants from Western Asia
12.3
/100
|
#213
Poor
89.0%
Immigrants from Hungary
11.9
/100
|
#214
Poor
89.0%
Immigrants from Sri Lanka
10.2
/100
|
#215
Poor
88.9%
Immigrants from Argentina
9.4
/100
|
#216
Tragic
88.9%

Immigrants from Italy 1 or more Vehicles in Household Correlation Summary

MeasurementImmigrants from Italy Data1 or more Vehicles in Household Data
Minimum0.12%82.7%
Maximum44.7%100.0%
Range44.6%17.3%
Mean9.6%94.1%
Median7.9%95.4%
Interquartile 25% (IQ1)3.7%89.1%
Interquartile 75% (IQ3)13.2%100.0%
Interquartile Range (IQR)9.5%10.9%
Standard Deviation (Sample)8.8%5.9%
Standard Deviation (Population)8.6%5.8%

Correlation Details

Immigrants from Italy PercentileSample Size1 or more Vehicles in Household
[
0.0%
-
0.5%
]
0.12%
302,746,76689.6%
[
0.5%
-
1.0%
]
0.68%
15,221,80589.1%
[
1.0%
-
1.5%
]
1.21%
3,540,17288.1%
[
1.5%
-
2.0%
]
1.76%
1,204,49884.8%
[
2.0%
-
2.5%
]
2.23%
814,96582.7%
[
2.5%
-
3.0%
]
2.84%
132,98995.4%
[
3.0%
-
3.5%
]
3.18%
208,12592.4%
[
3.5%
-
4.0%
]
3.69%
84,01390.3%
[
4.0%
-
4.5%
]
4.20%
130,51183.2%
[
4.5%
-
5.0%
]
4.61%
19,53797.4%
[
5.0%
-
5.5%
]
5.07%
34,82088.3%
[
5.5%
-
6.0%
]
5.61%
2,959100.0%
[
6.0%
-
6.5%
]
6.18%
4,61496.2%
[
6.5%
-
7.0%
]
6.77%
3,76894.7%
[
7.0%
-
7.5%
]
7.37%
3,14996.3%
[
7.5%
-
8.0%
]
7.91%
1,91090.7%
[
8.0%
-
8.5%
]
8.24%
82586.2%
[
8.5%
-
9.0%
]
8.93%
1,16495.1%
[
9.0%
-
9.5%
]
9.23%
260100.0%
[
9.5%
-
10.0%
]
9.89%
1,294100.0%
[
10.0%
-
10.5%
]
10.17%
1,072100.0%
[
11.0%
-
11.5%
]
11.16%
23384.3%
[
12.0%
-
12.5%
]
12.20%
41100.0%
[
13.0%
-
13.5%
]
13.18%
2,99897.9%
[
13.5%
-
14.0%
]
13.84%
289100.0%
[
16.0%
-
16.5%
]
16.30%
92100.0%
[
16.5%
-
17.0%
]
16.88%
160100.0%
[
19.0%
-
19.5%
]
19.01%
142100.0%
[
19.5%
-
20.0%
]
19.58%
1,14493.4%
[
21.5%
-
22.0%
]
21.98%
323100.0%
[
44.5%
-
45.0%
]
44.74%
38100.0%