Immigrants from Italy GED/Equivalency

COMPARE

Immigrants from Italy
Race
Ancestry
AfghanAfricanAlaska NativeAlaskan AthabascanAlbanianAleutAlsatianAmericanApacheArabArapahoArgentineanArmenianAssyrian/Chaldean/SyriacAustralianAustrianBahamianBangladeshiBarbadianBasqueBelgianBelizeanBermudanBhutaneseBlackfeetBolivianBrazilianBritishBritish West IndianBulgarianBurmeseCajunCambodianCanadianCape VerdeanCarpatho RusynCelticCentral AmericanCentral American IndianCherokeeCheyenneChickasawChileanChineseChippewaChoctawColombianColvilleComancheCosta RicanCreeCreekCroatianCrowCubanCypriotCzechCzechoslovakianDanishDelawareDominicanDutchDutch West IndianEastern EuropeanEcuadorianEgyptianEnglishEstonianEthiopianEuropeanFijianFilipinoFinnishFrenchFrench American IndianFrench CanadianGermanGerman RussianGhanaianGreekGuamanian/ChamorroGuatemalanGuyaneseHaitianHmongHonduranHopiHoumaHungarianIcelanderIndian (Asian)IndonesianInupiatIranianIraqiIrishIroquoisIsraeliItalianJamaicanJapaneseJordanianKenyanKiowaKoreanLaotianLatvianLebaneseLiberianLithuanianLumbeeLuxembourgerMacedonianMalaysianMalteseMarshalleseMenomineeMexicanMexican American IndianMongolianMoroccanNative HawaiianNavajoNepaleseNew ZealanderNicaraguanNigerianNorthern EuropeanNorwegianOkinawanOsageOttawaPaiutePakistaniPalestinianPanamanianParaguayanPennsylvania GermanPeruvianPimaPolishPortuguesePotawatomiPuebloPuerto RicanPuget Sound SalishRomanianRussianSalvadoranSamoanScandinavianScotch-IrishScottishSeminoleSenegaleseSerbianShoshoneSierra LeoneanSiouxSlavicSlovakSloveneSomaliSouth AfricanSouth AmericanSouth American IndianSoviet UnionSpaniardSpanishSpanish AmericanSpanish American IndianSri LankanSubsaharan AfricanSudaneseSwedishSwissSyrianTaiwaneseThaiTlingit-HaidaTohono O'OdhamTonganTrinidadian and TobagonianTsimshianTurkishU.S. Virgin IslanderUgandanUkrainianUruguayanUteVenezuelanVietnameseWelshWest IndianYakamaYaquiYugoslavianYumanYup'ikZimbabwean
Immigration
NonimmigrantsImmigrantsAfghanistanAfricaAlbaniaArgentinaArmeniaAsiaAustraliaAustriaBahamasBangladeshBarbadosBelarusBelgiumBelizeBoliviaBosnia and HerzegovinaBrazilBulgariaBurma/MyanmarCabo VerdeCambodiaCameroonCanadaCaribbeanCentral AmericaChileChinaColombiaCongoCosta RicaCroatiaCubaCzechoslovakiaDenmarkDominicaDominican RepublicEastern AfricaEastern AsiaEastern EuropeEcuadorEgyptEl SalvadorEnglandEritreaEthiopiaEuropeFijiFranceGermanyGhanaGreeceGrenadaGuatemalaGuyanaHaitiHondurasHong KongHungaryIndiaIndonesiaIranIraqIrelandIsraelItalyJamaicaJapanJordanKazakhstanKenyaKoreaKuwaitLaosLatin AmericaLatviaLebanonLiberiaLithuaniaMalaysiaMexicoMicronesiaMiddle AfricaMoldovaMoroccoNepalNetherlandsNicaraguaNigeriaNorth AmericaNorth MacedoniaNorthern AfricaNorthern EuropeNorwayOceaniaPakistanPanamaPeruPhilippinesPolandPortugalRomaniaRussiaSaudi ArabiaScotlandSenegalSerbiaSierra LeoneSingaporeSomaliaSouth AfricaSouth AmericaSouth Central AsiaSouth Eastern AsiaSouthern EuropeSpainSri LankaSt. Vincent and the GrenadinesSudanSwedenSwitzerlandSyriaTaiwanThailandTrinidad and TobagoTurkeyUgandaUkraineUruguayUzbekistanVenezuelaVietnamWest IndiesWestern AfricaWestern AsiaWestern EuropeYemenZaireZimbabweAzores
Select to Compare
Race
Ancestry
AfghanAfricanAlaska NativeAlaskan AthabascanAlbanianAleutAlsatianAmericanApacheArabArapahoArgentineanArmenianAssyrian/Chaldean/SyriacAustralianAustrianBahamianBangladeshiBarbadianBasqueBelgianBelizeanBermudanBhutaneseBlackfeetBolivianBrazilianBritishBritish West IndianBulgarianBurmeseCajunCambodianCanadianCape VerdeanCarpatho RusynCelticCentral AmericanCentral American IndianCherokeeCheyenneChickasawChileanChineseChippewaChoctawColombianColvilleComancheCosta RicanCreeCreekCroatianCrowCubanCypriotCzechCzechoslovakianDanishDelawareDominicanDutchDutch West IndianEastern EuropeanEcuadorianEgyptianEnglishEstonianEthiopianEuropeanFijianFilipinoFinnishFrenchFrench American IndianFrench CanadianGermanGerman RussianGhanaianGreekGuamanian/ChamorroGuatemalanGuyaneseHaitianHmongHonduranHopiHoumaHungarianIcelanderIndian (Asian)IndonesianInupiatIranianIraqiIrishIroquoisIsraeliItalianJamaicanJapaneseJordanianKenyanKiowaKoreanLaotianLatvianLebaneseLiberianLithuanianLumbeeLuxembourgerMacedonianMalaysianMalteseMarshalleseMenomineeMexicanMexican American IndianMongolianMoroccanNative HawaiianNavajoNepaleseNew ZealanderNicaraguanNigerianNorthern EuropeanNorwegianOkinawanOsageOttawaPaiutePakistaniPalestinianPanamanianParaguayanPennsylvania GermanPeruvianPimaPolishPortuguesePotawatomiPuebloPuerto RicanPuget Sound SalishRomanianRussianSalvadoranSamoanScandinavianScotch-IrishScottishSeminoleSenegaleseSerbianShoshoneSierra LeoneanSiouxSlavicSlovakSloveneSomaliSouth AfricanSouth AmericanSouth American IndianSoviet UnionSpaniardSpanishSpanish AmericanSpanish American IndianSri LankanSubsaharan AfricanSudaneseSwedishSwissSyrianTaiwaneseThaiTlingit-HaidaTohono O'OdhamTonganTrinidadian and TobagonianTsimshianTurkishU.S. Virgin IslanderUgandanUkrainianUruguayanUteVenezuelanVietnameseWelshWest IndianYakamaYaquiYugoslavianYumanYup'ikZimbabwean
Immigration
NonimmigrantsImmigrantsAfghanistanAfricaAlbaniaArgentinaArmeniaAsiaAustraliaAustriaBahamasBangladeshBarbadosBelarusBelgiumBelizeBoliviaBosnia and HerzegovinaBrazilBulgariaBurma/MyanmarCabo VerdeCambodiaCameroonCanadaCaribbeanCentral AmericaChileChinaColombiaCongoCosta RicaCroatiaCubaCzechoslovakiaDenmarkDominicaDominican RepublicEastern AfricaEastern AsiaEastern EuropeEcuadorEgyptEl SalvadorEnglandEritreaEthiopiaEuropeFijiFranceGermanyGhanaGreeceGrenadaGuatemalaGuyanaHaitiHondurasHong KongHungaryIndiaIndonesiaIranIraqIrelandIsraelJamaicaJapanJordanKazakhstanKenyaKoreaKuwaitLaosLatin AmericaLatviaLebanonLiberiaLithuaniaMalaysiaMexicoMicronesiaMiddle AfricaMoldovaMoroccoNepalNetherlandsNicaraguaNigeriaNorth AmericaNorth MacedoniaNorthern AfricaNorthern EuropeNorwayOceaniaPakistanPanamaPeruPhilippinesPolandPortugalRomaniaRussiaSaudi ArabiaScotlandSenegalSerbiaSierra LeoneSingaporeSomaliaSouth AfricaSouth AmericaSouth Central AsiaSouth Eastern AsiaSouthern EuropeSpainSri LankaSt. Vincent and the GrenadinesSudanSwedenSwitzerlandSyriaTaiwanThailandTrinidad and TobagoTurkeyUgandaUkraineUruguayUzbekistanVenezuelaVietnamWest IndiesWestern AfricaWestern AsiaWestern EuropeYemenZaireZimbabweAzores
GED/Equivalency
Income
Poverty
Unemployment
Labor Participation
Family Structure
Vehicle Availability
Education Level
Disability

Immigrants from Italy GED/Equivalency
Exceptional

86.7%
GED/EQUIVALENCY
90.5/ 100
METRIC RATING
123rd/ 347
METRIC RANK

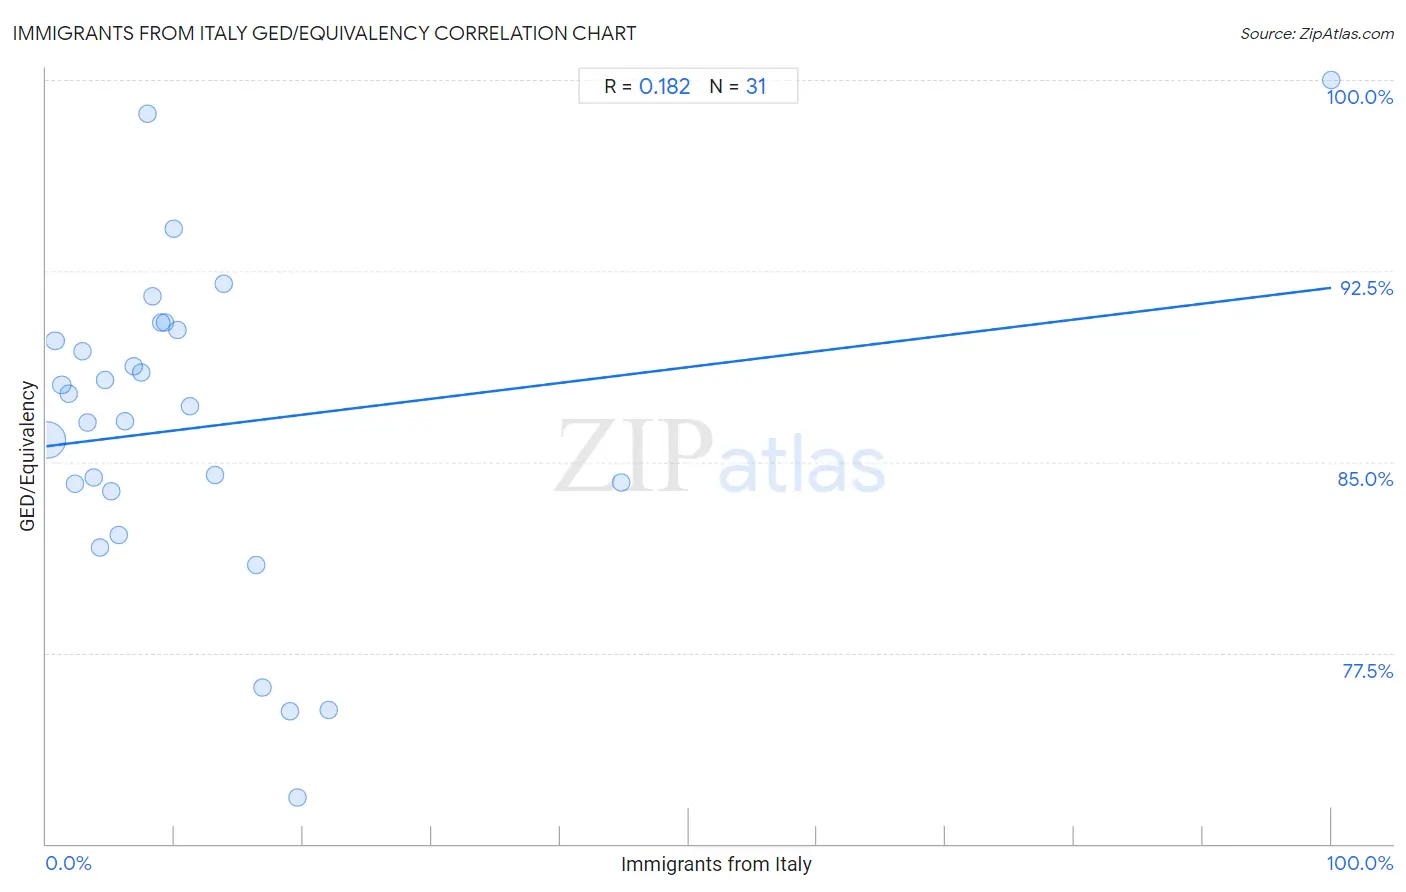
Immigrants from Italy GED/Equivalency Correlation Chart

The statistical analysis conducted on geographies consisting of 324,225,968 people shows a poor positive correlation between the proportion of Immigrants from Italy and percentage of population with at least ged/equivalency education in the United States with a correlation coefficient (R) of 0.182 and weighted average of 86.7%. On average, for every 1% (one percent) increase in Immigrants from Italy within a typical geography, there is an increase of 0.062% in percentage of population with at least ged/equivalency education.
Immigrants from Italy GED/Equivalency
It is essential to understand that the correlation between the percentage of Immigrants from Italy and percentage of population with at least ged/equivalency education does not imply a direct cause-and-effect relationship. It remains uncertain whether the presence of Immigrants from Italy influences an upward or downward trend in the level of percentage of population with at least ged/equivalency education within an area, or if Immigrants from Italy simply ended up residing in those areas with higher or lower levels of percentage of population with at least ged/equivalency education due to other factors.

Demographics Similar to Immigrants from Italy by GED/Equivalency

In terms of ged/equivalency, the demographic groups most similar to Immigrants from Italy are Immigrants from Egypt (86.7%, a difference of 0.010%), Celtic (86.7%, a difference of 0.010%), Immigrants from Lebanon (86.8%, a difference of 0.020%), Immigrants from Jordan (86.8%, a difference of 0.020%), and Asian (86.7%, a difference of 0.020%).
DemographicsRating | RankGED/Equivalency
Swiss
94.5
/100
|
#116
Exceptional
87.0%
Immigrants from Hong Kong
93.8
/100
|
#117
Exceptional
86.9%
French Canadians
93.2
/100
|
#118
Exceptional
86.9%
Immigrants from China
93.2
/100
|
#119
Exceptional
86.9%
Scotch-Irish
91.6
/100
|
#120
Exceptional
86.8%
Immigrants from Lebanon
90.9
/100
|
#121
Exceptional
86.8%
Immigrants from Jordan
90.8
/100
|
#122
Exceptional
86.8%
Immigrants from Italy
90.5
/100
|
#123
Exceptional
86.7%
Immigrants from Egypt
90.4
/100
|
#124
Exceptional
86.7%
Celtics
90.4
/100
|
#125
Exceptional
86.7%
Asians
90.3
/100
|
#126
Exceptional
86.7%
Argentineans
89.7
/100
|
#127
Excellent
86.7%
Yugoslavians
89.5
/100
|
#128
Excellent
86.7%
Immigrants from Ukraine
88.9
/100
|
#129
Excellent
86.7%
Immigrants from Germany
88.8
/100
|
#130
Excellent
86.7%

Immigrants from Italy GED/Equivalency Correlation Summary

MeasurementImmigrants from Italy DataGED/Equivalency Data
Minimum0.12%71.8%
Maximum100.0%100.0%
Range99.9%28.2%
Mean12.5%86.4%
Median7.9%87.2%
Interquartile 25% (IQ1)3.7%83.9%
Interquartile 75% (IQ3)13.8%90.2%
Interquartile Range (IQR)10.2%6.3%
Standard Deviation (Sample)18.5%6.3%
Standard Deviation (Population)18.2%6.2%

Correlation Details

Immigrants from Italy PercentileSample SizeGED/Equivalency
[
0.0%
-
0.5%
]
0.12%
302,790,71085.9%
[
0.5%
-
1.0%
]
0.68%
15,228,58389.8%
[
1.0%
-
1.5%
]
1.21%
3,546,13488.0%
[
1.5%
-
2.0%
]
1.76%
1,208,95487.7%
[
2.0%
-
2.5%
]
2.23%
814,96584.1%
[
2.5%
-
3.0%
]
2.84%
133,18089.3%
[
3.0%
-
3.5%
]
3.18%
208,12586.5%
[
3.5%
-
4.0%
]
3.69%
84,01384.4%
[
4.0%
-
4.5%
]
4.20%
130,51181.7%
[
4.5%
-
5.0%
]
4.61%
19,53788.2%
[
5.0%
-
5.5%
]
5.07%
34,82083.9%
[
5.5%
-
6.0%
]
5.61%
2,95982.1%
[
6.0%
-
6.5%
]
6.18%
4,61486.6%
[
6.5%
-
7.0%
]
6.77%
3,76888.7%
[
7.0%
-
7.5%
]
7.37%
3,14988.5%
[
7.5%
-
8.0%
]
7.91%
1,91098.7%
[
8.0%
-
8.5%
]
8.24%
82591.5%
[
8.5%
-
9.0%
]
8.93%
1,16490.5%
[
9.0%
-
9.5%
]
9.23%
26090.5%
[
9.5%
-
10.0%
]
9.89%
1,29494.1%
[
10.0%
-
10.5%
]
10.17%
1,07290.2%
[
11.0%
-
11.5%
]
11.16%
23387.2%
[
13.0%
-
13.5%
]
13.18%
2,99884.5%
[
13.5%
-
14.0%
]
13.84%
28992.0%
[
16.0%
-
16.5%
]
16.30%
9281.0%
[
16.5%
-
17.0%
]
16.88%
16076.1%
[
19.0%
-
19.5%
]
19.01%
14275.2%
[
19.5%
-
20.0%
]
19.58%
1,14471.8%
[
21.5%
-
22.0%
]
21.98%
32375.2%
[
44.5%
-
45.0%
]
44.74%
3884.2%
[
99.5%
-
100.0%
]
100.00%
2100.0%