Yuman 3 or more Vehicles in Household

COMPARE

Yuman
Race
Ancestry
AfghanAfricanAlaska NativeAlaskan AthabascanAlbanianAleutAlsatianAmericanApacheArabArapahoArgentineanArmenianAssyrian/Chaldean/SyriacAustralianAustrianBahamianBangladeshiBarbadianBasqueBelgianBelizeanBermudanBhutaneseBlackfeetBolivianBrazilianBritishBritish West IndianBulgarianBurmeseCajunCambodianCanadianCape VerdeanCarpatho RusynCelticCentral AmericanCentral American IndianCherokeeCheyenneChickasawChileanChineseChippewaChoctawColombianColvilleComancheCosta RicanCreeCreekCroatianCrowCubanCypriotCzechCzechoslovakianDanishDelawareDominicanDutchDutch West IndianEastern EuropeanEcuadorianEgyptianEnglishEstonianEthiopianEuropeanFijianFilipinoFinnishFrenchFrench American IndianFrench CanadianGermanGerman RussianGhanaianGreekGuamanian/ChamorroGuatemalanGuyaneseHaitianHmongHonduranHopiHoumaHungarianIcelanderIndian (Asian)IndonesianInupiatIranianIraqiIrishIroquoisIsraeliItalianJamaicanJapaneseJordanianKenyanKiowaKoreanLaotianLatvianLebaneseLiberianLithuanianLumbeeLuxembourgerMacedonianMalaysianMalteseMarshalleseMenomineeMexicanMexican American IndianMongolianMoroccanNative HawaiianNavajoNepaleseNew ZealanderNicaraguanNigerianNorthern EuropeanNorwegianOkinawanOsageOttawaPaiutePakistaniPalestinianPanamanianParaguayanPennsylvania GermanPeruvianPimaPolishPortuguesePotawatomiPuebloPuerto RicanPuget Sound SalishRomanianRussianSalvadoranSamoanScandinavianScotch-IrishScottishSeminoleSenegaleseSerbianShoshoneSierra LeoneanSiouxSlavicSlovakSloveneSomaliSouth AfricanSouth AmericanSouth American IndianSoviet UnionSpaniardSpanishSpanish AmericanSpanish American IndianSri LankanSubsaharan AfricanSudaneseSwedishSwissSyrianTaiwaneseThaiTlingit-HaidaTohono O'OdhamTonganTrinidadian and TobagonianTsimshianTurkishU.S. Virgin IslanderUgandanUkrainianUruguayanUteVenezuelanVietnameseWelshWest IndianYakamaYaquiYugoslavianYumanYup'ikZimbabwean
Immigration
NonimmigrantsImmigrantsAfghanistanAfricaAlbaniaArgentinaArmeniaAsiaAustraliaAustriaBahamasBangladeshBarbadosBelarusBelgiumBelizeBoliviaBosnia and HerzegovinaBrazilBulgariaBurma/MyanmarCabo VerdeCambodiaCameroonCanadaCaribbeanCentral AmericaChileChinaColombiaCongoCosta RicaCroatiaCubaCzechoslovakiaDenmarkDominicaDominican RepublicEastern AfricaEastern AsiaEastern EuropeEcuadorEgyptEl SalvadorEnglandEritreaEthiopiaEuropeFijiFranceGermanyGhanaGreeceGrenadaGuatemalaGuyanaHaitiHondurasHong KongHungaryIndiaIndonesiaIranIraqIrelandIsraelItalyJamaicaJapanJordanKazakhstanKenyaKoreaKuwaitLaosLatin AmericaLatviaLebanonLiberiaLithuaniaMalaysiaMexicoMicronesiaMiddle AfricaMoldovaMoroccoNepalNetherlandsNicaraguaNigeriaNorth AmericaNorth MacedoniaNorthern AfricaNorthern EuropeNorwayOceaniaPakistanPanamaPeruPhilippinesPolandPortugalRomaniaRussiaSaudi ArabiaScotlandSenegalSerbiaSierra LeoneSingaporeSomaliaSouth AfricaSouth AmericaSouth Central AsiaSouth Eastern AsiaSouthern EuropeSpainSri LankaSt. Vincent and the GrenadinesSudanSwedenSwitzerlandSyriaTaiwanThailandTrinidad and TobagoTurkeyUgandaUkraineUruguayUzbekistanVenezuelaVietnamWest IndiesWestern AfricaWestern AsiaWestern EuropeYemenZaireZimbabweAzores
Select to Compare
Race
Ancestry
AfghanAfricanAlaska NativeAlaskan AthabascanAlbanianAleutAlsatianAmericanApacheArabArapahoArgentineanArmenianAssyrian/Chaldean/SyriacAustralianAustrianBahamianBangladeshiBarbadianBasqueBelgianBelizeanBermudanBhutaneseBlackfeetBolivianBrazilianBritishBritish West IndianBulgarianBurmeseCajunCambodianCanadianCape VerdeanCarpatho RusynCelticCentral AmericanCentral American IndianCherokeeCheyenneChickasawChileanChineseChippewaChoctawColombianColvilleComancheCosta RicanCreeCreekCroatianCrowCubanCypriotCzechCzechoslovakianDanishDelawareDominicanDutchDutch West IndianEastern EuropeanEcuadorianEgyptianEnglishEstonianEthiopianEuropeanFijianFilipinoFinnishFrenchFrench American IndianFrench CanadianGermanGerman RussianGhanaianGreekGuamanian/ChamorroGuatemalanGuyaneseHaitianHmongHonduranHopiHoumaHungarianIcelanderIndian (Asian)IndonesianInupiatIranianIraqiIrishIroquoisIsraeliItalianJamaicanJapaneseJordanianKenyanKiowaKoreanLaotianLatvianLebaneseLiberianLithuanianLumbeeLuxembourgerMacedonianMalaysianMalteseMarshalleseMenomineeMexicanMexican American IndianMongolianMoroccanNative HawaiianNavajoNepaleseNew ZealanderNicaraguanNigerianNorthern EuropeanNorwegianOkinawanOsageOttawaPaiutePakistaniPalestinianPanamanianParaguayanPennsylvania GermanPeruvianPimaPolishPortuguesePotawatomiPuebloPuerto RicanPuget Sound SalishRomanianRussianSalvadoranSamoanScandinavianScotch-IrishScottishSeminoleSenegaleseSerbianShoshoneSierra LeoneanSiouxSlavicSlovakSloveneSomaliSouth AfricanSouth AmericanSouth American IndianSoviet UnionSpaniardSpanishSpanish AmericanSpanish American IndianSri LankanSubsaharan AfricanSudaneseSwedishSwissSyrianTaiwaneseThaiTlingit-HaidaTohono O'OdhamTonganTrinidadian and TobagonianTsimshianTurkishU.S. Virgin IslanderUgandanUkrainianUruguayanUteVenezuelanVietnameseWelshWest IndianYakamaYaquiYugoslavianYup'ikZimbabwean
Immigration
NonimmigrantsImmigrantsAfghanistanAfricaAlbaniaArgentinaArmeniaAsiaAustraliaAustriaBahamasBangladeshBarbadosBelarusBelgiumBelizeBoliviaBosnia and HerzegovinaBrazilBulgariaBurma/MyanmarCabo VerdeCambodiaCameroonCanadaCaribbeanCentral AmericaChileChinaColombiaCongoCosta RicaCroatiaCubaCzechoslovakiaDenmarkDominicaDominican RepublicEastern AfricaEastern AsiaEastern EuropeEcuadorEgyptEl SalvadorEnglandEritreaEthiopiaEuropeFijiFranceGermanyGhanaGreeceGrenadaGuatemalaGuyanaHaitiHondurasHong KongHungaryIndiaIndonesiaIranIraqIrelandIsraelItalyJamaicaJapanJordanKazakhstanKenyaKoreaKuwaitLaosLatin AmericaLatviaLebanonLiberiaLithuaniaMalaysiaMexicoMicronesiaMiddle AfricaMoldovaMoroccoNepalNetherlandsNicaraguaNigeriaNorth AmericaNorth MacedoniaNorthern AfricaNorthern EuropeNorwayOceaniaPakistanPanamaPeruPhilippinesPolandPortugalRomaniaRussiaSaudi ArabiaScotlandSenegalSerbiaSierra LeoneSingaporeSomaliaSouth AfricaSouth AmericaSouth Central AsiaSouth Eastern AsiaSouthern EuropeSpainSri LankaSt. Vincent and the GrenadinesSudanSwedenSwitzerlandSyriaTaiwanThailandTrinidad and TobagoTurkeyUgandaUkraineUruguayUzbekistanVenezuelaVietnamWest IndiesWestern AfricaWestern AsiaWestern EuropeYemenZaireZimbabweAzores
3 or more Vehicles in Household
Income
Poverty
Unemployment
Labor Participation
Family Structure
Vehicle Availability
Education Level
Disability

Yuman 3 or more Vehicles in Household
Good

19.9%
3+ VEHICLES AVAILABLE
75.6/ 100
METRIC RATING
153rd/ 347
METRIC RANK

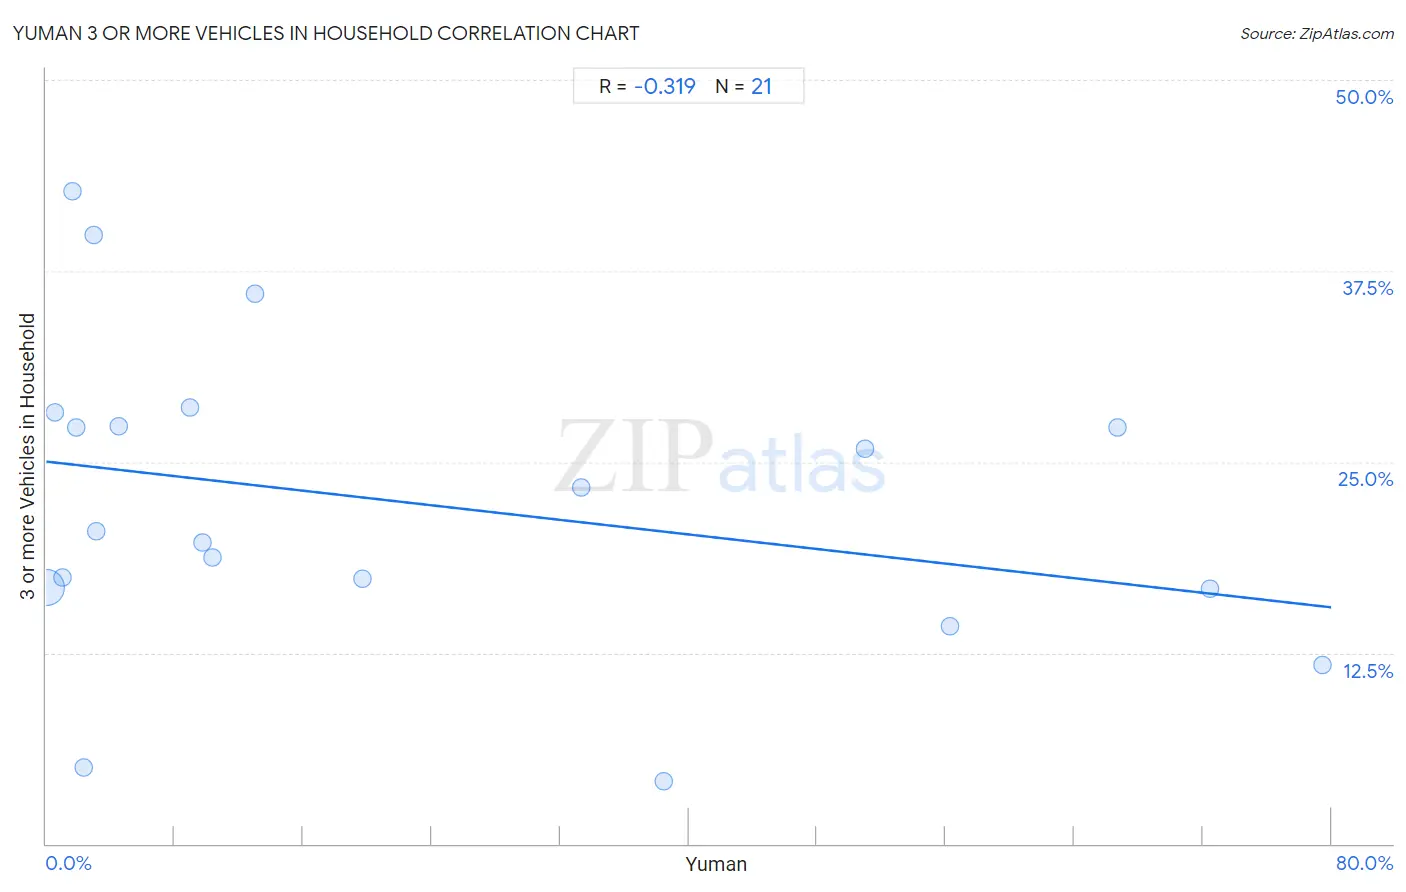
Yuman 3 or more Vehicles in Household Correlation Chart

The statistical analysis conducted on geographies consisting of 40,662,835 people shows a mild negative correlation between the proportion of Yuman and percentage of households with 3 or more vehicles available in the United States with a correlation coefficient (R) of -0.319 and weighted average of 19.9%. On average, for every 1% (one percent) increase in Yuman within a typical geography, there is a decrease of 0.12% in percentage of households with 3 or more vehicles available.
Yuman 3 or more Vehicles in Household
It is essential to understand that the correlation between the percentage of Yuman and percentage of households with 3 or more vehicles available does not imply a direct cause-and-effect relationship. It remains uncertain whether the presence of Yuman influences an upward or downward trend in the level of percentage of households with 3 or more vehicles available within an area, or if Yuman simply ended up residing in those areas with higher or lower levels of percentage of households with 3 or more vehicles available due to other factors.

Demographics Similar to Yuman by 3 or more Vehicles in Household

In terms of 3 or more vehicles in household, the demographic groups most similar to Yuman are Immigrants from Jordan (19.9%, a difference of 0.060%), Tlingit-Haida (19.9%, a difference of 0.22%), Thai (19.8%, a difference of 0.43%), Lebanese (20.0%, a difference of 0.44%), and Hungarian (19.8%, a difference of 0.48%).
DemographicsRating | Rank3 or more Vehicles in Household
Australians
83.6
/100
|
#146
Excellent
20.1%
Slovaks
83.0
/100
|
#147
Excellent
20.1%
Guatemalans
82.6
/100
|
#148
Excellent
20.1%
Immigrants from Iran
80.9
/100
|
#149
Excellent
20.0%
Immigrants
80.8
/100
|
#150
Excellent
20.0%
Taiwanese
80.6
/100
|
#151
Excellent
20.0%
Lebanese
79.8
/100
|
#152
Good
20.0%
Yuman
75.6
/100
|
#153
Good
19.9%
Immigrants from Jordan
75.0
/100
|
#154
Good
19.9%
Tlingit-Haida
73.4
/100
|
#155
Good
19.9%
Thais
71.1
/100
|
#156
Good
19.8%
Hungarians
70.5
/100
|
#157
Good
19.8%
Armenians
68.8
/100
|
#158
Good
19.8%
Immigrants from Pakistan
68.2
/100
|
#159
Good
19.8%
Immigrants from Lebanon
67.6
/100
|
#160
Good
19.8%

Yuman 3 or more Vehicles in Household Correlation Summary

MeasurementYuman Data3 or more Vehicles in Household Data
Minimum0.022%4.1%
Maximum79.5%42.7%
Range79.5%38.7%
Mean22.7%22.3%
Median9.7%20.5%
Interquartile 25% (IQ1)2.1%16.7%
Interquartile 75% (IQ3)44.7%27.8%
Interquartile Range (IQR)42.6%11.1%
Standard Deviation (Sample)26.8%10.0%
Standard Deviation (Population)26.2%9.8%

Correlation Details

Yuman PercentileSample Size3 or more Vehicles in Household
[
0.0%
-
0.5%
]
0.022%
40,016,77116.8%
[
0.5%
-
1.0%
]
0.52%
507,49328.2%
[
1.0%
-
1.5%
]
1.04%
48,66917.4%
[
1.5%
-
2.0%
]
1.60%
28,99442.7%
[
1.5%
-
2.0%
]
1.84%
3,52927.3%
[
2.0%
-
2.5%
]
2.32%
6895.0%
[
2.5%
-
3.0%
]
2.97%
19,48839.8%
[
3.0%
-
3.5%
]
3.14%
9,10620.5%
[
4.5%
-
5.0%
]
4.53%
9,11927.4%
[
8.5%
-
9.0%
]
8.92%
52728.6%
[
9.5%
-
10.0%
]
9.75%
5,44719.7%
[
10.0%
-
10.5%
]
10.35%
5,06218.7%
[
12.5%
-
13.0%
]
12.98%
36236.0%
[
19.5%
-
20.0%
]
19.71%
1,37017.3%
[
33.0%
-
33.5%
]
33.33%
12023.3%
[
38.0%
-
38.5%
]
38.46%
1044.1%
[
50.5%
-
51.0%
]
50.95%
63025.8%
[
56.0%
-
56.5%
]
56.23%
1,96714.3%
[
66.5%
-
67.0%
]
66.67%
3927.3%
[
72.0%
-
72.5%
]
72.47%
1,86716.7%
[
79.0%
-
79.5%
]
79.49%
1,48211.7%