Yuman Receiving Food Stamps

COMPARE

Yuman
Race
Ancestry
AfghanAfricanAlaska NativeAlaskan AthabascanAlbanianAleutAlsatianAmericanApacheArabArapahoArgentineanArmenianAssyrian/Chaldean/SyriacAustralianAustrianBahamianBangladeshiBarbadianBasqueBelgianBelizeanBermudanBhutaneseBlackfeetBolivianBrazilianBritishBritish West IndianBulgarianBurmeseCajunCambodianCanadianCape VerdeanCarpatho RusynCelticCentral AmericanCentral American IndianCherokeeCheyenneChickasawChileanChineseChippewaChoctawColombianColvilleComancheCosta RicanCreeCreekCroatianCrowCubanCypriotCzechCzechoslovakianDanishDelawareDominicanDutchDutch West IndianEastern EuropeanEcuadorianEgyptianEnglishEstonianEthiopianEuropeanFijianFilipinoFinnishFrenchFrench American IndianFrench CanadianGermanGerman RussianGhanaianGreekGuamanian/ChamorroGuatemalanGuyaneseHaitianHmongHonduranHopiHoumaHungarianIcelanderIndian (Asian)IndonesianInupiatIranianIraqiIrishIroquoisIsraeliItalianJamaicanJapaneseJordanianKenyanKiowaKoreanLaotianLatvianLebaneseLiberianLithuanianLumbeeLuxembourgerMacedonianMalaysianMalteseMarshalleseMenomineeMexicanMexican American IndianMongolianMoroccanNative HawaiianNavajoNepaleseNew ZealanderNicaraguanNigerianNorthern EuropeanNorwegianOkinawanOsageOttawaPaiutePakistaniPalestinianPanamanianParaguayanPennsylvania GermanPeruvianPimaPolishPortuguesePotawatomiPuebloPuerto RicanPuget Sound SalishRomanianRussianSalvadoranSamoanScandinavianScotch-IrishScottishSeminoleSenegaleseSerbianShoshoneSierra LeoneanSiouxSlavicSlovakSloveneSomaliSouth AfricanSouth AmericanSouth American IndianSoviet UnionSpaniardSpanishSpanish AmericanSpanish American IndianSri LankanSubsaharan AfricanSudaneseSwedishSwissSyrianTaiwaneseThaiTlingit-HaidaTohono O'OdhamTonganTrinidadian and TobagonianTsimshianTurkishU.S. Virgin IslanderUgandanUkrainianUruguayanUteVenezuelanVietnameseWelshWest IndianYakamaYaquiYugoslavianYumanYup'ikZimbabwean
Immigration
NonimmigrantsImmigrantsAfghanistanAfricaAlbaniaArgentinaArmeniaAsiaAustraliaAustriaBahamasBangladeshBarbadosBelarusBelgiumBelizeBoliviaBosnia and HerzegovinaBrazilBulgariaBurma/MyanmarCabo VerdeCambodiaCameroonCanadaCaribbeanCentral AmericaChileChinaColombiaCongoCosta RicaCroatiaCubaCzechoslovakiaDenmarkDominicaDominican RepublicEastern AfricaEastern AsiaEastern EuropeEcuadorEgyptEl SalvadorEnglandEritreaEthiopiaEuropeFijiFranceGermanyGhanaGreeceGrenadaGuatemalaGuyanaHaitiHondurasHong KongHungaryIndiaIndonesiaIranIraqIrelandIsraelItalyJamaicaJapanJordanKazakhstanKenyaKoreaKuwaitLaosLatin AmericaLatviaLebanonLiberiaLithuaniaMalaysiaMexicoMicronesiaMiddle AfricaMoldovaMoroccoNepalNetherlandsNicaraguaNigeriaNorth AmericaNorth MacedoniaNorthern AfricaNorthern EuropeNorwayOceaniaPakistanPanamaPeruPhilippinesPolandPortugalRomaniaRussiaSaudi ArabiaScotlandSenegalSerbiaSierra LeoneSingaporeSomaliaSouth AfricaSouth AmericaSouth Central AsiaSouth Eastern AsiaSouthern EuropeSpainSri LankaSt. Vincent and the GrenadinesSudanSwedenSwitzerlandSyriaTaiwanThailandTrinidad and TobagoTurkeyUgandaUkraineUruguayUzbekistanVenezuelaVietnamWest IndiesWestern AfricaWestern AsiaWestern EuropeYemenZaireZimbabweAzores
Select to Compare
Race
Ancestry
AfghanAfricanAlaska NativeAlaskan AthabascanAlbanianAleutAlsatianAmericanApacheArabArapahoArgentineanArmenianAssyrian/Chaldean/SyriacAustralianAustrianBahamianBangladeshiBarbadianBasqueBelgianBelizeanBermudanBhutaneseBlackfeetBolivianBrazilianBritishBritish West IndianBulgarianBurmeseCajunCambodianCanadianCape VerdeanCarpatho RusynCelticCentral AmericanCentral American IndianCherokeeCheyenneChickasawChileanChineseChippewaChoctawColombianColvilleComancheCosta RicanCreeCreekCroatianCrowCubanCypriotCzechCzechoslovakianDanishDelawareDominicanDutchDutch West IndianEastern EuropeanEcuadorianEgyptianEnglishEstonianEthiopianEuropeanFijianFilipinoFinnishFrenchFrench American IndianFrench CanadianGermanGerman RussianGhanaianGreekGuamanian/ChamorroGuatemalanGuyaneseHaitianHmongHonduranHopiHoumaHungarianIcelanderIndian (Asian)IndonesianInupiatIranianIraqiIrishIroquoisIsraeliItalianJamaicanJapaneseJordanianKenyanKiowaKoreanLaotianLatvianLebaneseLiberianLithuanianLumbeeLuxembourgerMacedonianMalaysianMalteseMarshalleseMenomineeMexicanMexican American IndianMongolianMoroccanNative HawaiianNavajoNepaleseNew ZealanderNicaraguanNigerianNorthern EuropeanNorwegianOkinawanOsageOttawaPaiutePakistaniPalestinianPanamanianParaguayanPennsylvania GermanPeruvianPimaPolishPortuguesePotawatomiPuebloPuerto RicanPuget Sound SalishRomanianRussianSalvadoranSamoanScandinavianScotch-IrishScottishSeminoleSenegaleseSerbianShoshoneSierra LeoneanSiouxSlavicSlovakSloveneSomaliSouth AfricanSouth AmericanSouth American IndianSoviet UnionSpaniardSpanishSpanish AmericanSpanish American IndianSri LankanSubsaharan AfricanSudaneseSwedishSwissSyrianTaiwaneseThaiTlingit-HaidaTohono O'OdhamTonganTrinidadian and TobagonianTsimshianTurkishU.S. Virgin IslanderUgandanUkrainianUruguayanUteVenezuelanVietnameseWelshWest IndianYakamaYaquiYugoslavianYup'ikZimbabwean
Immigration
NonimmigrantsImmigrantsAfghanistanAfricaAlbaniaArgentinaArmeniaAsiaAustraliaAustriaBahamasBangladeshBarbadosBelarusBelgiumBelizeBoliviaBosnia and HerzegovinaBrazilBulgariaBurma/MyanmarCabo VerdeCambodiaCameroonCanadaCaribbeanCentral AmericaChileChinaColombiaCongoCosta RicaCroatiaCubaCzechoslovakiaDenmarkDominicaDominican RepublicEastern AfricaEastern AsiaEastern EuropeEcuadorEgyptEl SalvadorEnglandEritreaEthiopiaEuropeFijiFranceGermanyGhanaGreeceGrenadaGuatemalaGuyanaHaitiHondurasHong KongHungaryIndiaIndonesiaIranIraqIrelandIsraelItalyJamaicaJapanJordanKazakhstanKenyaKoreaKuwaitLaosLatin AmericaLatviaLebanonLiberiaLithuaniaMalaysiaMexicoMicronesiaMiddle AfricaMoldovaMoroccoNepalNetherlandsNicaraguaNigeriaNorth AmericaNorth MacedoniaNorthern AfricaNorthern EuropeNorwayOceaniaPakistanPanamaPeruPhilippinesPolandPortugalRomaniaRussiaSaudi ArabiaScotlandSenegalSerbiaSierra LeoneSingaporeSomaliaSouth AfricaSouth AmericaSouth Central AsiaSouth Eastern AsiaSouthern EuropeSpainSri LankaSt. Vincent and the GrenadinesSudanSwedenSwitzerlandSyriaTaiwanThailandTrinidad and TobagoTurkeyUgandaUkraineUruguayUzbekistanVenezuelaVietnamWest IndiesWestern AfricaWestern AsiaWestern EuropeYemenZaireZimbabweAzores
Receiving Food Stamps
Income
Poverty
Unemployment
Labor Participation
Family Structure
Vehicle Availability
Education Level
Disability

Yuman Receiving Food Stamps
Tragic

20.2%
PUBLIC INCOME | FOOD STAMPS
0.0/ 100
METRIC RATING
334th/ 347
METRIC RANK

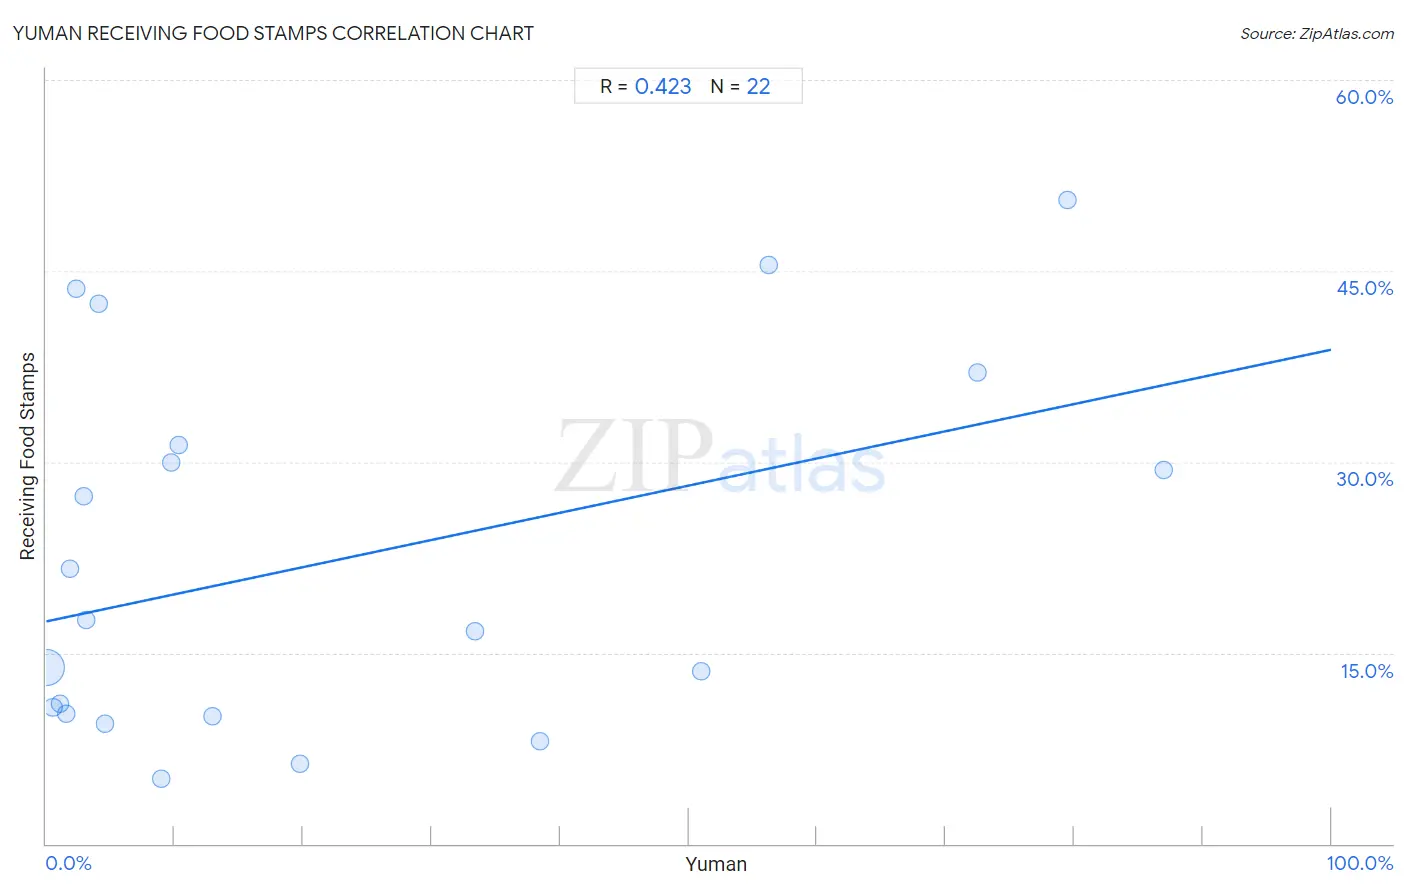
Yuman Receiving Food Stamps Correlation Chart

The statistical analysis conducted on geographies consisting of 40,663,437 people shows a moderate positive correlation between the proportion of Yuman and percentage of population receiving government assistance and/or food stamps in the United States with a correlation coefficient (R) of 0.423 and weighted average of 20.2%. On average, for every 1% (one percent) increase in Yuman within a typical geography, there is an increase of 0.21% in percentage of population receiving government assistance and/or food stamps.
Yuman Receiving Food Stamps
It is essential to understand that the correlation between the percentage of Yuman and percentage of population receiving government assistance and/or food stamps does not imply a direct cause-and-effect relationship. It remains uncertain whether the presence of Yuman influences an upward or downward trend in the level of percentage of population receiving government assistance and/or food stamps within an area, or if Yuman simply ended up residing in those areas with higher or lower levels of percentage of population receiving government assistance and/or food stamps due to other factors.

Demographics Similar to Yuman by Receiving Food Stamps

In terms of receiving food stamps, the demographic groups most similar to Yuman are Inupiat (20.1%, a difference of 0.86%), Pueblo (19.9%, a difference of 1.6%), Immigrants from Cuba (20.8%, a difference of 2.9%), Immigrants from Caribbean (19.6%, a difference of 3.1%), and Navajo (21.1%, a difference of 4.1%).
DemographicsRating | RankReceiving Food Stamps
Apache
0.0
/100
|
#327
Tragic
18.3%
Colville
0.0
/100
|
#328
Tragic
18.3%
Immigrants from Dominica
0.0
/100
|
#329
Tragic
18.4%
Pima
0.0
/100
|
#330
Tragic
19.0%
Immigrants from Caribbean
0.0
/100
|
#331
Tragic
19.6%
Pueblo
0.0
/100
|
#332
Tragic
19.9%
Inupiat
0.0
/100
|
#333
Tragic
20.1%
Yuman
0.0
/100
|
#334
Tragic
20.2%
Immigrants from Cuba
0.0
/100
|
#335
Tragic
20.8%
Navajo
0.0
/100
|
#336
Tragic
21.1%
Cape Verdeans
0.0
/100
|
#337
Tragic
21.1%
Dominicans
0.0
/100
|
#338
Tragic
21.4%
Yakama
0.0
/100
|
#339
Tragic
21.4%
Tohono O'odham
0.0
/100
|
#340
Tragic
21.5%
Hopi
0.0
/100
|
#341
Tragic
21.6%

Yuman Receiving Food Stamps Correlation Summary

MeasurementYuman DataReceiving Food Stamps Data
Minimum0.022%5.1%
Maximum87.0%50.6%
Range86.9%45.5%
Mean22.8%22.3%
Median9.3%17.1%
Interquartile 25% (IQ1)2.3%10.2%
Interquartile 75% (IQ3)38.5%31.3%
Interquartile Range (IQR)36.1%21.1%
Standard Deviation (Sample)28.4%14.3%
Standard Deviation (Population)27.8%14.0%

Correlation Details

Yuman PercentileSample SizeReceiving Food Stamps
[
0.0%
-
0.5%
]
0.022%
40,016,77113.9%
[
0.5%
-
1.0%
]
0.52%
507,49310.7%
[
1.0%
-
1.5%
]
1.04%
48,66911.0%
[
1.5%
-
2.0%
]
1.60%
29,60910.2%
[
1.5%
-
2.0%
]
1.84%
3,52921.6%
[
2.0%
-
2.5%
]
2.32%
68943.6%
[
2.5%
-
3.0%
]
2.97%
19,48827.3%
[
3.0%
-
3.5%
]
3.14%
9,10617.6%
[
4.0%
-
4.5%
]
4.08%
14742.4%
[
4.5%
-
5.0%
]
4.53%
9,1199.4%
[
8.5%
-
9.0%
]
8.92%
5275.1%
[
9.5%
-
10.0%
]
9.75%
5,44730.0%
[
10.0%
-
10.5%
]
10.36%
4,89531.3%
[
12.5%
-
13.0%
]
12.98%
36210.0%
[
19.5%
-
20.0%
]
19.71%
1,3706.3%
[
33.0%
-
33.5%
]
33.33%
12016.7%
[
38.0%
-
38.5%
]
38.46%
1048.1%
[
50.5%
-
51.0%
]
50.95%
63013.6%
[
56.0%
-
56.5%
]
56.23%
1,96745.5%
[
72.0%
-
72.5%
]
72.47%
1,86737.0%
[
79.0%
-
79.5%
]
79.49%
1,48250.6%
[
86.5%
-
87.0%
]
86.96%
4629.4%