Scandinavian 3 or more Vehicles in Household
COMPARE
Scandinavian
Select to Compare
3 or more Vehicles in Household
Scandinavian 3 or more Vehicles in Household
23.6%
3+ VEHICLES AVAILABLE
100.0/ 100
METRIC RATING
23rd/ 347
METRIC RANK
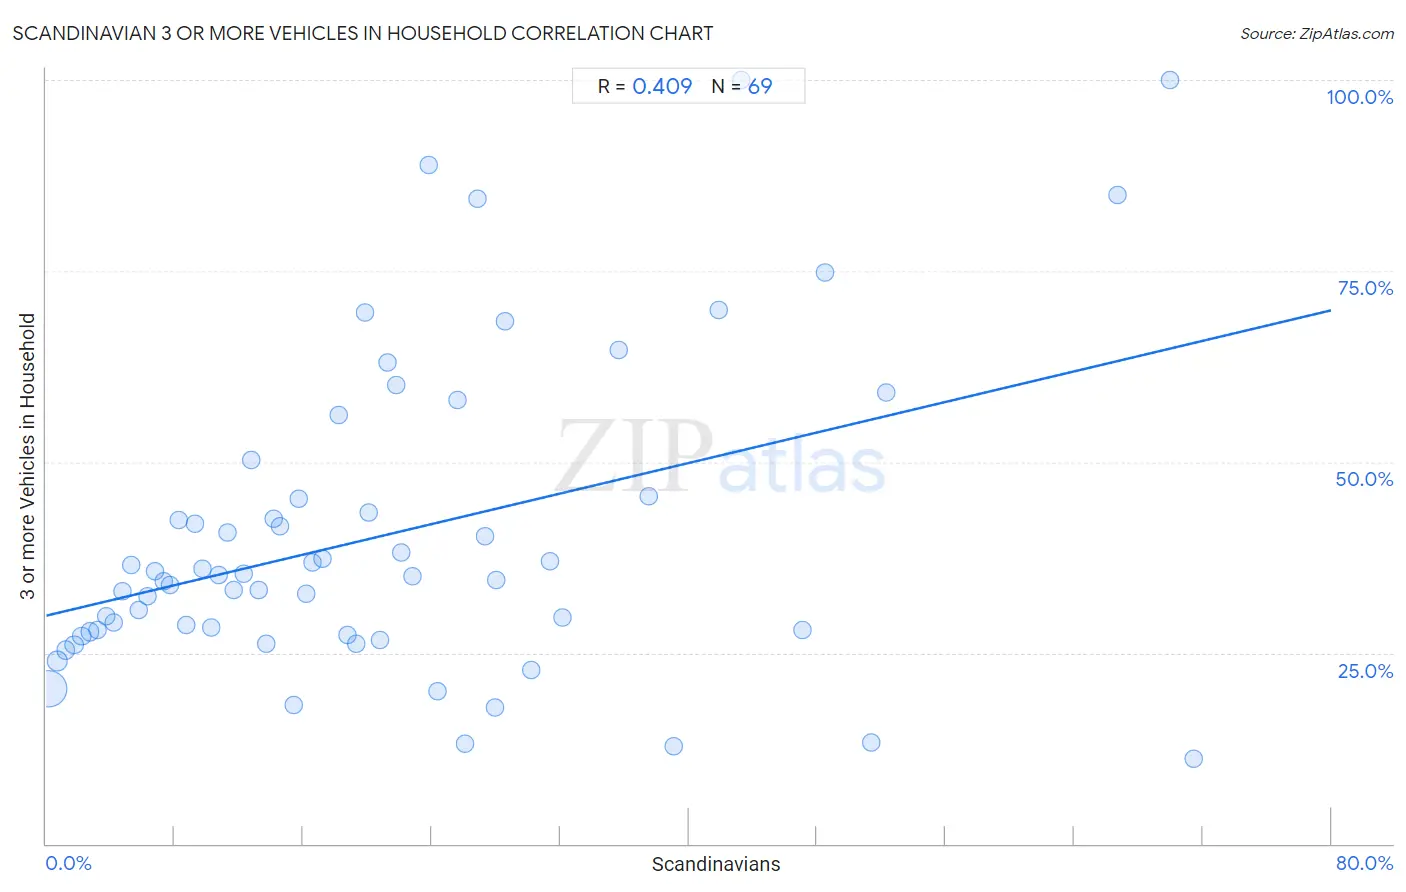
Scandinavian 3 or more Vehicles in Household Correlation Chart
The statistical analysis conducted on geographies consisting of 472,159,399 people shows a moderate positive correlation between the proportion of Scandinavians and percentage of households with 3 or more vehicles available in the United States with a correlation coefficient (R) of 0.409 and weighted average of 23.6%. On average, for every 1% (one percent) increase in Scandinavians within a typical geography, there is an increase of 0.50% in percentage of households with 3 or more vehicles available.
It is essential to understand that the correlation between the percentage of Scandinavians and percentage of households with 3 or more vehicles available does not imply a direct cause-and-effect relationship. It remains uncertain whether the presence of Scandinavians influences an upward or downward trend in the level of percentage of households with 3 or more vehicles available within an area, or if Scandinavians simply ended up residing in those areas with higher or lower levels of percentage of households with 3 or more vehicles available due to other factors.
Demographics Similar to Scandinavians by 3 or more Vehicles in Household
In terms of 3 or more vehicles in household, the demographic groups most similar to Scandinavians are Sri Lankan (23.6%, a difference of 0.26%), Immigrants from Philippines (23.8%, a difference of 0.59%), Immigrants from Vietnam (23.8%, a difference of 0.65%), Paiute (23.8%, a difference of 0.77%), and Immigrants from Central America (23.4%, a difference of 0.77%).
| Demographics | Rating | Rank | 3 or more Vehicles in Household |
| Basques | 100.0 /100 | #16 | Exceptional 24.3% |
| Koreans | 100.0 /100 | #17 | Exceptional 24.1% |
| Norwegians | 100.0 /100 | #18 | Exceptional 23.9% |
| Chinese | 100.0 /100 | #19 | Exceptional 23.9% |
| Paiute | 100.0 /100 | #20 | Exceptional 23.8% |
| Immigrants from Vietnam | 100.0 /100 | #21 | Exceptional 23.8% |
| Immigrants from Philippines | 100.0 /100 | #22 | Exceptional 23.8% |
| Scandinavians | 100.0 /100 | #23 | Exceptional 23.6% |
| Sri Lankans | 100.0 /100 | #24 | Exceptional 23.6% |
| Immigrants from Central America | 100.0 /100 | #25 | Exceptional 23.4% |
| Mexican American Indians | 100.0 /100 | #26 | Exceptional 23.3% |
| Guamanians/Chamorros | 100.0 /100 | #27 | Exceptional 23.2% |
| Lumbee | 100.0 /100 | #28 | Exceptional 23.1% |
| Spanish | 100.0 /100 | #29 | Exceptional 23.1% |
| Immigrants from South Eastern Asia | 100.0 /100 | #30 | Exceptional 23.1% |
Scandinavian 3 or more Vehicles in Household Correlation Summary
| Measurement | Scandinavian Data | 3 or more Vehicles in Household Data |
| Minimum | 0.19% | 11.1% |
| Maximum | 71.4% | 100.0% |
| Range | 71.2% | 88.9% |
| Mean | 21.0% | 40.3% |
| Median | 17.2% | 35.0% |
| Interquartile 25% (IQ1) | 8.5% | 27.5% |
| Interquartile 75% (IQ3) | 28.0% | 45.3% |
| Interquartile Range (IQR) | 19.5% | 17.8% |
| Standard Deviation (Sample) | 16.7% | 20.4% |
| Standard Deviation (Population) | 16.6% | 20.2% |
Correlation Details
| Scandinavian Percentile | Sample Size | 3 or more Vehicles in Household |
[ 0.0% - 0.5% ] 0.19% | 375,487,806 | 20.4% |
[ 0.5% - 1.0% ] 0.70% | 60,057,281 | 23.9% |
[ 1.0% - 1.5% ] 1.22% | 18,916,175 | 25.3% |
[ 1.5% - 2.0% ] 1.73% | 8,423,186 | 26.0% |
[ 2.0% - 2.5% ] 2.21% | 4,756,653 | 27.2% |
[ 2.5% - 3.0% ] 2.73% | 2,337,586 | 27.8% |
[ 3.0% - 3.5% ] 3.21% | 893,233 | 28.0% |
[ 3.5% - 4.0% ] 3.72% | 485,014 | 29.7% |
[ 4.0% - 4.5% ] 4.24% | 194,915 | 29.0% |
[ 4.5% - 5.0% ] 4.74% | 122,604 | 33.0% |
[ 5.0% - 5.5% ] 5.25% | 100,649 | 36.4% |
[ 5.5% - 6.0% ] 5.75% | 109,966 | 30.6% |
[ 6.0% - 6.5% ] 6.27% | 53,287 | 32.4% |
[ 6.5% - 7.0% ] 6.76% | 56,903 | 35.7% |
[ 7.0% - 7.5% ] 7.29% | 32,255 | 34.4% |
[ 7.5% - 8.0% ] 7.71% | 22,519 | 33.8% |
[ 8.0% - 8.5% ] 8.25% | 19,965 | 42.4% |
[ 8.5% - 9.0% ] 8.71% | 14,653 | 28.7% |
[ 9.0% - 9.5% ] 9.23% | 7,642 | 42.0% |
[ 9.5% - 10.0% ] 9.72% | 6,386 | 36.0% |
[ 10.0% - 10.5% ] 10.25% | 12,868 | 28.3% |
[ 10.5% - 11.0% ] 10.74% | 6,146 | 35.1% |
[ 11.0% - 11.5% ] 11.28% | 1,897 | 40.7% |
[ 11.5% - 12.0% ] 11.66% | 2,934 | 33.3% |
[ 12.0% - 12.5% ] 12.27% | 3,536 | 35.3% |
[ 12.5% - 13.0% ] 12.74% | 1,350 | 50.2% |
[ 13.0% - 13.5% ] 13.19% | 614 | 33.2% |
[ 13.5% - 14.0% ] 13.68% | 1,447 | 26.3% |
[ 14.0% - 14.5% ] 14.13% | 4,472 | 42.5% |
[ 14.5% - 15.0% ] 14.56% | 4,478 | 41.6% |
[ 15.0% - 15.5% ] 15.38% | 741 | 18.1% |
[ 15.5% - 16.0% ] 15.70% | 1,369 | 45.1% |
[ 16.0% - 16.5% ] 16.19% | 105 | 32.8% |
[ 16.5% - 17.0% ] 16.60% | 3,874 | 36.7% |
[ 17.0% - 17.5% ] 17.23% | 2,240 | 37.2% |
[ 18.0% - 18.5% ] 18.21% | 2,164 | 56.2% |
[ 18.5% - 19.0% ] 18.75% | 128 | 27.3% |
[ 19.0% - 19.5% ] 19.33% | 150 | 26.3% |
[ 19.5% - 20.0% ] 19.86% | 438 | 69.6% |
[ 20.0% - 20.5% ] 20.10% | 960 | 43.4% |
[ 20.5% - 21.0% ] 20.80% | 524 | 26.7% |
[ 21.0% - 21.5% ] 21.27% | 489 | 63.0% |
[ 21.5% - 22.0% ] 21.81% | 1,412 | 60.0% |
[ 22.0% - 22.5% ] 22.10% | 448 | 38.1% |
[ 22.5% - 23.0% ] 22.83% | 184 | 35.0% |
[ 23.5% - 24.0% ] 23.81% | 21 | 88.9% |
[ 24.0% - 24.5% ] 24.32% | 37 | 20.0% |
[ 25.5% - 26.0% ] 25.58% | 215 | 58.1% |
[ 26.0% - 26.5% ] 26.09% | 46 | 13.0% |
[ 26.5% - 27.0% ] 26.86% | 1,627 | 84.4% |
[ 27.0% - 27.5% ] 27.32% | 388 | 40.3% |
[ 27.5% - 28.0% ] 27.91% | 43 | 17.9% |
[ 28.0% - 28.5% ] 28.03% | 603 | 34.6% |
[ 28.5% - 29.0% ] 28.57% | 28 | 68.4% |
[ 30.0% - 30.5% ] 30.23% | 311 | 22.7% |
[ 31.0% - 31.5% ] 31.37% | 255 | 37.0% |
[ 32.0% - 32.5% ] 32.14% | 672 | 29.6% |
[ 35.5% - 36.0% ] 35.63% | 87 | 64.7% |
[ 37.0% - 37.5% ] 37.50% | 16 | 45.5% |
[ 39.0% - 39.5% ] 39.10% | 156 | 12.8% |
[ 41.5% - 42.0% ] 41.90% | 179 | 69.8% |
[ 43.0% - 43.5% ] 43.27% | 312 | 100.0% |
[ 47.0% - 47.5% ] 47.06% | 51 | 28.0% |
[ 48.0% - 48.5% ] 48.49% | 299 | 74.8% |
[ 51.0% - 51.5% ] 51.35% | 37 | 13.3% |
[ 52.0% - 52.5% ] 52.27% | 88 | 59.1% |
[ 66.5% - 67.0% ] 66.67% | 87 | 85.0% |
[ 69.5% - 70.0% ] 69.93% | 153 | 100.0% |
[ 71.0% - 71.5% ] 71.43% | 42 | 11.1% |