Scandinavian Married-Couple Family Poverty

COMPARE

Scandinavian
Race
Ancestry
AfghanAfricanAlaska NativeAlaskan AthabascanAlbanianAleutAlsatianAmericanApacheArabArapahoArgentineanArmenianAssyrian/Chaldean/SyriacAustralianAustrianBahamianBangladeshiBarbadianBasqueBelgianBelizeanBermudanBhutaneseBlackfeetBolivianBrazilianBritishBritish West IndianBulgarianBurmeseCajunCambodianCanadianCape VerdeanCarpatho RusynCelticCentral AmericanCentral American IndianCherokeeCheyenneChickasawChileanChineseChippewaChoctawColombianColvilleComancheCosta RicanCreeCreekCroatianCrowCubanCypriotCzechCzechoslovakianDanishDelawareDominicanDutchDutch West IndianEastern EuropeanEcuadorianEgyptianEnglishEstonianEthiopianEuropeanFijianFilipinoFinnishFrenchFrench American IndianFrench CanadianGermanGerman RussianGhanaianGreekGuamanian/ChamorroGuatemalanGuyaneseHaitianHmongHonduranHopiHoumaHungarianIcelanderIndian (Asian)IndonesianInupiatIranianIraqiIrishIroquoisIsraeliItalianJamaicanJapaneseJordanianKenyanKiowaKoreanLaotianLatvianLebaneseLiberianLithuanianLumbeeLuxembourgerMacedonianMalaysianMalteseMarshalleseMenomineeMexicanMexican American IndianMongolianMoroccanNative HawaiianNavajoNepaleseNew ZealanderNicaraguanNigerianNorthern EuropeanNorwegianOkinawanOsageOttawaPaiutePakistaniPalestinianPanamanianParaguayanPennsylvania GermanPeruvianPimaPolishPortuguesePotawatomiPuebloPuerto RicanPuget Sound SalishRomanianRussianSalvadoranSamoanScandinavianScotch-IrishScottishSeminoleSenegaleseSerbianShoshoneSierra LeoneanSiouxSlavicSlovakSloveneSomaliSouth AfricanSouth AmericanSouth American IndianSoviet UnionSpaniardSpanishSpanish AmericanSpanish American IndianSri LankanSubsaharan AfricanSudaneseSwedishSwissSyrianTaiwaneseThaiTlingit-HaidaTohono O'OdhamTonganTrinidadian and TobagonianTsimshianTurkishU.S. Virgin IslanderUgandanUkrainianUruguayanUteVenezuelanVietnameseWelshWest IndianYakamaYaquiYugoslavianYumanYup'ikZimbabwean
Immigration
NonimmigrantsImmigrantsAfghanistanAfricaAlbaniaArgentinaArmeniaAsiaAustraliaAustriaBahamasBangladeshBarbadosBelarusBelgiumBelizeBoliviaBosnia and HerzegovinaBrazilBulgariaBurma/MyanmarCabo VerdeCambodiaCameroonCanadaCaribbeanCentral AmericaChileChinaColombiaCongoCosta RicaCroatiaCubaCzechoslovakiaDenmarkDominicaDominican RepublicEastern AfricaEastern AsiaEastern EuropeEcuadorEgyptEl SalvadorEnglandEritreaEthiopiaEuropeFijiFranceGermanyGhanaGreeceGrenadaGuatemalaGuyanaHaitiHondurasHong KongHungaryIndiaIndonesiaIranIraqIrelandIsraelItalyJamaicaJapanJordanKazakhstanKenyaKoreaKuwaitLaosLatin AmericaLatviaLebanonLiberiaLithuaniaMalaysiaMexicoMicronesiaMiddle AfricaMoldovaMoroccoNepalNetherlandsNicaraguaNigeriaNorth AmericaNorth MacedoniaNorthern AfricaNorthern EuropeNorwayOceaniaPakistanPanamaPeruPhilippinesPolandPortugalRomaniaRussiaSaudi ArabiaScotlandSenegalSerbiaSierra LeoneSingaporeSomaliaSouth AfricaSouth AmericaSouth Central AsiaSouth Eastern AsiaSouthern EuropeSpainSri LankaSt. Vincent and the GrenadinesSudanSwedenSwitzerlandSyriaTaiwanThailandTrinidad and TobagoTurkeyUgandaUkraineUruguayUzbekistanVenezuelaVietnamWest IndiesWestern AfricaWestern AsiaWestern EuropeYemenZaireZimbabweAzores
Select to Compare
Race
Ancestry
AfghanAfricanAlaska NativeAlaskan AthabascanAlbanianAleutAlsatianAmericanApacheArabArapahoArgentineanArmenianAssyrian/Chaldean/SyriacAustralianAustrianBahamianBangladeshiBarbadianBasqueBelgianBelizeanBermudanBhutaneseBlackfeetBolivianBrazilianBritishBritish West IndianBulgarianBurmeseCajunCambodianCanadianCape VerdeanCarpatho RusynCelticCentral AmericanCentral American IndianCherokeeCheyenneChickasawChileanChineseChippewaChoctawColombianColvilleComancheCosta RicanCreeCreekCroatianCrowCubanCypriotCzechCzechoslovakianDanishDelawareDominicanDutchDutch West IndianEastern EuropeanEcuadorianEgyptianEnglishEstonianEthiopianEuropeanFijianFilipinoFinnishFrenchFrench American IndianFrench CanadianGermanGerman RussianGhanaianGreekGuamanian/ChamorroGuatemalanGuyaneseHaitianHmongHonduranHopiHoumaHungarianIcelanderIndian (Asian)IndonesianInupiatIranianIraqiIrishIroquoisIsraeliItalianJamaicanJapaneseJordanianKenyanKiowaKoreanLaotianLatvianLebaneseLiberianLithuanianLumbeeLuxembourgerMacedonianMalaysianMalteseMarshalleseMenomineeMexicanMexican American IndianMongolianMoroccanNative HawaiianNavajoNepaleseNew ZealanderNicaraguanNigerianNorthern EuropeanNorwegianOkinawanOsageOttawaPaiutePakistaniPalestinianPanamanianParaguayanPennsylvania GermanPeruvianPimaPolishPortuguesePotawatomiPuebloPuerto RicanPuget Sound SalishRomanianRussianSalvadoranSamoanScotch-IrishScottishSeminoleSenegaleseSerbianShoshoneSierra LeoneanSiouxSlavicSlovakSloveneSomaliSouth AfricanSouth AmericanSouth American IndianSoviet UnionSpaniardSpanishSpanish AmericanSpanish American IndianSri LankanSubsaharan AfricanSudaneseSwedishSwissSyrianTaiwaneseThaiTlingit-HaidaTohono O'OdhamTonganTrinidadian and TobagonianTsimshianTurkishU.S. Virgin IslanderUgandanUkrainianUruguayanUteVenezuelanVietnameseWelshWest IndianYakamaYaquiYugoslavianYumanYup'ikZimbabwean
Immigration
NonimmigrantsImmigrantsAfghanistanAfricaAlbaniaArgentinaArmeniaAsiaAustraliaAustriaBahamasBangladeshBarbadosBelarusBelgiumBelizeBoliviaBosnia and HerzegovinaBrazilBulgariaBurma/MyanmarCabo VerdeCambodiaCameroonCanadaCaribbeanCentral AmericaChileChinaColombiaCongoCosta RicaCroatiaCubaCzechoslovakiaDenmarkDominicaDominican RepublicEastern AfricaEastern AsiaEastern EuropeEcuadorEgyptEl SalvadorEnglandEritreaEthiopiaEuropeFijiFranceGermanyGhanaGreeceGrenadaGuatemalaGuyanaHaitiHondurasHong KongHungaryIndiaIndonesiaIranIraqIrelandIsraelItalyJamaicaJapanJordanKazakhstanKenyaKoreaKuwaitLaosLatin AmericaLatviaLebanonLiberiaLithuaniaMalaysiaMexicoMicronesiaMiddle AfricaMoldovaMoroccoNepalNetherlandsNicaraguaNigeriaNorth AmericaNorth MacedoniaNorthern AfricaNorthern EuropeNorwayOceaniaPakistanPanamaPeruPhilippinesPolandPortugalRomaniaRussiaSaudi ArabiaScotlandSenegalSerbiaSierra LeoneSingaporeSomaliaSouth AfricaSouth AmericaSouth Central AsiaSouth Eastern AsiaSouthern EuropeSpainSri LankaSt. Vincent and the GrenadinesSudanSwedenSwitzerlandSyriaTaiwanThailandTrinidad and TobagoTurkeyUgandaUkraineUruguayUzbekistanVenezuelaVietnamWest IndiesWestern AfricaWestern AsiaWestern EuropeYemenZaireZimbabweAzores
Married-Couple Family Poverty
Income
Poverty
Unemployment
Labor Participation
Family Structure
Vehicle Availability
Education Level
Disability

Scandinavian Married-Couple Family Poverty
Exceptional

4.1%
POVERTY | MARRIED-COUPLE FAMILIES
99.9/ 100
METRIC RATING
28th/ 347
METRIC RANK

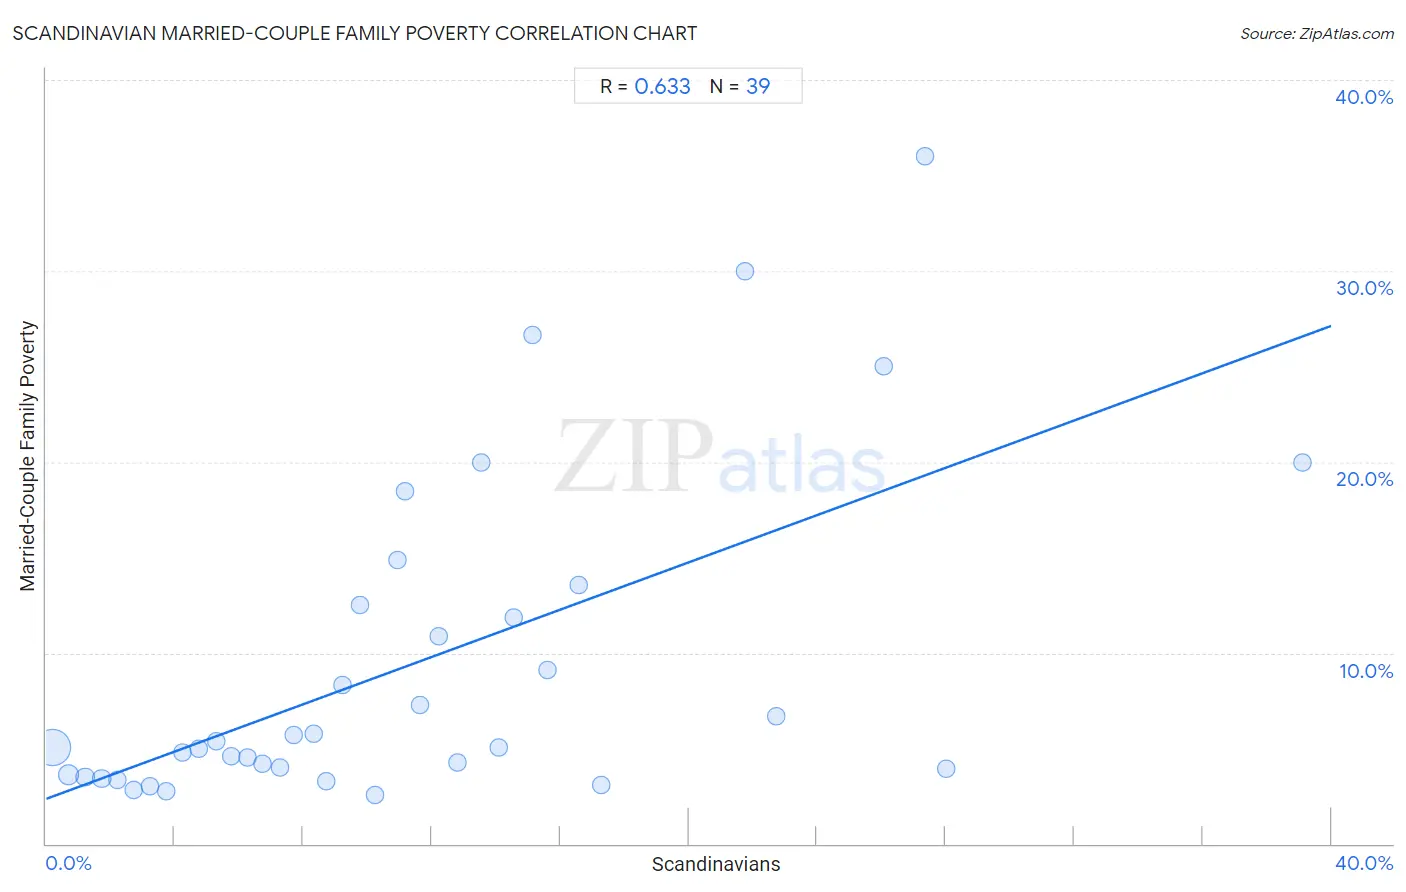
Scandinavian Married-Couple Family Poverty Correlation Chart

The statistical analysis conducted on geographies consisting of 465,332,033 people shows a significant positive correlation between the proportion of Scandinavians and poverty level among married-couple families in the United States with a correlation coefficient (R) of 0.633 and weighted average of 4.1%. On average, for every 1% (one percent) increase in Scandinavians within a typical geography, there is an increase of 0.62% in poverty level among married-couple families.
Scandinavian Married-Couple Family Poverty
It is essential to understand that the correlation between the percentage of Scandinavians and poverty level among married-couple families does not imply a direct cause-and-effect relationship. It remains uncertain whether the presence of Scandinavians influences an upward or downward trend in the level of poverty level among married-couple families within an area, or if Scandinavians simply ended up residing in those areas with higher or lower levels of poverty level among married-couple families due to other factors.

Demographics Similar to Scandinavians by Married-Couple Family Poverty

In terms of married-couple family poverty, the demographic groups most similar to Scandinavians are Immigrants from Scotland (4.2%, a difference of 0.040%), Danish (4.1%, a difference of 0.11%), Cypriot (4.1%, a difference of 0.22%), Finnish (4.2%, a difference of 0.28%), and Estonian (4.2%, a difference of 0.36%).
DemographicsRating | RankMarried-Couple Family Poverty
Zimbabweans
99.9
/100
|
#21
Exceptional
4.1%
Immigrants from Singapore
99.9
/100
|
#22
Exceptional
4.1%
Bhutanese
99.9
/100
|
#23
Exceptional
4.1%
Eastern Europeans
99.9
/100
|
#24
Exceptional
4.1%
Immigrants from Taiwan
99.9
/100
|
#25
Exceptional
4.1%
Cypriots
99.9
/100
|
#26
Exceptional
4.1%
Danes
99.9
/100
|
#27
Exceptional
4.1%
Scandinavians
99.9
/100
|
#28
Exceptional
4.1%
Immigrants from Scotland
99.9
/100
|
#29
Exceptional
4.2%
Finns
99.9
/100
|
#30
Exceptional
4.2%
Estonians
99.9
/100
|
#31
Exceptional
4.2%
Greeks
99.9
/100
|
#32
Exceptional
4.2%
Irish
99.9
/100
|
#33
Exceptional
4.2%
Dutch
99.9
/100
|
#34
Exceptional
4.2%
Europeans
99.9
/100
|
#35
Exceptional
4.2%

Scandinavian Married-Couple Family Poverty Correlation Summary

MeasurementScandinavian DataMarried-Couple Family Poverty Data
Minimum0.19%2.5%
Maximum39.1%36.0%
Range38.9%33.5%
Mean11.3%9.3%
Median9.8%5.1%
Interquartile 25% (IQ1)4.7%3.6%
Interquartile 75% (IQ3)15.1%12.5%
Interquartile Range (IQR)10.4%8.9%
Standard Deviation (Sample)8.7%8.5%
Standard Deviation (Population)8.6%8.4%

Correlation Details

Scandinavian PercentileSample SizeMarried-Couple Family Poverty
[
0.0%
-
0.5%
]
0.19%
372,048,6805.1%
[
0.5%
-
1.0%
]
0.70%
58,574,4073.6%
[
1.0%
-
1.5%
]
1.22%
18,134,3123.5%
[
1.5%
-
2.0%
]
1.73%
8,065,9553.4%
[
2.0%
-
2.5%
]
2.21%
4,520,6003.3%
[
2.5%
-
3.0%
]
2.73%
2,210,0832.8%
[
3.0%
-
3.5%
]
3.21%
801,0403.0%
[
3.5%
-
4.0%
]
3.73%
396,1822.7%
[
4.0%
-
4.5%
]
4.23%
147,8414.8%
[
4.5%
-
5.0%
]
4.75%
101,3565.0%
[
5.0%
-
5.5%
]
5.28%
77,7235.4%
[
5.5%
-
6.0%
]
5.75%
78,5444.6%
[
6.0%
-
6.5%
]
6.28%
36,1354.5%
[
6.5%
-
7.0%
]
6.75%
38,0684.2%
[
7.0%
-
7.5%
]
7.29%
25,2324.0%
[
7.5%
-
8.0%
]
7.70%
14,2805.7%
[
8.0%
-
8.5%
]
8.31%
10,1805.8%
[
8.5%
-
9.0%
]
8.71%
11,4533.3%
[
9.0%
-
9.5%
]
9.22%
5,9468.3%
[
9.5%
-
10.0%
]
9.77%
3,34812.5%
[
10.0%
-
10.5%
]
10.25%
11,6172.5%
[
10.5%
-
11.0%
]
10.93%
30214.9%
[
11.0%
-
11.5%
]
11.17%
19718.5%
[
11.5%
-
12.0%
]
11.63%
1,1617.2%
[
12.0%
-
12.5%
]
12.23%
2,46210.9%
[
12.5%
-
13.0%
]
12.81%
4844.3%
[
13.5%
-
14.0%
]
13.55%
15520.0%
[
14.0%
-
14.5%
]
14.08%
3,5505.1%
[
14.5%
-
15.0%
]
14.55%
4,21911.9%
[
15.0%
-
15.5%
]
15.13%
11926.7%
[
15.5%
-
16.0%
]
15.61%
2059.1%
[
16.5%
-
17.0%
]
16.59%
3,01413.6%
[
17.0%
-
17.5%
]
17.26%
1,6803.1%
[
21.5%
-
22.0%
]
21.75%
51530.0%
[
22.5%
-
23.0%
]
22.73%
886.7%
[
26.0%
-
26.5%
]
26.09%
4625.0%
[
27.0%
-
27.5%
]
27.37%
9536.0%
[
28.0%
-
28.5%
]
28.03%
6033.9%
[
39.0%
-
39.5%
]
39.10%
15620.0%