Scandinavian vs Immigrants from Nepal Married-couple Households

COMPARE

Scandinavian
Race
Ancestry
AfghanAfricanAlaska NativeAlaskan AthabascanAlbanianAleutAlsatianAmericanApacheArabArapahoArgentineanArmenianAssyrian/Chaldean/SyriacAustralianAustrianBahamianBangladeshiBarbadianBasqueBelgianBelizeanBermudanBhutaneseBlackfeetBolivianBrazilianBritishBritish West IndianBulgarianBurmeseCajunCambodianCanadianCape VerdeanCarpatho RusynCelticCentral AmericanCentral American IndianCherokeeCheyenneChickasawChileanChineseChippewaChoctawColombianColvilleComancheCosta RicanCreeCreekCroatianCrowCubanCypriotCzechCzechoslovakianDanishDelawareDominicanDutchDutch West IndianEastern EuropeanEcuadorianEgyptianEnglishEstonianEthiopianEuropeanFijianFilipinoFinnishFrenchFrench American IndianFrench CanadianGermanGerman RussianGhanaianGreekGuamanian/ChamorroGuatemalanGuyaneseHaitianHmongHonduranHopiHoumaHungarianIcelanderIndian (Asian)IndonesianInupiatIranianIraqiIrishIroquoisIsraeliItalianJamaicanJapaneseJordanianKenyanKiowaKoreanLaotianLatvianLebaneseLiberianLithuanianLumbeeLuxembourgerMacedonianMalaysianMalteseMarshalleseMenomineeMexicanMexican American IndianMongolianMoroccanNative HawaiianNavajoNepaleseNew ZealanderNicaraguanNigerianNorthern EuropeanNorwegianOkinawanOsageOttawaPaiutePakistaniPalestinianPanamanianParaguayanPennsylvania GermanPeruvianPimaPolishPortuguesePotawatomiPuebloPuerto RicanPuget Sound SalishRomanianRussianSalvadoranSamoanScandinavianScotch-IrishScottishSeminoleSenegaleseSerbianShoshoneSierra LeoneanSiouxSlavicSlovakSloveneSomaliSouth AfricanSouth AmericanSouth American IndianSoviet UnionSpaniardSpanishSpanish AmericanSpanish American IndianSri LankanSubsaharan AfricanSudaneseSwedishSwissSyrianTaiwaneseThaiTlingit-HaidaTohono O'OdhamTonganTrinidadian and TobagonianTsimshianTurkishU.S. Virgin IslanderUgandanUkrainianUruguayanUteVenezuelanVietnameseWelshWest IndianYakamaYaquiYugoslavianYumanYup'ikZimbabwean
Immigration
NonimmigrantsImmigrantsAfghanistanAfricaAlbaniaArgentinaArmeniaAsiaAustraliaAustriaBahamasBangladeshBarbadosBelarusBelgiumBelizeBoliviaBosnia and HerzegovinaBrazilBulgariaBurma/MyanmarCabo VerdeCambodiaCameroonCanadaCaribbeanCentral AmericaChileChinaColombiaCongoCosta RicaCroatiaCubaCzechoslovakiaDenmarkDominicaDominican RepublicEastern AfricaEastern AsiaEastern EuropeEcuadorEgyptEl SalvadorEnglandEritreaEthiopiaEuropeFijiFranceGermanyGhanaGreeceGrenadaGuatemalaGuyanaHaitiHondurasHong KongHungaryIndiaIndonesiaIranIraqIrelandIsraelItalyJamaicaJapanJordanKazakhstanKenyaKoreaKuwaitLaosLatin AmericaLatviaLebanonLiberiaLithuaniaMalaysiaMexicoMicronesiaMiddle AfricaMoldovaMoroccoNetherlandsNicaraguaNigeriaNorth AmericaNorth MacedoniaNorthern AfricaNorthern EuropeNorwayOceaniaPakistanPanamaPeruPhilippinesPolandPortugalRomaniaRussiaSaudi ArabiaScotlandSenegalSerbiaSierra LeoneSingaporeSomaliaSouth AfricaSouth AmericaSouth Central AsiaSouth Eastern AsiaSouthern EuropeSpainSri LankaSt. Vincent and the GrenadinesSudanSwedenSwitzerlandSyriaTaiwanThailandTrinidad and TobagoTurkeyUgandaUkraineUruguayUzbekistanVenezuelaVietnamWest IndiesWestern AfricaWestern AsiaWestern EuropeYemenZaireZimbabweAzores
Immigrants from Nepal
Race
Ancestry
AfghanAfricanAlaska NativeAlaskan AthabascanAlbanianAleutAlsatianAmericanApacheArabArapahoArgentineanArmenianAssyrian/Chaldean/SyriacAustralianAustrianBahamianBangladeshiBarbadianBasqueBelgianBelizeanBermudanBhutaneseBlackfeetBolivianBrazilianBritishBritish West IndianBulgarianBurmeseCajunCambodianCanadianCape VerdeanCarpatho RusynCelticCentral AmericanCentral American IndianCherokeeCheyenneChickasawChileanChineseChippewaChoctawColombianColvilleComancheCosta RicanCreeCreekCroatianCrowCubanCypriotCzechCzechoslovakianDanishDelawareDominicanDutchDutch West IndianEastern EuropeanEcuadorianEgyptianEnglishEstonianEthiopianEuropeanFijianFilipinoFinnishFrenchFrench American IndianFrench CanadianGermanGerman RussianGhanaianGreekGuamanian/ChamorroGuatemalanGuyaneseHaitianHmongHonduranHopiHoumaHungarianIcelanderIndian (Asian)IndonesianInupiatIranianIraqiIrishIroquoisIsraeliItalianJamaicanJapaneseJordanianKenyanKiowaKoreanLaotianLatvianLebaneseLiberianLithuanianLumbeeLuxembourgerMacedonianMalaysianMalteseMarshalleseMenomineeMexicanMexican American IndianMongolianMoroccanNative HawaiianNavajoNepaleseNew ZealanderNicaraguanNigerianNorthern EuropeanNorwegianOkinawanOsageOttawaPaiutePakistaniPalestinianPanamanianParaguayanPennsylvania GermanPeruvianPimaPolishPortuguesePotawatomiPuebloPuerto RicanPuget Sound SalishRomanianRussianSalvadoranSamoanScotch-IrishScottishSeminoleSenegaleseSerbianShoshoneSierra LeoneanSiouxSlavicSlovakSloveneSomaliSouth AfricanSouth AmericanSouth American IndianSoviet UnionSpaniardSpanishSpanish AmericanSpanish American IndianSri LankanSubsaharan AfricanSudaneseSwedishSwissSyrianTaiwaneseThaiTlingit-HaidaTohono O'OdhamTonganTrinidadian and TobagonianTsimshianTurkishU.S. Virgin IslanderUgandanUkrainianUruguayanUteVenezuelanVietnameseWelshWest IndianYakamaYaquiYugoslavianYumanYup'ikZimbabwean
Immigration
NonimmigrantsImmigrantsAfghanistanAfricaAlbaniaArgentinaArmeniaAsiaAustraliaAustriaBahamasBangladeshBarbadosBelarusBelgiumBelizeBoliviaBosnia and HerzegovinaBrazilBulgariaBurma/MyanmarCabo VerdeCambodiaCameroonCanadaCaribbeanCentral AmericaChileChinaColombiaCongoCosta RicaCroatiaCubaCzechoslovakiaDenmarkDominicaDominican RepublicEastern AfricaEastern AsiaEastern EuropeEcuadorEgyptEl SalvadorEnglandEritreaEthiopiaEuropeFijiFranceGermanyGhanaGreeceGrenadaGuatemalaGuyanaHaitiHondurasHong KongHungaryIndiaIndonesiaIranIraqIrelandIsraelItalyJamaicaJapanJordanKazakhstanKenyaKoreaKuwaitLaosLatin AmericaLatviaLebanonLiberiaLithuaniaMalaysiaMexicoMicronesiaMiddle AfricaMoldovaMoroccoNepalNetherlandsNicaraguaNigeriaNorth AmericaNorth MacedoniaNorthern AfricaNorthern EuropeNorwayOceaniaPakistanPanamaPeruPhilippinesPolandPortugalRomaniaRussiaSaudi ArabiaScotlandSenegalSerbiaSierra LeoneSingaporeSomaliaSouth AfricaSouth AmericaSouth Central AsiaSouth Eastern AsiaSouthern EuropeSpainSri LankaSt. Vincent and the GrenadinesSudanSwedenSwitzerlandSyriaTaiwanThailandTrinidad and TobagoTurkeyUgandaUkraineUruguayUzbekistanVenezuelaVietnamWest IndiesWestern AfricaWestern AsiaWestern EuropeYemenZaireZimbabweAzores
Married-couple Households
Income
Poverty
Unemployment
Labor Participation
Family Structure
Vehicle Availability
Education Level
Disability

Married-couple Households Comparison

Scandinavians

Immigrants from Nepal

Exceptional
Tragic
49.6%
MARRIED-COUPLE HOUSEHOLDS
99.9/ 100
METRIC RATING
20th/ 347
METRIC RANK
45.2%
MARRIED-COUPLE HOUSEHOLDS
5.6/ 100
METRIC RATING
215th/ 347
METRIC RANK

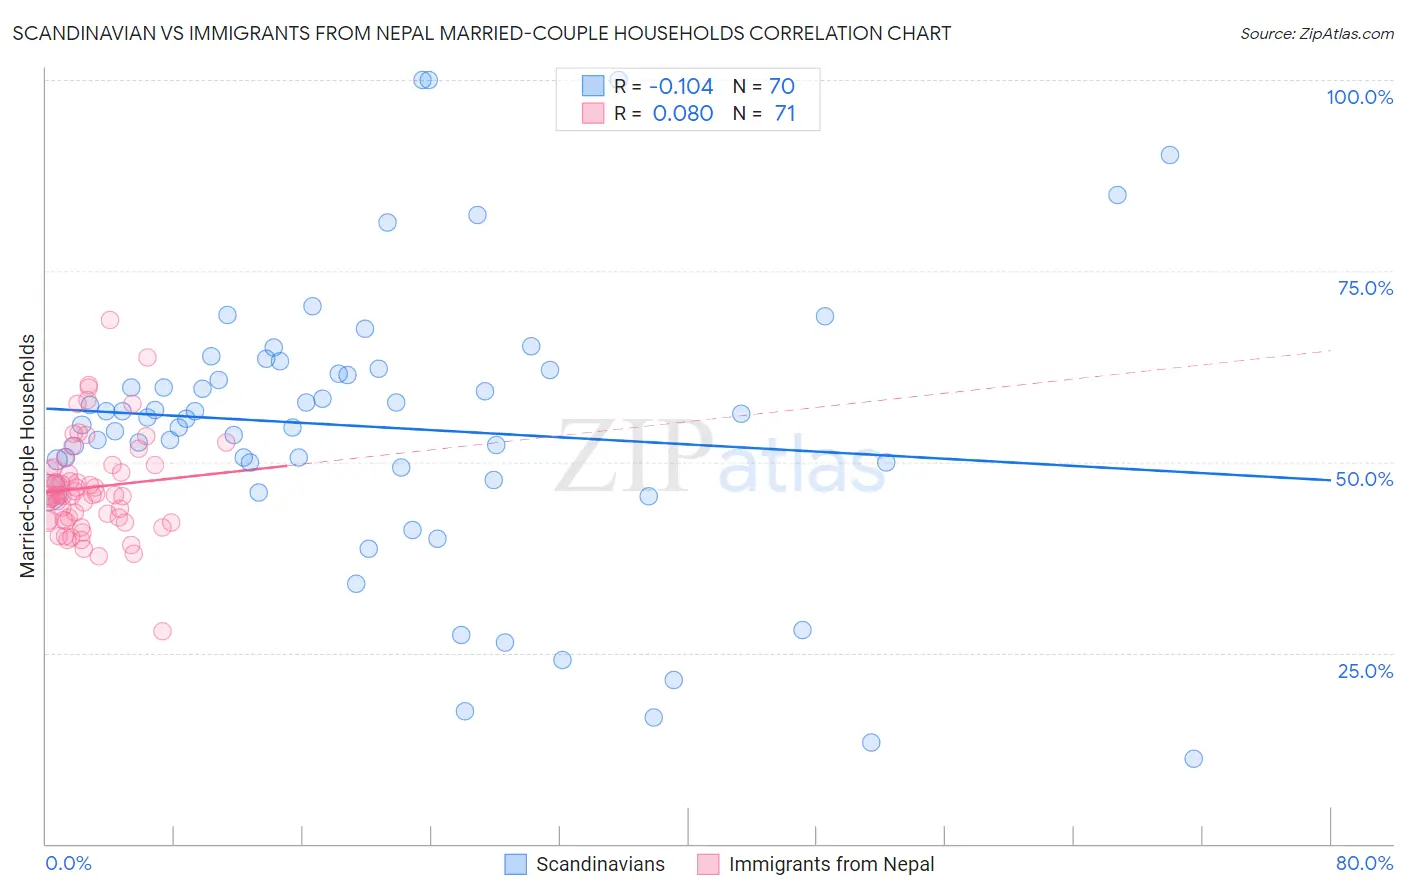
Scandinavian vs Immigrants from Nepal Married-couple Households Correlation Chart

The statistical analysis conducted on geographies consisting of 472,257,981 people shows a poor negative correlation between the proportion of Scandinavians and percentage of married-couple family households in the United States with a correlation coefficient (R) of -0.104 and weighted average of 49.6%. Similarly, the statistical analysis conducted on geographies consisting of 186,686,062 people shows a slight positive correlation between the proportion of Immigrants from Nepal and percentage of married-couple family households in the United States with a correlation coefficient (R) of 0.080 and weighted average of 45.2%, a difference of 9.6%.
Scandinavian vs Immigrants from Nepal Married-couple Households

Married-couple Households Correlation Summary

MeasurementScandinavianImmigrants from Nepal
Minimum11.1%27.8%
Maximum100.0%68.6%
Range88.9%40.8%
Mean54.5%46.6%
Median55.7%45.6%
Interquartile 25% (IQ1)49.3%42.3%
Interquartile 75% (IQ3)61.9%49.2%
Interquartile Range (IQR)12.6%6.9%
Standard Deviation (Sample)18.6%6.5%
Standard Deviation (Population)18.4%6.5%

Similar Demographics by Married-couple Households

Demographics Similar to Scandinavians by Married-couple Households

In terms of married-couple households, the demographic groups most similar to Scandinavians are European (49.6%, a difference of 0.0%), Norwegian (49.5%, a difference of 0.050%), Immigrants from Hong Kong (49.6%, a difference of 0.17%), English (49.6%, a difference of 0.17%), and Asian (49.5%, a difference of 0.17%).
DemographicsRating | RankMarried-couple Households
Immigrants | Korea
100.0
/100
|
#13
Exceptional
49.9%
Burmese
100.0
/100
|
#14
Exceptional
49.8%
Koreans
99.9
/100
|
#15
Exceptional
49.7%
Swedes
99.9
/100
|
#16
Exceptional
49.7%
Immigrants | Hong Kong
99.9
/100
|
#17
Exceptional
49.6%
English
99.9
/100
|
#18
Exceptional
49.6%
Europeans
99.9
/100
|
#19
Exceptional
49.6%
Scandinavians
99.9
/100
|
#20
Exceptional
49.6%
Norwegians
99.9
/100
|
#21
Exceptional
49.5%
Asians
99.9
/100
|
#22
Exceptional
49.5%
Dutch
99.9
/100
|
#23
Exceptional
49.5%
Czechs
99.9
/100
|
#24
Exceptional
49.4%
Immigrants | Philippines
99.9
/100
|
#25
Exceptional
49.3%
Immigrants | Scotland
99.8
/100
|
#26
Exceptional
49.3%
Bhutanese
99.8
/100
|
#27
Exceptional
49.3%

Demographics Similar to Immigrants from Nepal by Married-couple Households

In terms of married-couple households, the demographic groups most similar to Immigrants from Nepal are Immigrants from Portugal (45.2%, a difference of 0.0%), Japanese (45.2%, a difference of 0.020%), Panamanian (45.2%, a difference of 0.020%), Yakama (45.2%, a difference of 0.040%), and Immigrants from the Azores (45.2%, a difference of 0.050%).
DemographicsRating | RankMarried-couple Households
Hispanics or Latinos
8.7
/100
|
#208
Tragic
45.4%
Immigrants | Uzbekistan
8.4
/100
|
#209
Tragic
45.4%
Cubans
7.7
/100
|
#210
Tragic
45.4%
Immigrants | Spain
7.3
/100
|
#211
Tragic
45.3%
Creek
6.4
/100
|
#212
Tragic
45.3%
Yakama
5.8
/100
|
#213
Tragic
45.2%
Japanese
5.7
/100
|
#214
Tragic
45.2%
Immigrants | Nepal
5.6
/100
|
#215
Tragic
45.2%
Immigrants | Portugal
5.6
/100
|
#216
Tragic
45.2%
Panamanians
5.5
/100
|
#217
Tragic
45.2%
Immigrants | Azores
5.3
/100
|
#218
Tragic
45.2%
Nicaraguans
5.3
/100
|
#219
Tragic
45.2%
Immigrants | Thailand
5.1
/100
|
#220
Tragic
45.2%
Tlingit-Haida
4.9
/100
|
#221
Tragic
45.1%
Immigrants | Laos
4.6
/100
|
#222
Tragic
45.1%