New Zealander 3 or more Vehicles in Household

COMPARE

New Zealander
Race
Ancestry
AfghanAfricanAlaska NativeAlaskan AthabascanAlbanianAleutAlsatianAmericanApacheArabArapahoArgentineanArmenianAssyrian/Chaldean/SyriacAustralianAustrianBahamianBangladeshiBarbadianBasqueBelgianBelizeanBermudanBhutaneseBlackfeetBolivianBrazilianBritishBritish West IndianBulgarianBurmeseCajunCambodianCanadianCape VerdeanCarpatho RusynCelticCentral AmericanCentral American IndianCherokeeCheyenneChickasawChileanChineseChippewaChoctawColombianColvilleComancheCosta RicanCreeCreekCroatianCrowCubanCypriotCzechCzechoslovakianDanishDelawareDominicanDutchDutch West IndianEastern EuropeanEcuadorianEgyptianEnglishEstonianEthiopianEuropeanFijianFilipinoFinnishFrenchFrench American IndianFrench CanadianGermanGerman RussianGhanaianGreekGuamanian/ChamorroGuatemalanGuyaneseHaitianHmongHonduranHopiHoumaHungarianIcelanderIndian (Asian)IndonesianInupiatIranianIraqiIrishIroquoisIsraeliItalianJamaicanJapaneseJordanianKenyanKiowaKoreanLaotianLatvianLebaneseLiberianLithuanianLumbeeLuxembourgerMacedonianMalaysianMalteseMarshalleseMenomineeMexicanMexican American IndianMongolianMoroccanNative HawaiianNavajoNepaleseNew ZealanderNicaraguanNigerianNorthern EuropeanNorwegianOkinawanOsageOttawaPaiutePakistaniPalestinianPanamanianParaguayanPennsylvania GermanPeruvianPimaPolishPortuguesePotawatomiPuebloPuerto RicanPuget Sound SalishRomanianRussianSalvadoranSamoanScandinavianScotch-IrishScottishSeminoleSenegaleseSerbianShoshoneSierra LeoneanSiouxSlavicSlovakSloveneSomaliSouth AfricanSouth AmericanSouth American IndianSoviet UnionSpaniardSpanishSpanish AmericanSpanish American IndianSri LankanSubsaharan AfricanSudaneseSwedishSwissSyrianTaiwaneseThaiTlingit-HaidaTohono O'OdhamTonganTrinidadian and TobagonianTsimshianTurkishU.S. Virgin IslanderUgandanUkrainianUruguayanUteVenezuelanVietnameseWelshWest IndianYakamaYaquiYugoslavianYumanYup'ikZimbabwean
Immigration
NonimmigrantsImmigrantsAfghanistanAfricaAlbaniaArgentinaArmeniaAsiaAustraliaAustriaBahamasBangladeshBarbadosBelarusBelgiumBelizeBoliviaBosnia and HerzegovinaBrazilBulgariaBurma/MyanmarCabo VerdeCambodiaCameroonCanadaCaribbeanCentral AmericaChileChinaColombiaCongoCosta RicaCroatiaCubaCzechoslovakiaDenmarkDominicaDominican RepublicEastern AfricaEastern AsiaEastern EuropeEcuadorEgyptEl SalvadorEnglandEritreaEthiopiaEuropeFijiFranceGermanyGhanaGreeceGrenadaGuatemalaGuyanaHaitiHondurasHong KongHungaryIndiaIndonesiaIranIraqIrelandIsraelItalyJamaicaJapanJordanKazakhstanKenyaKoreaKuwaitLaosLatin AmericaLatviaLebanonLiberiaLithuaniaMalaysiaMexicoMicronesiaMiddle AfricaMoldovaMoroccoNepalNetherlandsNicaraguaNigeriaNorth AmericaNorth MacedoniaNorthern AfricaNorthern EuropeNorwayOceaniaPakistanPanamaPeruPhilippinesPolandPortugalRomaniaRussiaSaudi ArabiaScotlandSenegalSerbiaSierra LeoneSingaporeSomaliaSouth AfricaSouth AmericaSouth Central AsiaSouth Eastern AsiaSouthern EuropeSpainSri LankaSt. Vincent and the GrenadinesSudanSwedenSwitzerlandSyriaTaiwanThailandTrinidad and TobagoTurkeyUgandaUkraineUruguayUzbekistanVenezuelaVietnamWest IndiesWestern AfricaWestern AsiaWestern EuropeYemenZaireZimbabweAzores
Select to Compare
Race
Ancestry
AfghanAfricanAlaska NativeAlaskan AthabascanAlbanianAleutAlsatianAmericanApacheArabArapahoArgentineanArmenianAssyrian/Chaldean/SyriacAustralianAustrianBahamianBangladeshiBarbadianBasqueBelgianBelizeanBermudanBhutaneseBlackfeetBolivianBrazilianBritishBritish West IndianBulgarianBurmeseCajunCambodianCanadianCape VerdeanCarpatho RusynCelticCentral AmericanCentral American IndianCherokeeCheyenneChickasawChileanChineseChippewaChoctawColombianColvilleComancheCosta RicanCreeCreekCroatianCrowCubanCypriotCzechCzechoslovakianDanishDelawareDominicanDutchDutch West IndianEastern EuropeanEcuadorianEgyptianEnglishEstonianEthiopianEuropeanFijianFilipinoFinnishFrenchFrench American IndianFrench CanadianGermanGerman RussianGhanaianGreekGuamanian/ChamorroGuatemalanGuyaneseHaitianHmongHonduranHopiHoumaHungarianIcelanderIndian (Asian)IndonesianInupiatIranianIraqiIrishIroquoisIsraeliItalianJamaicanJapaneseJordanianKenyanKiowaKoreanLaotianLatvianLebaneseLiberianLithuanianLumbeeLuxembourgerMacedonianMalaysianMalteseMarshalleseMenomineeMexicanMexican American IndianMongolianMoroccanNative HawaiianNavajoNepaleseNicaraguanNigerianNorthern EuropeanNorwegianOkinawanOsageOttawaPaiutePakistaniPalestinianPanamanianParaguayanPennsylvania GermanPeruvianPimaPolishPortuguesePotawatomiPuebloPuerto RicanPuget Sound SalishRomanianRussianSalvadoranSamoanScandinavianScotch-IrishScottishSeminoleSenegaleseSerbianShoshoneSierra LeoneanSiouxSlavicSlovakSloveneSomaliSouth AfricanSouth AmericanSouth American IndianSoviet UnionSpaniardSpanishSpanish AmericanSpanish American IndianSri LankanSubsaharan AfricanSudaneseSwedishSwissSyrianTaiwaneseThaiTlingit-HaidaTohono O'OdhamTonganTrinidadian and TobagonianTsimshianTurkishU.S. Virgin IslanderUgandanUkrainianUruguayanUteVenezuelanVietnameseWelshWest IndianYakamaYaquiYugoslavianYumanYup'ikZimbabwean
Immigration
NonimmigrantsImmigrantsAfghanistanAfricaAlbaniaArgentinaArmeniaAsiaAustraliaAustriaBahamasBangladeshBarbadosBelarusBelgiumBelizeBoliviaBosnia and HerzegovinaBrazilBulgariaBurma/MyanmarCabo VerdeCambodiaCameroonCanadaCaribbeanCentral AmericaChileChinaColombiaCongoCosta RicaCroatiaCubaCzechoslovakiaDenmarkDominicaDominican RepublicEastern AfricaEastern AsiaEastern EuropeEcuadorEgyptEl SalvadorEnglandEritreaEthiopiaEuropeFijiFranceGermanyGhanaGreeceGrenadaGuatemalaGuyanaHaitiHondurasHong KongHungaryIndiaIndonesiaIranIraqIrelandIsraelItalyJamaicaJapanJordanKazakhstanKenyaKoreaKuwaitLaosLatin AmericaLatviaLebanonLiberiaLithuaniaMalaysiaMexicoMicronesiaMiddle AfricaMoldovaMoroccoNepalNetherlandsNicaraguaNigeriaNorth AmericaNorth MacedoniaNorthern AfricaNorthern EuropeNorwayOceaniaPakistanPanamaPeruPhilippinesPolandPortugalRomaniaRussiaSaudi ArabiaScotlandSenegalSerbiaSierra LeoneSingaporeSomaliaSouth AfricaSouth AmericaSouth Central AsiaSouth Eastern AsiaSouthern EuropeSpainSri LankaSt. Vincent and the GrenadinesSudanSwedenSwitzerlandSyriaTaiwanThailandTrinidad and TobagoTurkeyUgandaUkraineUruguayUzbekistanVenezuelaVietnamWest IndiesWestern AfricaWestern AsiaWestern EuropeYemenZaireZimbabweAzores
3 or more Vehicles in Household
Income
Poverty
Unemployment
Labor Participation
Family Structure
Vehicle Availability
Education Level
Disability

New Zealander 3 or more Vehicles in Household
Exceptional

20.4%
3+ VEHICLES AVAILABLE
91.3/ 100
METRIC RATING
128th/ 347
METRIC RANK

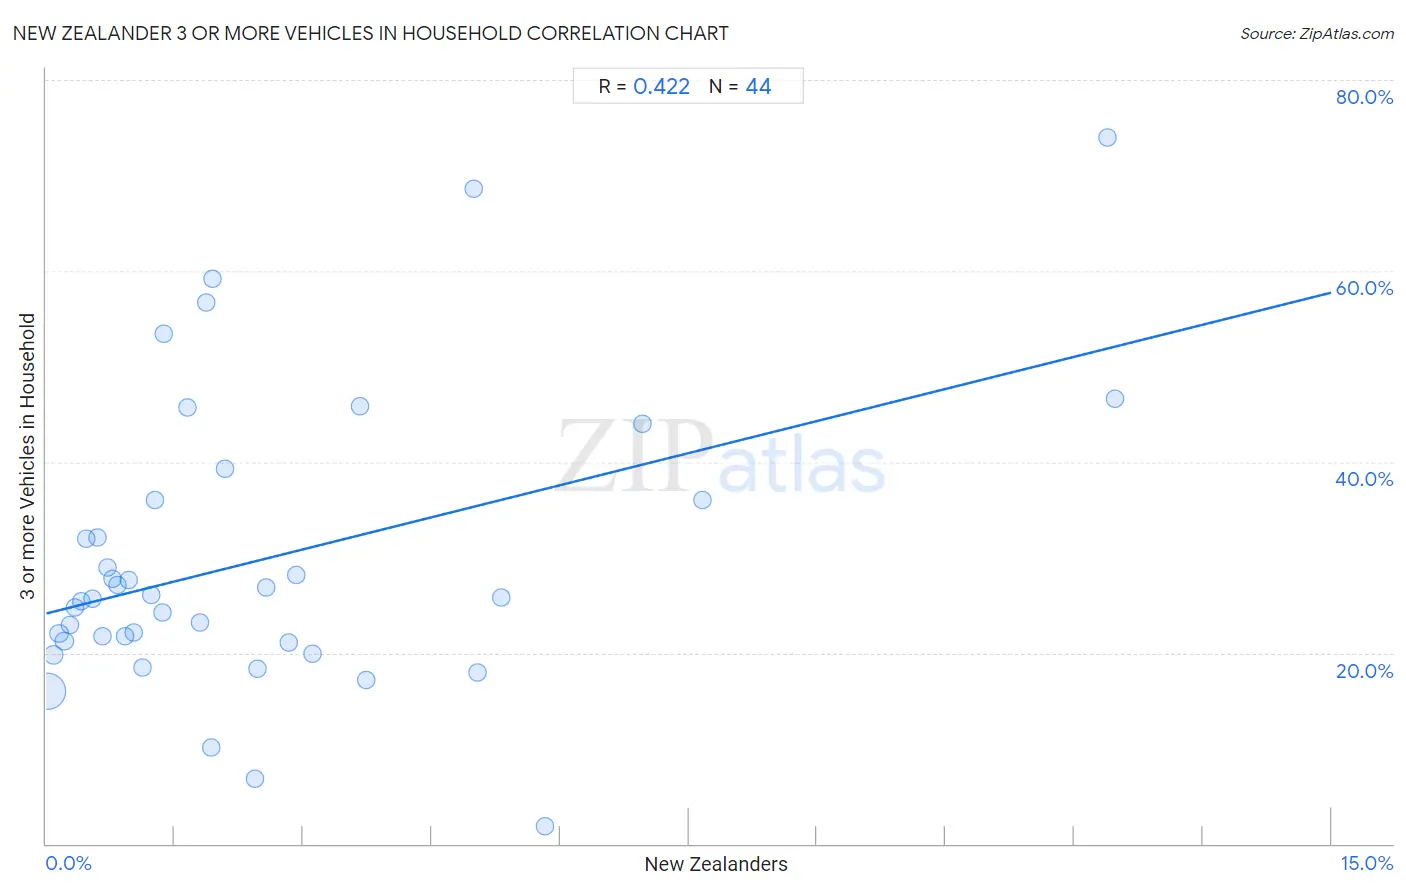
New Zealander 3 or more Vehicles in Household Correlation Chart

The statistical analysis conducted on geographies consisting of 106,882,673 people shows a moderate positive correlation between the proportion of New Zealanders and percentage of households with 3 or more vehicles available in the United States with a correlation coefficient (R) of 0.422 and weighted average of 20.4%. On average, for every 1% (one percent) increase in New Zealanders within a typical geography, there is an increase of 2.2% in percentage of households with 3 or more vehicles available.
New Zealander 3 or more Vehicles in Household
It is essential to understand that the correlation between the percentage of New Zealanders and percentage of households with 3 or more vehicles available does not imply a direct cause-and-effect relationship. It remains uncertain whether the presence of New Zealanders influences an upward or downward trend in the level of percentage of households with 3 or more vehicles available within an area, or if New Zealanders simply ended up residing in those areas with higher or lower levels of percentage of households with 3 or more vehicles available due to other factors.

Demographics Similar to New Zealanders by 3 or more Vehicles in Household

In terms of 3 or more vehicles in household, the demographic groups most similar to New Zealanders are Immigrants from Bolivia (20.4%, a difference of 0.17%), Slavic (20.4%, a difference of 0.20%), Immigrants from Netherlands (20.4%, a difference of 0.41%), Central American (20.5%, a difference of 0.45%), and Zimbabwean (20.3%, a difference of 0.52%).
DemographicsRating | Rank3 or more Vehicles in Household
Immigrants from Thailand
93.8
/100
|
#121
Exceptional
20.5%
German Russians
93.7
/100
|
#122
Exceptional
20.5%
Immigrants from Korea
93.7
/100
|
#123
Exceptional
20.5%
Central Americans
93.1
/100
|
#124
Exceptional
20.5%
Immigrants from Netherlands
92.9
/100
|
#125
Exceptional
20.4%
Slavs
92.1
/100
|
#126
Exceptional
20.4%
Immigrants from Bolivia
92.0
/100
|
#127
Exceptional
20.4%
New Zealanders
91.3
/100
|
#128
Exceptional
20.4%
Zimbabweans
88.7
/100
|
#129
Excellent
20.3%
Greeks
88.6
/100
|
#130
Excellent
20.3%
Immigrants from Asia
88.1
/100
|
#131
Excellent
20.2%
Immigrants from Canada
87.8
/100
|
#132
Excellent
20.2%
Immigrants from North America
87.8
/100
|
#133
Excellent
20.2%
Poles
87.3
/100
|
#134
Excellent
20.2%
Immigrants from India
87.2
/100
|
#135
Excellent
20.2%

New Zealander 3 or more Vehicles in Household Correlation Summary

MeasurementNew Zealander Data3 or more Vehicles in Household Data
Minimum0.016%1.8%
Maximum12.5%74.0%
Range12.5%72.2%
Mean2.5%29.8%
Median1.5%25.7%
Interquartile 25% (IQ1)0.68%21.2%
Interquartile 75% (IQ3)3.0%36.1%
Interquartile Range (IQR)2.3%14.9%
Standard Deviation (Sample)2.9%15.3%
Standard Deviation (Population)2.8%15.1%

Correlation Details

New Zealander PercentileSample Size3 or more Vehicles in Household
[
0.0%
-
0.5%
]
0.016%
93,462,30616.0%
[
0.0%
-
0.5%
]
0.086%
7,621,42919.8%
[
0.0%
-
0.5%
]
0.15%
2,736,08322.0%
[
0.0%
-
0.5%
]
0.21%
989,26621.2%
[
0.0%
-
0.5%
]
0.27%
671,64423.0%
[
0.0%
-
0.5%
]
0.34%
442,29024.7%
[
0.0%
-
0.5%
]
0.40%
215,32725.4%
[
0.0%
-
0.5%
]
0.47%
198,10332.0%
[
0.5%
-
1.0%
]
0.54%
140,06525.7%
[
0.5%
-
1.0%
]
0.60%
54,43632.0%
[
0.5%
-
1.0%
]
0.66%
62,60821.7%
[
0.5%
-
1.0%
]
0.71%
57,51629.0%
[
0.5%
-
1.0%
]
0.78%
28,54327.8%
[
0.5%
-
1.0%
]
0.84%
58,01827.1%
[
0.5%
-
1.0%
]
0.92%
35,58721.8%
[
0.5%
-
1.0%
]
0.96%
26,02327.6%
[
1.0%
-
1.5%
]
1.03%
5,44422.1%
[
1.0%
-
1.5%
]
1.12%
5,01218.4%
[
1.0%
-
1.5%
]
1.23%
7,78726.0%
[
1.0%
-
1.5%
]
1.27%
7,25536.1%
[
1.0%
-
1.5%
]
1.35%
13,32224.2%
[
1.0%
-
1.5%
]
1.38%
6,53453.4%
[
1.5%
-
2.0%
]
1.65%
36345.7%
[
1.5%
-
2.0%
]
1.79%
6,46723.2%
[
1.5%
-
2.0%
]
1.86%
1,01956.7%
[
1.5%
-
2.0%
]
1.92%
1,24710.1%
[
1.5%
-
2.0%
]
1.95%
97659.2%
[
2.0%
-
2.5%
]
2.09%
3,30539.3%
[
2.0%
-
2.5%
]
2.43%
2,0166.8%
[
2.0%
-
2.5%
]
2.47%
3,36718.3%
[
2.5%
-
3.0%
]
2.57%
4,40226.9%
[
2.5%
-
3.0%
]
2.84%
28221.1%
[
2.5%
-
3.0%
]
2.92%
6,34528.2%
[
3.0%
-
3.5%
]
3.11%
1,41319.9%
[
3.5%
-
4.0%
]
3.67%
49145.8%
[
3.5%
-
4.0%
]
3.73%
1,34017.2%
[
4.5%
-
5.0%
]
4.98%
30168.6%
[
5.0%
-
5.5%
]
5.03%
89417.9%
[
5.0%
-
5.5%
]
5.30%
88625.8%
[
5.5%
-
6.0%
]
5.82%
4981.8%
[
6.5%
-
7.0%
]
6.95%
60444.0%
[
7.5%
-
8.0%
]
7.66%
1,24036.1%
[
12.0%
-
12.5%
]
12.39%
21874.0%
[
12.0%
-
12.5%
]
12.47%
40146.7%