New Zealander 1 or more Vehicles in Household

COMPARE

New Zealander
Race
Ancestry
AfghanAfricanAlaska NativeAlaskan AthabascanAlbanianAleutAlsatianAmericanApacheArabArapahoArgentineanArmenianAssyrian/Chaldean/SyriacAustralianAustrianBahamianBangladeshiBarbadianBasqueBelgianBelizeanBermudanBhutaneseBlackfeetBolivianBrazilianBritishBritish West IndianBulgarianBurmeseCajunCambodianCanadianCape VerdeanCarpatho RusynCelticCentral AmericanCentral American IndianCherokeeCheyenneChickasawChileanChineseChippewaChoctawColombianColvilleComancheCosta RicanCreeCreekCroatianCrowCubanCypriotCzechCzechoslovakianDanishDelawareDominicanDutchDutch West IndianEastern EuropeanEcuadorianEgyptianEnglishEstonianEthiopianEuropeanFijianFilipinoFinnishFrenchFrench American IndianFrench CanadianGermanGerman RussianGhanaianGreekGuamanian/ChamorroGuatemalanGuyaneseHaitianHmongHonduranHopiHoumaHungarianIcelanderIndian (Asian)IndonesianInupiatIranianIraqiIrishIroquoisIsraeliItalianJamaicanJapaneseJordanianKenyanKiowaKoreanLaotianLatvianLebaneseLiberianLithuanianLumbeeLuxembourgerMacedonianMalaysianMalteseMarshalleseMenomineeMexicanMexican American IndianMongolianMoroccanNative HawaiianNavajoNepaleseNew ZealanderNicaraguanNigerianNorthern EuropeanNorwegianOkinawanOsageOttawaPaiutePakistaniPalestinianPanamanianParaguayanPennsylvania GermanPeruvianPimaPolishPortuguesePotawatomiPuebloPuerto RicanPuget Sound SalishRomanianRussianSalvadoranSamoanScandinavianScotch-IrishScottishSeminoleSenegaleseSerbianShoshoneSierra LeoneanSiouxSlavicSlovakSloveneSomaliSouth AfricanSouth AmericanSouth American IndianSoviet UnionSpaniardSpanishSpanish AmericanSpanish American IndianSri LankanSubsaharan AfricanSudaneseSwedishSwissSyrianTaiwaneseThaiTlingit-HaidaTohono O'OdhamTonganTrinidadian and TobagonianTsimshianTurkishU.S. Virgin IslanderUgandanUkrainianUruguayanUteVenezuelanVietnameseWelshWest IndianYakamaYaquiYugoslavianYumanYup'ikZimbabwean
Immigration
NonimmigrantsImmigrantsAfghanistanAfricaAlbaniaArgentinaArmeniaAsiaAustraliaAustriaBahamasBangladeshBarbadosBelarusBelgiumBelizeBoliviaBosnia and HerzegovinaBrazilBulgariaBurma/MyanmarCabo VerdeCambodiaCameroonCanadaCaribbeanCentral AmericaChileChinaColombiaCongoCosta RicaCroatiaCubaCzechoslovakiaDenmarkDominicaDominican RepublicEastern AfricaEastern AsiaEastern EuropeEcuadorEgyptEl SalvadorEnglandEritreaEthiopiaEuropeFijiFranceGermanyGhanaGreeceGrenadaGuatemalaGuyanaHaitiHondurasHong KongHungaryIndiaIndonesiaIranIraqIrelandIsraelItalyJamaicaJapanJordanKazakhstanKenyaKoreaKuwaitLaosLatin AmericaLatviaLebanonLiberiaLithuaniaMalaysiaMexicoMicronesiaMiddle AfricaMoldovaMoroccoNepalNetherlandsNicaraguaNigeriaNorth AmericaNorth MacedoniaNorthern AfricaNorthern EuropeNorwayOceaniaPakistanPanamaPeruPhilippinesPolandPortugalRomaniaRussiaSaudi ArabiaScotlandSenegalSerbiaSierra LeoneSingaporeSomaliaSouth AfricaSouth AmericaSouth Central AsiaSouth Eastern AsiaSouthern EuropeSpainSri LankaSt. Vincent and the GrenadinesSudanSwedenSwitzerlandSyriaTaiwanThailandTrinidad and TobagoTurkeyUgandaUkraineUruguayUzbekistanVenezuelaVietnamWest IndiesWestern AfricaWestern AsiaWestern EuropeYemenZaireZimbabweAzores
Select to Compare
Race
Ancestry
AfghanAfricanAlaska NativeAlaskan AthabascanAlbanianAleutAlsatianAmericanApacheArabArapahoArgentineanArmenianAssyrian/Chaldean/SyriacAustralianAustrianBahamianBangladeshiBarbadianBasqueBelgianBelizeanBermudanBhutaneseBlackfeetBolivianBrazilianBritishBritish West IndianBulgarianBurmeseCajunCambodianCanadianCape VerdeanCarpatho RusynCelticCentral AmericanCentral American IndianCherokeeCheyenneChickasawChileanChineseChippewaChoctawColombianColvilleComancheCosta RicanCreeCreekCroatianCrowCubanCypriotCzechCzechoslovakianDanishDelawareDominicanDutchDutch West IndianEastern EuropeanEcuadorianEgyptianEnglishEstonianEthiopianEuropeanFijianFilipinoFinnishFrenchFrench American IndianFrench CanadianGermanGerman RussianGhanaianGreekGuamanian/ChamorroGuatemalanGuyaneseHaitianHmongHonduranHopiHoumaHungarianIcelanderIndian (Asian)IndonesianInupiatIranianIraqiIrishIroquoisIsraeliItalianJamaicanJapaneseJordanianKenyanKiowaKoreanLaotianLatvianLebaneseLiberianLithuanianLumbeeLuxembourgerMacedonianMalaysianMalteseMarshalleseMenomineeMexicanMexican American IndianMongolianMoroccanNative HawaiianNavajoNepaleseNicaraguanNigerianNorthern EuropeanNorwegianOkinawanOsageOttawaPaiutePakistaniPalestinianPanamanianParaguayanPennsylvania GermanPeruvianPimaPolishPortuguesePotawatomiPuebloPuerto RicanPuget Sound SalishRomanianRussianSalvadoranSamoanScandinavianScotch-IrishScottishSeminoleSenegaleseSerbianShoshoneSierra LeoneanSiouxSlavicSlovakSloveneSomaliSouth AfricanSouth AmericanSouth American IndianSoviet UnionSpaniardSpanishSpanish AmericanSpanish American IndianSri LankanSubsaharan AfricanSudaneseSwedishSwissSyrianTaiwaneseThaiTlingit-HaidaTohono O'OdhamTonganTrinidadian and TobagonianTsimshianTurkishU.S. Virgin IslanderUgandanUkrainianUruguayanUteVenezuelanVietnameseWelshWest IndianYakamaYaquiYugoslavianYumanYup'ikZimbabwean
Immigration
NonimmigrantsImmigrantsAfghanistanAfricaAlbaniaArgentinaArmeniaAsiaAustraliaAustriaBahamasBangladeshBarbadosBelarusBelgiumBelizeBoliviaBosnia and HerzegovinaBrazilBulgariaBurma/MyanmarCabo VerdeCambodiaCameroonCanadaCaribbeanCentral AmericaChileChinaColombiaCongoCosta RicaCroatiaCubaCzechoslovakiaDenmarkDominicaDominican RepublicEastern AfricaEastern AsiaEastern EuropeEcuadorEgyptEl SalvadorEnglandEritreaEthiopiaEuropeFijiFranceGermanyGhanaGreeceGrenadaGuatemalaGuyanaHaitiHondurasHong KongHungaryIndiaIndonesiaIranIraqIrelandIsraelItalyJamaicaJapanJordanKazakhstanKenyaKoreaKuwaitLaosLatin AmericaLatviaLebanonLiberiaLithuaniaMalaysiaMexicoMicronesiaMiddle AfricaMoldovaMoroccoNepalNetherlandsNicaraguaNigeriaNorth AmericaNorth MacedoniaNorthern AfricaNorthern EuropeNorwayOceaniaPakistanPanamaPeruPhilippinesPolandPortugalRomaniaRussiaSaudi ArabiaScotlandSenegalSerbiaSierra LeoneSingaporeSomaliaSouth AfricaSouth AmericaSouth Central AsiaSouth Eastern AsiaSouthern EuropeSpainSri LankaSt. Vincent and the GrenadinesSudanSwedenSwitzerlandSyriaTaiwanThailandTrinidad and TobagoTurkeyUgandaUkraineUruguayUzbekistanVenezuelaVietnamWest IndiesWestern AfricaWestern AsiaWestern EuropeYemenZaireZimbabweAzores
1 or more Vehicles in Household
Income
Poverty
Unemployment
Labor Participation
Family Structure
Vehicle Availability
Education Level
Disability

New Zealander 1 or more Vehicles in Household
Good

90.1%
1+ VEHICLES AVAILABLE
73.8/ 100
METRIC RATING
153rd/ 347
METRIC RANK

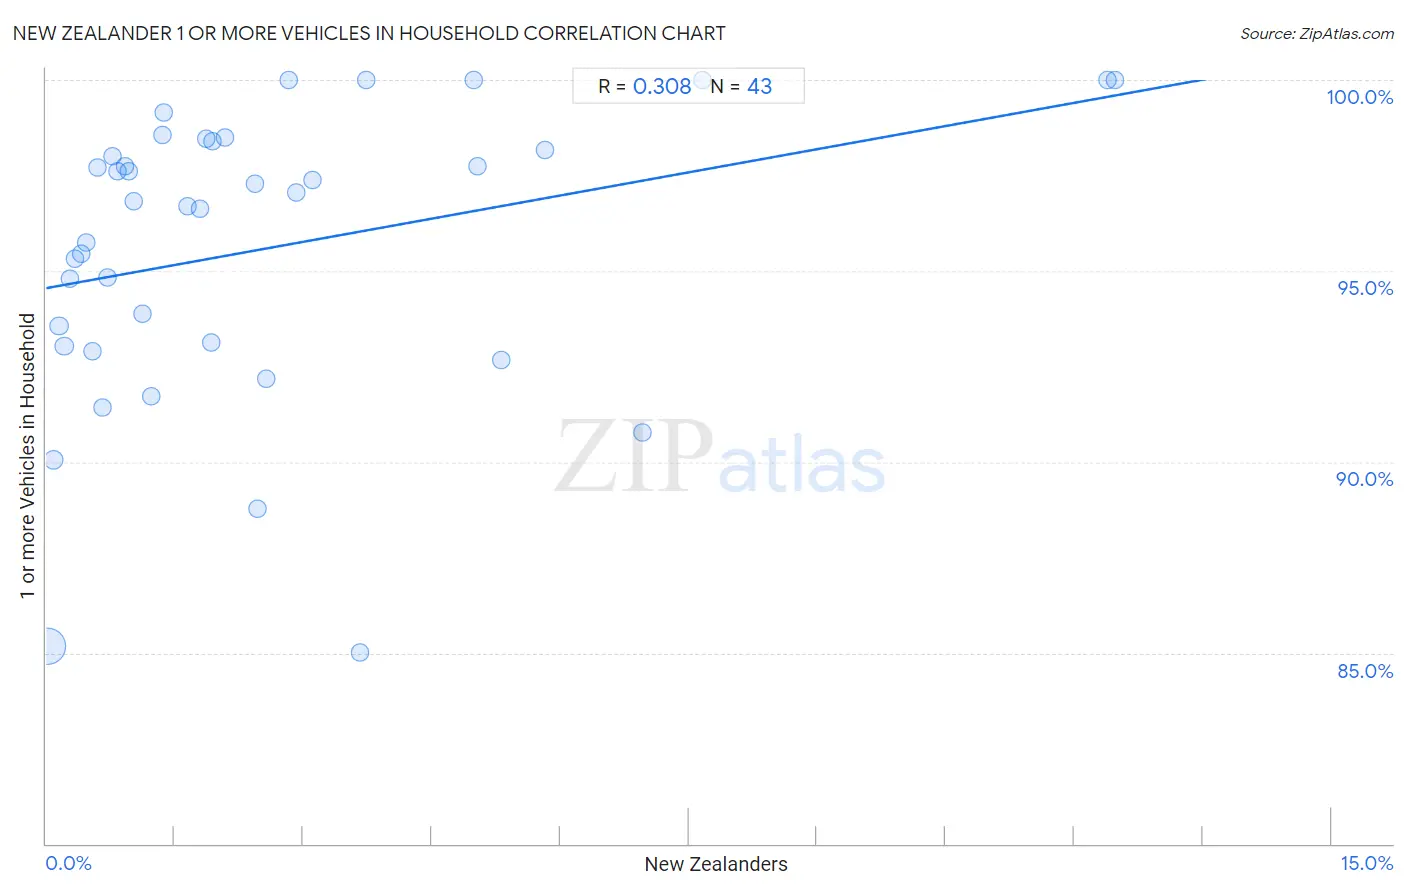
New Zealander 1 or more Vehicles in Household Correlation Chart

The statistical analysis conducted on geographies consisting of 106,884,336 people shows a mild positive correlation between the proportion of New Zealanders and percentage of households with 1 or more vehicles available in the United States with a correlation coefficient (R) of 0.308 and weighted average of 90.1%. On average, for every 1% (one percent) increase in New Zealanders within a typical geography, there is an increase of 0.40% in percentage of households with 1 or more vehicles available.
New Zealander 1 or more Vehicles in Household
It is essential to understand that the correlation between the percentage of New Zealanders and percentage of households with 1 or more vehicles available does not imply a direct cause-and-effect relationship. It remains uncertain whether the presence of New Zealanders influences an upward or downward trend in the level of percentage of households with 1 or more vehicles available within an area, or if New Zealanders simply ended up residing in those areas with higher or lower levels of percentage of households with 1 or more vehicles available due to other factors.

Demographics Similar to New Zealanders by 1 or more Vehicles in Household

In terms of 1 or more vehicles in household, the demographic groups most similar to New Zealanders are Immigrants from Uganda (90.1%, a difference of 0.0%), Immigrants (90.1%, a difference of 0.0%), Tlingit-Haida (90.1%, a difference of 0.010%), Immigrants from Bosnia and Herzegovina (90.1%, a difference of 0.030%), and Australian (90.0%, a difference of 0.030%).
DemographicsRating | Rank1 or more Vehicles in Household
Bahamians
80.5
/100
|
#146
Excellent
90.2%
Chileans
79.8
/100
|
#147
Good
90.2%
Immigrants from Eastern Africa
78.2
/100
|
#148
Good
90.1%
Immigrants from Nicaragua
76.7
/100
|
#149
Good
90.1%
Immigrants from Micronesia
75.9
/100
|
#150
Good
90.1%
Immigrants from Bosnia and Herzegovina
75.4
/100
|
#151
Good
90.1%
Tlingit-Haida
74.3
/100
|
#152
Good
90.1%
New Zealanders
73.8
/100
|
#153
Good
90.1%
Immigrants from Uganda
73.8
/100
|
#154
Good
90.1%
Immigrants
73.6
/100
|
#155
Good
90.1%
Australians
72.4
/100
|
#156
Good
90.0%
Immigrants from Congo
71.2
/100
|
#157
Good
90.0%
Brazilians
71.0
/100
|
#158
Good
90.0%
South Africans
69.7
/100
|
#159
Good
90.0%
Immigrants from Indonesia
68.8
/100
|
#160
Good
90.0%

New Zealander 1 or more Vehicles in Household Correlation Summary

MeasurementNew Zealander Data1 or more Vehicles in Household Data
Minimum0.016%85.0%
Maximum12.5%100.0%
Range12.5%15.0%
Mean2.6%95.6%
Median1.7%96.8%
Interquartile 25% (IQ1)0.66%93.0%
Interquartile 75% (IQ3)3.1%98.4%
Interquartile Range (IQR)2.5%5.4%
Standard Deviation (Sample)2.9%3.8%
Standard Deviation (Population)2.9%3.8%

Correlation Details

New Zealander PercentileSample Size1 or more Vehicles in Household
[
0.0%
-
0.5%
]
0.016%
93,462,30685.2%
[
0.0%
-
0.5%
]
0.086%
7,622,68690.0%
[
0.0%
-
0.5%
]
0.15%
2,736,08393.6%
[
0.0%
-
0.5%
]
0.21%
994,53793.0%
[
0.0%
-
0.5%
]
0.27%
671,64494.8%
[
0.0%
-
0.5%
]
0.34%
442,29095.3%
[
0.0%
-
0.5%
]
0.40%
215,32795.5%
[
0.0%
-
0.5%
]
0.47%
198,78395.7%
[
0.5%
-
1.0%
]
0.54%
140,06592.9%
[
0.5%
-
1.0%
]
0.60%
54,43697.7%
[
0.5%
-
1.0%
]
0.66%
62,60891.4%
[
0.5%
-
1.0%
]
0.71%
57,51694.8%
[
0.5%
-
1.0%
]
0.78%
29,43698.0%
[
0.5%
-
1.0%
]
0.84%
58,83597.6%
[
0.5%
-
1.0%
]
0.92%
35,58797.7%
[
0.5%
-
1.0%
]
0.96%
26,02397.6%
[
1.0%
-
1.5%
]
1.03%
5,44496.8%
[
1.0%
-
1.5%
]
1.12%
5,01293.9%
[
1.0%
-
1.5%
]
1.23%
7,78791.7%
[
1.0%
-
1.5%
]
1.35%
13,32298.6%
[
1.0%
-
1.5%
]
1.38%
6,53499.2%
[
1.5%
-
2.0%
]
1.65%
36396.7%
[
1.5%
-
2.0%
]
1.79%
6,46796.6%
[
1.5%
-
2.0%
]
1.86%
1,01998.5%
[
1.5%
-
2.0%
]
1.92%
1,24793.1%
[
1.5%
-
2.0%
]
1.95%
97698.4%
[
2.0%
-
2.5%
]
2.09%
3,30598.5%
[
2.0%
-
2.5%
]
2.43%
2,01697.3%
[
2.0%
-
2.5%
]
2.47%
3,36788.8%
[
2.5%
-
3.0%
]
2.57%
4,40292.2%
[
2.5%
-
3.0%
]
2.84%
282100.0%
[
2.5%
-
3.0%
]
2.92%
6,34597.1%
[
3.0%
-
3.5%
]
3.11%
1,41397.4%
[
3.5%
-
4.0%
]
3.67%
49185.0%
[
3.5%
-
4.0%
]
3.73%
1,340100.0%
[
4.5%
-
5.0%
]
4.98%
301100.0%
[
5.0%
-
5.5%
]
5.03%
89497.7%
[
5.0%
-
5.5%
]
5.30%
88692.7%
[
5.5%
-
6.0%
]
5.82%
49898.2%
[
6.5%
-
7.0%
]
6.95%
60490.8%
[
7.5%
-
8.0%
]
7.66%
1,240100.0%
[
12.0%
-
12.5%
]
12.39%
218100.0%
[
12.0%
-
12.5%
]
12.47%
401100.0%