New Zealander Disability Age Under 5
COMPARE
New Zealander
Select to Compare
Disability Age Under 5
New Zealander Disability Age Under 5
1.2%
DISABILITY | AGE UNDER 5
81.4/ 100
METRIC RATING
139th/ 347
METRIC RANK
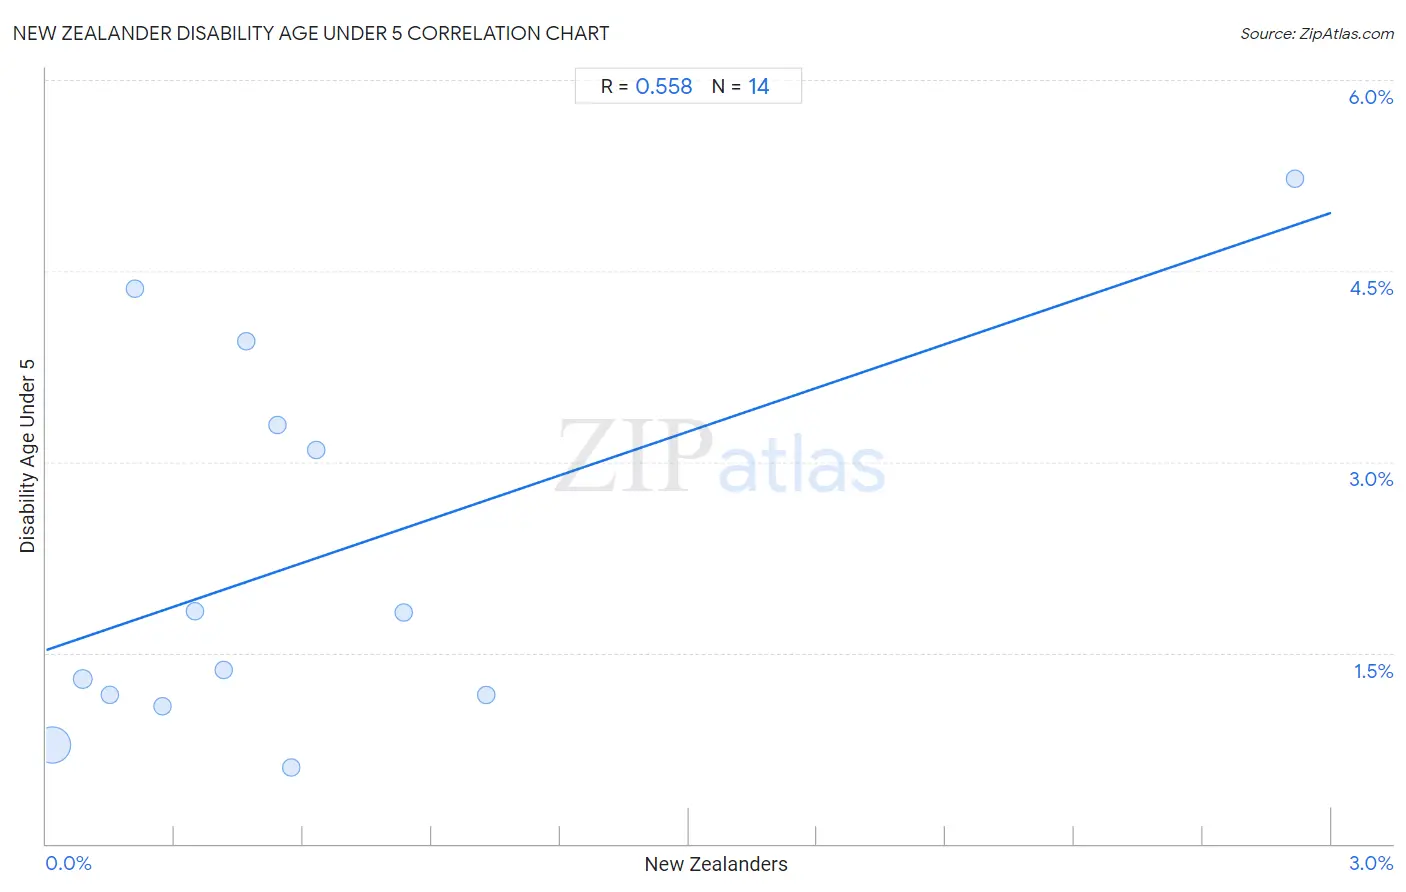
New Zealander Disability Age Under 5 Correlation Chart
The statistical analysis conducted on geographies consisting of 80,962,050 people shows a substantial positive correlation between the proportion of New Zealanders and percentage of population with a disability under the age of 5 in the United States with a correlation coefficient (R) of 0.558 and weighted average of 1.2%. On average, for every 1% (one percent) increase in New Zealanders within a typical geography, there is an increase of 1.1% in percentage of population with a disability under the age of 5.
It is essential to understand that the correlation between the percentage of New Zealanders and percentage of population with a disability under the age of 5 does not imply a direct cause-and-effect relationship. It remains uncertain whether the presence of New Zealanders influences an upward or downward trend in the level of percentage of population with a disability under the age of 5 within an area, or if New Zealanders simply ended up residing in those areas with higher or lower levels of percentage of population with a disability under the age of 5 due to other factors.
Demographics Similar to New Zealanders by Disability Age Under 5
In terms of disability age under 5, the demographic groups most similar to New Zealanders are Somali (1.2%, a difference of 0.090%), Immigrants from Honduras (1.2%, a difference of 0.15%), Immigrants from Czechoslovakia (1.2%, a difference of 0.23%), Immigrants from Eastern Africa (1.2%, a difference of 0.28%), and Immigrants from Colombia (1.2%, a difference of 0.31%).
| Demographics | Rating | Rank | Disability Age Under 5 |
| Immigrants from Eastern Europe | 87.3 /100 | #132 | Excellent 1.2% |
| Immigrants from Spain | 86.5 /100 | #133 | Excellent 1.2% |
| Argentineans | 85.7 /100 | #134 | Excellent 1.2% |
| Fijians | 84.7 /100 | #135 | Excellent 1.2% |
| Moroccans | 83.6 /100 | #136 | Excellent 1.2% |
| Immigrants from Eastern Africa | 83.1 /100 | #137 | Excellent 1.2% |
| Immigrants from Czechoslovakia | 82.8 /100 | #138 | Excellent 1.2% |
| New Zealanders | 81.4 /100 | #139 | Excellent 1.2% |
| Somalis | 80.8 /100 | #140 | Excellent 1.2% |
| Immigrants from Honduras | 80.4 /100 | #141 | Excellent 1.2% |
| Immigrants from Colombia | 79.3 /100 | #142 | Good 1.2% |
| Alsatians | 79.3 /100 | #143 | Good 1.2% |
| Immigrants from Middle Africa | 79.3 /100 | #144 | Good 1.2% |
| Immigrants from Zimbabwe | 77.9 /100 | #145 | Good 1.2% |
| Samoans | 77.7 /100 | #146 | Good 1.2% |
New Zealander Disability Age Under 5 Correlation Summary
| Measurement | New Zealander Data | Disability Age Under 5 Data |
| Minimum | 0.014% | 0.60% |
| Maximum | 2.9% | 5.2% |
| Range | 2.9% | 4.6% |
| Mean | 0.61% | 2.2% |
| Median | 0.44% | 1.6% |
| Interquartile 25% (IQ1) | 0.21% | 1.2% |
| Interquartile 75% (IQ3) | 0.63% | 3.3% |
| Interquartile Range (IQR) | 0.42% | 2.1% |
| Standard Deviation (Sample) | 0.72% | 1.5% |
| Standard Deviation (Population) | 0.70% | 1.4% |
Correlation Details
| New Zealander Percentile | Sample Size | Disability Age Under 5 |
[ 0.0% - 0.5% ] 0.014% | 76,277,281 | 0.77% |
[ 0.0% - 0.5% ] 0.085% | 2,953,770 | 1.3% |
[ 0.0% - 0.5% ] 0.15% | 1,045,961 | 1.2% |
[ 0.0% - 0.5% ] 0.21% | 370,583 | 4.4% |
[ 0.0% - 0.5% ] 0.27% | 80,791 | 1.1% |
[ 0.0% - 0.5% ] 0.35% | 91,527 | 1.8% |
[ 0.0% - 0.5% ] 0.41% | 26,372 | 1.4% |
[ 0.0% - 0.5% ] 0.47% | 21,696 | 3.9% |
[ 0.5% - 1.0% ] 0.54% | 51,545 | 3.3% |
[ 0.5% - 1.0% ] 0.57% | 6,308 | 0.60% |
[ 0.5% - 1.0% ] 0.63% | 2,855 | 3.1% |
[ 0.5% - 1.0% ] 0.84% | 22,148 | 1.8% |
[ 1.0% - 1.5% ] 1.03% | 4,868 | 1.2% |
[ 2.5% - 3.0% ] 2.92% | 6,345 | 5.2% |