Immigrants from South Africa vs Chinese Married-couple Households
COMPARE
Immigrants from South Africa
Chinese
Married-couple Households
Married-couple Households Comparison
Immigrants from South Africa
Chinese
47.8%
MARRIED-COUPLE HOUSEHOLDS
96.0/ 100
METRIC RATING
104th/ 347
METRIC RANK
50.4%
MARRIED-COUPLE HOUSEHOLDS
100.0/ 100
METRIC RATING
10th/ 347
METRIC RANK
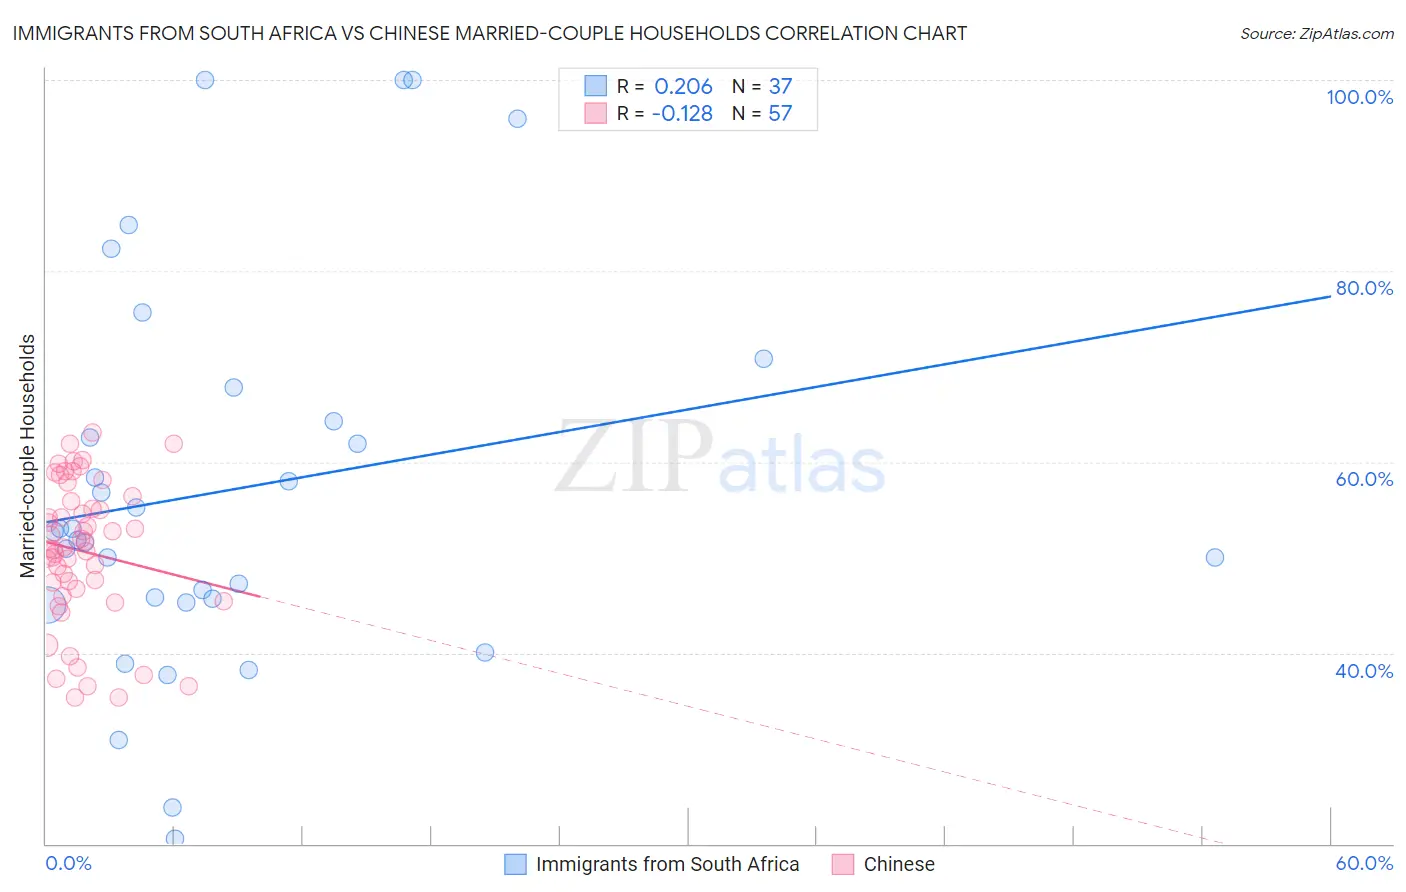
Immigrants from South Africa vs Chinese Married-couple Households Correlation Chart
The statistical analysis conducted on geographies consisting of 233,270,946 people shows a weak positive correlation between the proportion of Immigrants from South Africa and percentage of married-couple family households in the United States with a correlation coefficient (R) of 0.206 and weighted average of 47.8%. Similarly, the statistical analysis conducted on geographies consisting of 64,801,742 people shows a poor negative correlation between the proportion of Chinese and percentage of married-couple family households in the United States with a correlation coefficient (R) of -0.128 and weighted average of 50.4%, a difference of 5.3%.
Married-couple Households Correlation Summary
| Measurement | Immigrants from South Africa | Chinese |
| Minimum | 20.5% | 35.3% |
| Maximum | 100.0% | 63.0% |
| Range | 79.5% | 27.8% |
| Mean | 57.1% | 50.6% |
| Median | 52.7% | 51.0% |
| Interquartile 25% (IQ1) | 45.5% | 46.3% |
| Interquartile 75% (IQ3) | 66.0% | 56.2% |
| Interquartile Range (IQR) | 20.6% | 9.9% |
| Standard Deviation (Sample) | 20.2% | 7.4% |
| Standard Deviation (Population) | 19.9% | 7.4% |
Similar Demographics by Married-couple Households
Demographics Similar to Immigrants from South Africa by Married-couple Households
In terms of married-couple households, the demographic groups most similar to Immigrants from South Africa are Slavic (47.8%, a difference of 0.010%), Hawaiian (47.8%, a difference of 0.010%), Turkish (47.8%, a difference of 0.030%), Immigrants from Italy (47.9%, a difference of 0.090%), and Immigrants from Austria (47.9%, a difference of 0.10%).
| Demographics | Rating | Rank | Married-couple Households |
| Latvians | 96.5 /100 | #97 | Exceptional 47.9% |
| Immigrants | North Macedonia | 96.4 /100 | #98 | Exceptional 47.9% |
| Immigrants | Austria | 96.4 /100 | #99 | Exceptional 47.9% |
| Immigrants | Italy | 96.3 /100 | #100 | Exceptional 47.9% |
| Turks | 96.1 /100 | #101 | Exceptional 47.8% |
| Slavs | 96.0 /100 | #102 | Exceptional 47.8% |
| Hawaiians | 96.0 /100 | #103 | Exceptional 47.8% |
| Immigrants | South Africa | 96.0 /100 | #104 | Exceptional 47.8% |
| Immigrants | Czechoslovakia | 95.5 /100 | #105 | Exceptional 47.8% |
| Portuguese | 95.5 /100 | #106 | Exceptional 47.8% |
| Estonians | 94.7 /100 | #107 | Exceptional 47.7% |
| Immigrants | Japan | 94.4 /100 | #108 | Exceptional 47.7% |
| Immigrants | Jordan | 94.1 /100 | #109 | Exceptional 47.7% |
| Macedonians | 93.9 /100 | #110 | Exceptional 47.6% |
| Syrians | 93.9 /100 | #111 | Exceptional 47.6% |
Demographics Similar to Chinese by Married-couple Households
In terms of married-couple households, the demographic groups most similar to Chinese are Pennsylvania German (50.4%, a difference of 0.0%), Immigrants from Pakistan (50.1%, a difference of 0.44%), Immigrants from South Central Asia (50.6%, a difference of 0.55%), Swiss (49.9%, a difference of 0.81%), and Immigrants from Korea (49.9%, a difference of 0.98%).
| Demographics | Rating | Rank | Married-couple Households |
| Thais | 100.0 /100 | #3 | Exceptional 51.9% |
| Assyrians/Chaldeans/Syriacs | 100.0 /100 | #4 | Exceptional 51.8% |
| Tongans | 100.0 /100 | #5 | Exceptional 51.6% |
| Danes | 100.0 /100 | #6 | Exceptional 51.1% |
| Filipinos | 100.0 /100 | #7 | Exceptional 51.0% |
| Immigrants | South Central Asia | 100.0 /100 | #8 | Exceptional 50.6% |
| Pennsylvania Germans | 100.0 /100 | #9 | Exceptional 50.4% |
| Chinese | 100.0 /100 | #10 | Exceptional 50.4% |
| Immigrants | Pakistan | 100.0 /100 | #11 | Exceptional 50.1% |
| Swiss | 100.0 /100 | #12 | Exceptional 49.9% |
| Immigrants | Korea | 100.0 /100 | #13 | Exceptional 49.9% |
| Burmese | 100.0 /100 | #14 | Exceptional 49.8% |
| Koreans | 99.9 /100 | #15 | Exceptional 49.7% |
| Swedes | 99.9 /100 | #16 | Exceptional 49.7% |
| Immigrants | Hong Kong | 99.9 /100 | #17 | Exceptional 49.6% |