Immigrants from North Macedonia Married-Couple Family Poverty

COMPARE

Immigrants from North Macedonia
Race
Ancestry
AfghanAfricanAlaska NativeAlaskan AthabascanAlbanianAleutAlsatianAmericanApacheArabArapahoArgentineanArmenianAssyrian/Chaldean/SyriacAustralianAustrianBahamianBangladeshiBarbadianBasqueBelgianBelizeanBermudanBhutaneseBlackfeetBolivianBrazilianBritishBritish West IndianBulgarianBurmeseCajunCambodianCanadianCape VerdeanCarpatho RusynCelticCentral AmericanCentral American IndianCherokeeCheyenneChickasawChileanChineseChippewaChoctawColombianColvilleComancheCosta RicanCreeCreekCroatianCrowCubanCypriotCzechCzechoslovakianDanishDelawareDominicanDutchDutch West IndianEastern EuropeanEcuadorianEgyptianEnglishEstonianEthiopianEuropeanFijianFilipinoFinnishFrenchFrench American IndianFrench CanadianGermanGerman RussianGhanaianGreekGuamanian/ChamorroGuatemalanGuyaneseHaitianHmongHonduranHopiHoumaHungarianIcelanderIndian (Asian)IndonesianInupiatIranianIraqiIrishIroquoisIsraeliItalianJamaicanJapaneseJordanianKenyanKiowaKoreanLaotianLatvianLebaneseLiberianLithuanianLumbeeLuxembourgerMacedonianMalaysianMalteseMarshalleseMenomineeMexicanMexican American IndianMongolianMoroccanNative HawaiianNavajoNepaleseNew ZealanderNicaraguanNigerianNorthern EuropeanNorwegianOkinawanOsageOttawaPaiutePakistaniPalestinianPanamanianParaguayanPennsylvania GermanPeruvianPimaPolishPortuguesePotawatomiPuebloPuerto RicanPuget Sound SalishRomanianRussianSalvadoranSamoanScandinavianScotch-IrishScottishSeminoleSenegaleseSerbianShoshoneSierra LeoneanSiouxSlavicSlovakSloveneSomaliSouth AfricanSouth AmericanSouth American IndianSoviet UnionSpaniardSpanishSpanish AmericanSpanish American IndianSri LankanSubsaharan AfricanSudaneseSwedishSwissSyrianTaiwaneseThaiTlingit-HaidaTohono O'OdhamTonganTrinidadian and TobagonianTsimshianTurkishU.S. Virgin IslanderUgandanUkrainianUruguayanUteVenezuelanVietnameseWelshWest IndianYakamaYaquiYugoslavianYumanYup'ikZimbabwean
Immigration
NonimmigrantsImmigrantsAfghanistanAfricaAlbaniaArgentinaArmeniaAsiaAustraliaAustriaBahamasBangladeshBarbadosBelarusBelgiumBelizeBoliviaBosnia and HerzegovinaBrazilBulgariaBurma/MyanmarCabo VerdeCambodiaCameroonCanadaCaribbeanCentral AmericaChileChinaColombiaCongoCosta RicaCroatiaCubaCzechoslovakiaDenmarkDominicaDominican RepublicEastern AfricaEastern AsiaEastern EuropeEcuadorEgyptEl SalvadorEnglandEritreaEthiopiaEuropeFijiFranceGermanyGhanaGreeceGrenadaGuatemalaGuyanaHaitiHondurasHong KongHungaryIndiaIndonesiaIranIraqIrelandIsraelItalyJamaicaJapanJordanKazakhstanKenyaKoreaKuwaitLaosLatin AmericaLatviaLebanonLiberiaLithuaniaMalaysiaMexicoMicronesiaMiddle AfricaMoldovaMoroccoNepalNetherlandsNicaraguaNigeriaNorth AmericaNorth MacedoniaNorthern AfricaNorthern EuropeNorwayOceaniaPakistanPanamaPeruPhilippinesPolandPortugalRomaniaRussiaSaudi ArabiaScotlandSenegalSerbiaSierra LeoneSingaporeSomaliaSouth AfricaSouth AmericaSouth Central AsiaSouth Eastern AsiaSouthern EuropeSpainSri LankaSt. Vincent and the GrenadinesSudanSwedenSwitzerlandSyriaTaiwanThailandTrinidad and TobagoTurkeyUgandaUkraineUruguayUzbekistanVenezuelaVietnamWest IndiesWestern AfricaWestern AsiaWestern EuropeYemenZaireZimbabweAzores
Select to Compare
Race
Ancestry
AfghanAfricanAlaska NativeAlaskan AthabascanAlbanianAleutAlsatianAmericanApacheArabArapahoArgentineanArmenianAssyrian/Chaldean/SyriacAustralianAustrianBahamianBangladeshiBarbadianBasqueBelgianBelizeanBermudanBhutaneseBlackfeetBolivianBrazilianBritishBritish West IndianBulgarianBurmeseCajunCambodianCanadianCape VerdeanCarpatho RusynCelticCentral AmericanCentral American IndianCherokeeCheyenneChickasawChileanChineseChippewaChoctawColombianColvilleComancheCosta RicanCreeCreekCroatianCrowCubanCypriotCzechCzechoslovakianDanishDelawareDominicanDutchDutch West IndianEastern EuropeanEcuadorianEgyptianEnglishEstonianEthiopianEuropeanFijianFilipinoFinnishFrenchFrench American IndianFrench CanadianGermanGerman RussianGhanaianGreekGuamanian/ChamorroGuatemalanGuyaneseHaitianHmongHonduranHopiHoumaHungarianIcelanderIndian (Asian)IndonesianInupiatIranianIraqiIrishIroquoisIsraeliItalianJamaicanJapaneseJordanianKenyanKiowaKoreanLaotianLatvianLebaneseLiberianLithuanianLumbeeLuxembourgerMacedonianMalaysianMalteseMarshalleseMenomineeMexicanMexican American IndianMongolianMoroccanNative HawaiianNavajoNepaleseNew ZealanderNicaraguanNigerianNorthern EuropeanNorwegianOkinawanOsageOttawaPaiutePakistaniPalestinianPanamanianParaguayanPennsylvania GermanPeruvianPimaPolishPortuguesePotawatomiPuebloPuerto RicanPuget Sound SalishRomanianRussianSalvadoranSamoanScandinavianScotch-IrishScottishSeminoleSenegaleseSerbianShoshoneSierra LeoneanSiouxSlavicSlovakSloveneSomaliSouth AfricanSouth AmericanSouth American IndianSoviet UnionSpaniardSpanishSpanish AmericanSpanish American IndianSri LankanSubsaharan AfricanSudaneseSwedishSwissSyrianTaiwaneseThaiTlingit-HaidaTohono O'OdhamTonganTrinidadian and TobagonianTsimshianTurkishU.S. Virgin IslanderUgandanUkrainianUruguayanUteVenezuelanVietnameseWelshWest IndianYakamaYaquiYugoslavianYumanYup'ikZimbabwean
Immigration
NonimmigrantsImmigrantsAfghanistanAfricaAlbaniaArgentinaArmeniaAsiaAustraliaAustriaBahamasBangladeshBarbadosBelarusBelgiumBelizeBoliviaBosnia and HerzegovinaBrazilBulgariaBurma/MyanmarCabo VerdeCambodiaCameroonCanadaCaribbeanCentral AmericaChileChinaColombiaCongoCosta RicaCroatiaCubaCzechoslovakiaDenmarkDominicaDominican RepublicEastern AfricaEastern AsiaEastern EuropeEcuadorEgyptEl SalvadorEnglandEritreaEthiopiaEuropeFijiFranceGermanyGhanaGreeceGrenadaGuatemalaGuyanaHaitiHondurasHong KongHungaryIndiaIndonesiaIranIraqIrelandIsraelItalyJamaicaJapanJordanKazakhstanKenyaKoreaKuwaitLaosLatin AmericaLatviaLebanonLiberiaLithuaniaMalaysiaMexicoMicronesiaMiddle AfricaMoldovaMoroccoNepalNetherlandsNicaraguaNigeriaNorth AmericaNorthern AfricaNorthern EuropeNorwayOceaniaPakistanPanamaPeruPhilippinesPolandPortugalRomaniaRussiaSaudi ArabiaScotlandSenegalSerbiaSierra LeoneSingaporeSomaliaSouth AfricaSouth AmericaSouth Central AsiaSouth Eastern AsiaSouthern EuropeSpainSri LankaSt. Vincent and the GrenadinesSudanSwedenSwitzerlandSyriaTaiwanThailandTrinidad and TobagoTurkeyUgandaUkraineUruguayUzbekistanVenezuelaVietnamWest IndiesWestern AfricaWestern AsiaWestern EuropeYemenZaireZimbabweAzores
Married-Couple Family Poverty
Income
Poverty
Unemployment
Labor Participation
Family Structure
Vehicle Availability
Education Level
Disability

Immigrants from North Macedonia Married-Couple Family Poverty
Exceptional

4.6%
POVERTY | MARRIED-COUPLE FAMILIES
98.6/ 100
METRIC RATING
87th/ 347
METRIC RANK

Immigrants from North Macedonia Married-Couple Family Poverty Correlation Chart

The statistical analysis conducted on geographies consisting of 73,997,704 people shows a slight negative correlation between the proportion of Immigrants from North Macedonia and poverty level among married-couple families in the United States with a correlation coefficient (R) of -0.054 and weighted average of 4.6%. On average, for every 1% (one percent) increase in Immigrants from North Macedonia within a typical geography, there is a decrease of 0.11% in poverty level among married-couple families.
Immigrants from North Macedonia Married-Couple Family Poverty
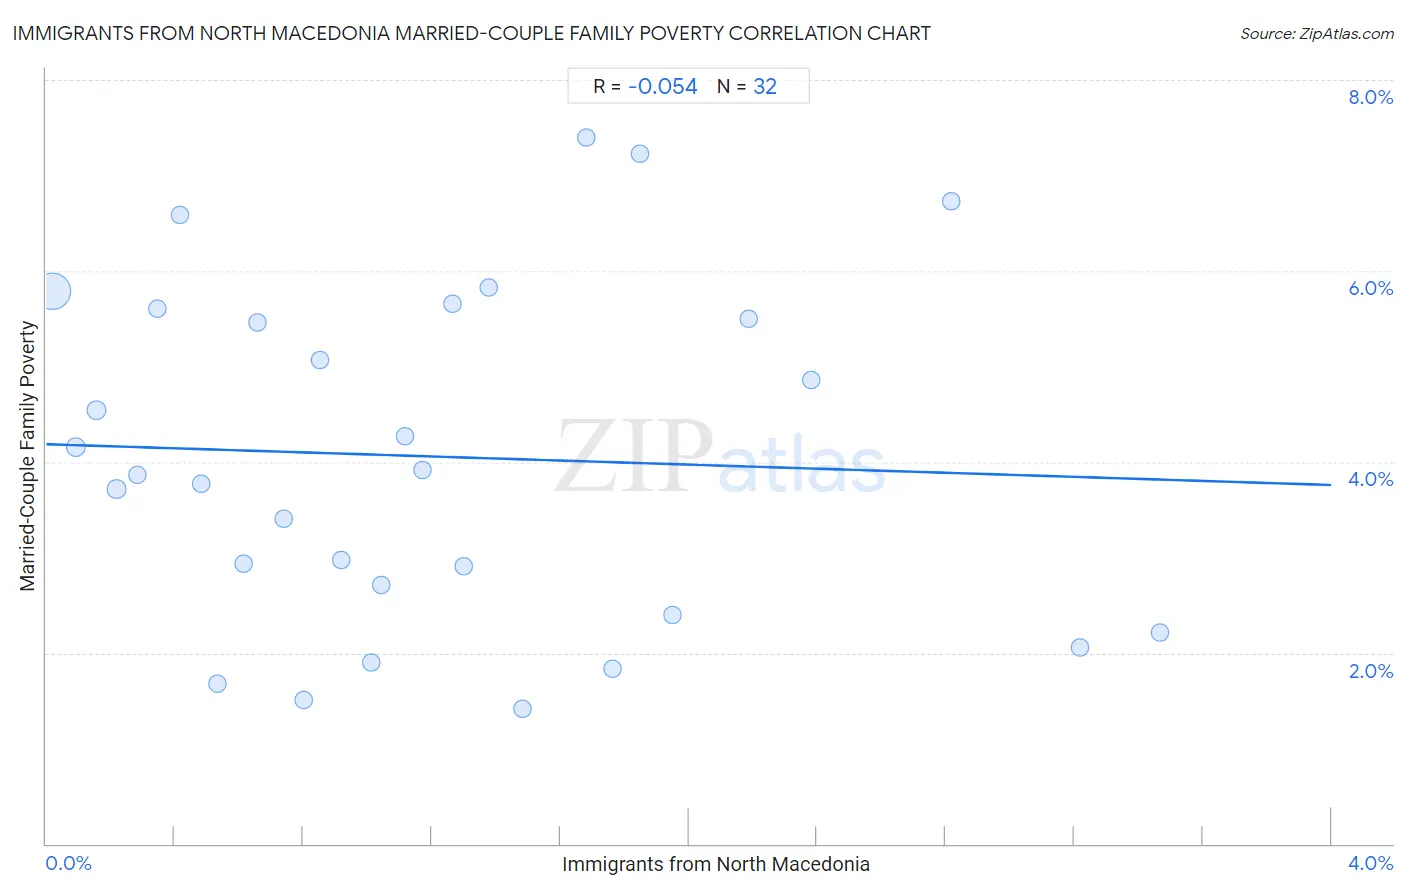
It is essential to understand that the correlation between the percentage of Immigrants from North Macedonia and poverty level among married-couple families does not imply a direct cause-and-effect relationship. It remains uncertain whether the presence of Immigrants from North Macedonia influences an upward or downward trend in the level of poverty level among married-couple families within an area, or if Immigrants from North Macedonia simply ended up residing in those areas with higher or lower levels of poverty level among married-couple families due to other factors.

Demographics Similar to Immigrants from North Macedonia by Married-Couple Family Poverty

In terms of married-couple family poverty, the demographic groups most similar to Immigrants from North Macedonia are Immigrants from Turkey (4.6%, a difference of 0.080%), Bolivian (4.6%, a difference of 0.10%), South African (4.6%, a difference of 0.12%), Immigrants from Czechoslovakia (4.6%, a difference of 0.21%), and Immigrants from Switzerland (4.6%, a difference of 0.28%).
DemographicsRating | RankMarried-Couple Family Poverty
Icelanders
99.0
/100
|
#80
Exceptional
4.5%
Immigrants from Greece
98.9
/100
|
#81
Exceptional
4.5%
Canadians
98.8
/100
|
#82
Exceptional
4.5%
Immigrants from Denmark
98.8
/100
|
#83
Exceptional
4.6%
Immigrants from Croatia
98.7
/100
|
#84
Exceptional
4.6%
South Africans
98.7
/100
|
#85
Exceptional
4.6%
Immigrants from Turkey
98.6
/100
|
#86
Exceptional
4.6%
Immigrants from North Macedonia
98.6
/100
|
#87
Exceptional
4.6%
Bolivians
98.6
/100
|
#88
Exceptional
4.6%
Immigrants from Czechoslovakia
98.5
/100
|
#89
Exceptional
4.6%
Immigrants from Switzerland
98.5
/100
|
#90
Exceptional
4.6%
Basques
98.5
/100
|
#91
Exceptional
4.6%
Immigrants from Norway
98.4
/100
|
#92
Exceptional
4.6%
Koreans
98.3
/100
|
#93
Exceptional
4.6%
Immigrants from Italy
98.3
/100
|
#94
Exceptional
4.6%

Immigrants from North Macedonia Married-Couple Family Poverty Correlation Summary

MeasurementImmigrants from North Macedonia DataMarried-Couple Family Poverty Data
Minimum0.019%1.4%
Maximum3.5%7.4%
Range3.4%6.0%
Mean1.2%4.1%
Median1.0%3.9%
Interquartile 25% (IQ1)0.51%2.6%
Interquartile 75% (IQ3)1.7%5.6%
Interquartile Range (IQR)1.2%3.0%
Standard Deviation (Sample)0.90%1.8%
Standard Deviation (Population)0.88%1.7%

Correlation Details

Immigrants from North Macedonia PercentileSample SizeMarried-Couple Family Poverty
[
0.0%
-
0.5%
]
0.019%
59,712,5325.8%
[
0.0%
-
0.5%
]
0.093%
6,240,8474.2%
[
0.0%
-
0.5%
]
0.16%
2,662,6164.5%
[
0.0%
-
0.5%
]
0.22%
1,833,7533.7%
[
0.0%
-
0.5%
]
0.28%
892,7183.9%
[
0.0%
-
0.5%
]
0.35%
588,5645.6%
[
0.0%
-
0.5%
]
0.42%
241,7166.6%
[
0.0%
-
0.5%
]
0.48%
373,9203.8%
[
0.5%
-
1.0%
]
0.53%
247,8561.7%
[
0.5%
-
1.0%
]
0.61%
231,5882.9%
[
0.5%
-
1.0%
]
0.66%
210,0225.5%
[
0.5%
-
1.0%
]
0.74%
91,4003.4%
[
0.5%
-
1.0%
]
0.80%
148,7171.5%
[
0.5%
-
1.0%
]
0.85%
19,5845.1%
[
0.5%
-
1.0%
]
0.92%
12,8233.0%
[
1.0%
-
1.5%
]
1.01%
30,2151.9%
[
1.0%
-
1.5%
]
1.04%
13,8822.7%
[
1.0%
-
1.5%
]
1.12%
50,4584.3%
[
1.0%
-
1.5%
]
1.17%
55,7673.9%
[
1.0%
-
1.5%
]
1.26%
34,7505.7%
[
1.0%
-
1.5%
]
1.30%
19,9832.9%
[
1.0%
-
1.5%
]
1.38%
72,7975.8%
[
1.0%
-
1.5%
]
1.48%
43,3041.4%
[
1.5%
-
2.0%
]
1.68%
3,0357.4%
[
1.5%
-
2.0%
]
1.76%
16,2931.8%
[
1.5%
-
2.0%
]
1.85%
42,5227.2%
[
1.5%
-
2.0%
]
1.95%
20,3102.4%
[
2.0%
-
2.5%
]
2.19%
3,0665.5%
[
2.0%
-
2.5%
]
2.38%
3,7814.9%
[
2.5%
-
3.0%
]
2.82%
64,9446.7%
[
3.0%
-
3.5%
]
3.22%
10,9422.0%
[
3.0%
-
3.5%
]
3.47%
2,9992.2%