Immigrants from North Macedonia 1 or more Vehicles in Household

COMPARE

Immigrants from North Macedonia
Race
Ancestry
AfghanAfricanAlaska NativeAlaskan AthabascanAlbanianAleutAlsatianAmericanApacheArabArapahoArgentineanArmenianAssyrian/Chaldean/SyriacAustralianAustrianBahamianBangladeshiBarbadianBasqueBelgianBelizeanBermudanBhutaneseBlackfeetBolivianBrazilianBritishBritish West IndianBulgarianBurmeseCajunCambodianCanadianCape VerdeanCarpatho RusynCelticCentral AmericanCentral American IndianCherokeeCheyenneChickasawChileanChineseChippewaChoctawColombianColvilleComancheCosta RicanCreeCreekCroatianCrowCubanCypriotCzechCzechoslovakianDanishDelawareDominicanDutchDutch West IndianEastern EuropeanEcuadorianEgyptianEnglishEstonianEthiopianEuropeanFijianFilipinoFinnishFrenchFrench American IndianFrench CanadianGermanGerman RussianGhanaianGreekGuamanian/ChamorroGuatemalanGuyaneseHaitianHmongHonduranHopiHoumaHungarianIcelanderIndian (Asian)IndonesianInupiatIranianIraqiIrishIroquoisIsraeliItalianJamaicanJapaneseJordanianKenyanKiowaKoreanLaotianLatvianLebaneseLiberianLithuanianLumbeeLuxembourgerMacedonianMalaysianMalteseMarshalleseMenomineeMexicanMexican American IndianMongolianMoroccanNative HawaiianNavajoNepaleseNew ZealanderNicaraguanNigerianNorthern EuropeanNorwegianOkinawanOsageOttawaPaiutePakistaniPalestinianPanamanianParaguayanPennsylvania GermanPeruvianPimaPolishPortuguesePotawatomiPuebloPuerto RicanPuget Sound SalishRomanianRussianSalvadoranSamoanScandinavianScotch-IrishScottishSeminoleSenegaleseSerbianShoshoneSierra LeoneanSiouxSlavicSlovakSloveneSomaliSouth AfricanSouth AmericanSouth American IndianSoviet UnionSpaniardSpanishSpanish AmericanSpanish American IndianSri LankanSubsaharan AfricanSudaneseSwedishSwissSyrianTaiwaneseThaiTlingit-HaidaTohono O'OdhamTonganTrinidadian and TobagonianTsimshianTurkishU.S. Virgin IslanderUgandanUkrainianUruguayanUteVenezuelanVietnameseWelshWest IndianYakamaYaquiYugoslavianYumanYup'ikZimbabwean
Immigration
NonimmigrantsImmigrantsAfghanistanAfricaAlbaniaArgentinaArmeniaAsiaAustraliaAustriaBahamasBangladeshBarbadosBelarusBelgiumBelizeBoliviaBosnia and HerzegovinaBrazilBulgariaBurma/MyanmarCabo VerdeCambodiaCameroonCanadaCaribbeanCentral AmericaChileChinaColombiaCongoCosta RicaCroatiaCubaCzechoslovakiaDenmarkDominicaDominican RepublicEastern AfricaEastern AsiaEastern EuropeEcuadorEgyptEl SalvadorEnglandEritreaEthiopiaEuropeFijiFranceGermanyGhanaGreeceGrenadaGuatemalaGuyanaHaitiHondurasHong KongHungaryIndiaIndonesiaIranIraqIrelandIsraelItalyJamaicaJapanJordanKazakhstanKenyaKoreaKuwaitLaosLatin AmericaLatviaLebanonLiberiaLithuaniaMalaysiaMexicoMicronesiaMiddle AfricaMoldovaMoroccoNepalNetherlandsNicaraguaNigeriaNorth AmericaNorth MacedoniaNorthern AfricaNorthern EuropeNorwayOceaniaPakistanPanamaPeruPhilippinesPolandPortugalRomaniaRussiaSaudi ArabiaScotlandSenegalSerbiaSierra LeoneSingaporeSomaliaSouth AfricaSouth AmericaSouth Central AsiaSouth Eastern AsiaSouthern EuropeSpainSri LankaSt. Vincent and the GrenadinesSudanSwedenSwitzerlandSyriaTaiwanThailandTrinidad and TobagoTurkeyUgandaUkraineUruguayUzbekistanVenezuelaVietnamWest IndiesWestern AfricaWestern AsiaWestern EuropeYemenZaireZimbabweAzores
Select to Compare
Race
Ancestry
AfghanAfricanAlaska NativeAlaskan AthabascanAlbanianAleutAlsatianAmericanApacheArabArapahoArgentineanArmenianAssyrian/Chaldean/SyriacAustralianAustrianBahamianBangladeshiBarbadianBasqueBelgianBelizeanBermudanBhutaneseBlackfeetBolivianBrazilianBritishBritish West IndianBulgarianBurmeseCajunCambodianCanadianCape VerdeanCarpatho RusynCelticCentral AmericanCentral American IndianCherokeeCheyenneChickasawChileanChineseChippewaChoctawColombianColvilleComancheCosta RicanCreeCreekCroatianCrowCubanCypriotCzechCzechoslovakianDanishDelawareDominicanDutchDutch West IndianEastern EuropeanEcuadorianEgyptianEnglishEstonianEthiopianEuropeanFijianFilipinoFinnishFrenchFrench American IndianFrench CanadianGermanGerman RussianGhanaianGreekGuamanian/ChamorroGuatemalanGuyaneseHaitianHmongHonduranHopiHoumaHungarianIcelanderIndian (Asian)IndonesianInupiatIranianIraqiIrishIroquoisIsraeliItalianJamaicanJapaneseJordanianKenyanKiowaKoreanLaotianLatvianLebaneseLiberianLithuanianLumbeeLuxembourgerMacedonianMalaysianMalteseMarshalleseMenomineeMexicanMexican American IndianMongolianMoroccanNative HawaiianNavajoNepaleseNew ZealanderNicaraguanNigerianNorthern EuropeanNorwegianOkinawanOsageOttawaPaiutePakistaniPalestinianPanamanianParaguayanPennsylvania GermanPeruvianPimaPolishPortuguesePotawatomiPuebloPuerto RicanPuget Sound SalishRomanianRussianSalvadoranSamoanScandinavianScotch-IrishScottishSeminoleSenegaleseSerbianShoshoneSierra LeoneanSiouxSlavicSlovakSloveneSomaliSouth AfricanSouth AmericanSouth American IndianSoviet UnionSpaniardSpanishSpanish AmericanSpanish American IndianSri LankanSubsaharan AfricanSudaneseSwedishSwissSyrianTaiwaneseThaiTlingit-HaidaTohono O'OdhamTonganTrinidadian and TobagonianTsimshianTurkishU.S. Virgin IslanderUgandanUkrainianUruguayanUteVenezuelanVietnameseWelshWest IndianYakamaYaquiYugoslavianYumanYup'ikZimbabwean
Immigration
NonimmigrantsImmigrantsAfghanistanAfricaAlbaniaArgentinaArmeniaAsiaAustraliaAustriaBahamasBangladeshBarbadosBelarusBelgiumBelizeBoliviaBosnia and HerzegovinaBrazilBulgariaBurma/MyanmarCabo VerdeCambodiaCameroonCanadaCaribbeanCentral AmericaChileChinaColombiaCongoCosta RicaCroatiaCubaCzechoslovakiaDenmarkDominicaDominican RepublicEastern AfricaEastern AsiaEastern EuropeEcuadorEgyptEl SalvadorEnglandEritreaEthiopiaEuropeFijiFranceGermanyGhanaGreeceGrenadaGuatemalaGuyanaHaitiHondurasHong KongHungaryIndiaIndonesiaIranIraqIrelandIsraelItalyJamaicaJapanJordanKazakhstanKenyaKoreaKuwaitLaosLatin AmericaLatviaLebanonLiberiaLithuaniaMalaysiaMexicoMicronesiaMiddle AfricaMoldovaMoroccoNepalNetherlandsNicaraguaNigeriaNorth AmericaNorthern AfricaNorthern EuropeNorwayOceaniaPakistanPanamaPeruPhilippinesPolandPortugalRomaniaRussiaSaudi ArabiaScotlandSenegalSerbiaSierra LeoneSingaporeSomaliaSouth AfricaSouth AmericaSouth Central AsiaSouth Eastern AsiaSouthern EuropeSpainSri LankaSt. Vincent and the GrenadinesSudanSwedenSwitzerlandSyriaTaiwanThailandTrinidad and TobagoTurkeyUgandaUkraineUruguayUzbekistanVenezuelaVietnamWest IndiesWestern AfricaWestern AsiaWestern EuropeYemenZaireZimbabweAzores
1 or more Vehicles in Household
Income
Poverty
Unemployment
Labor Participation
Family Structure
Vehicle Availability
Education Level
Disability

Immigrants from North Macedonia 1 or more Vehicles in Household
Fair

89.5%
1+ VEHICLES AVAILABLE
36.5/ 100
METRIC RATING
192nd/ 347
METRIC RANK

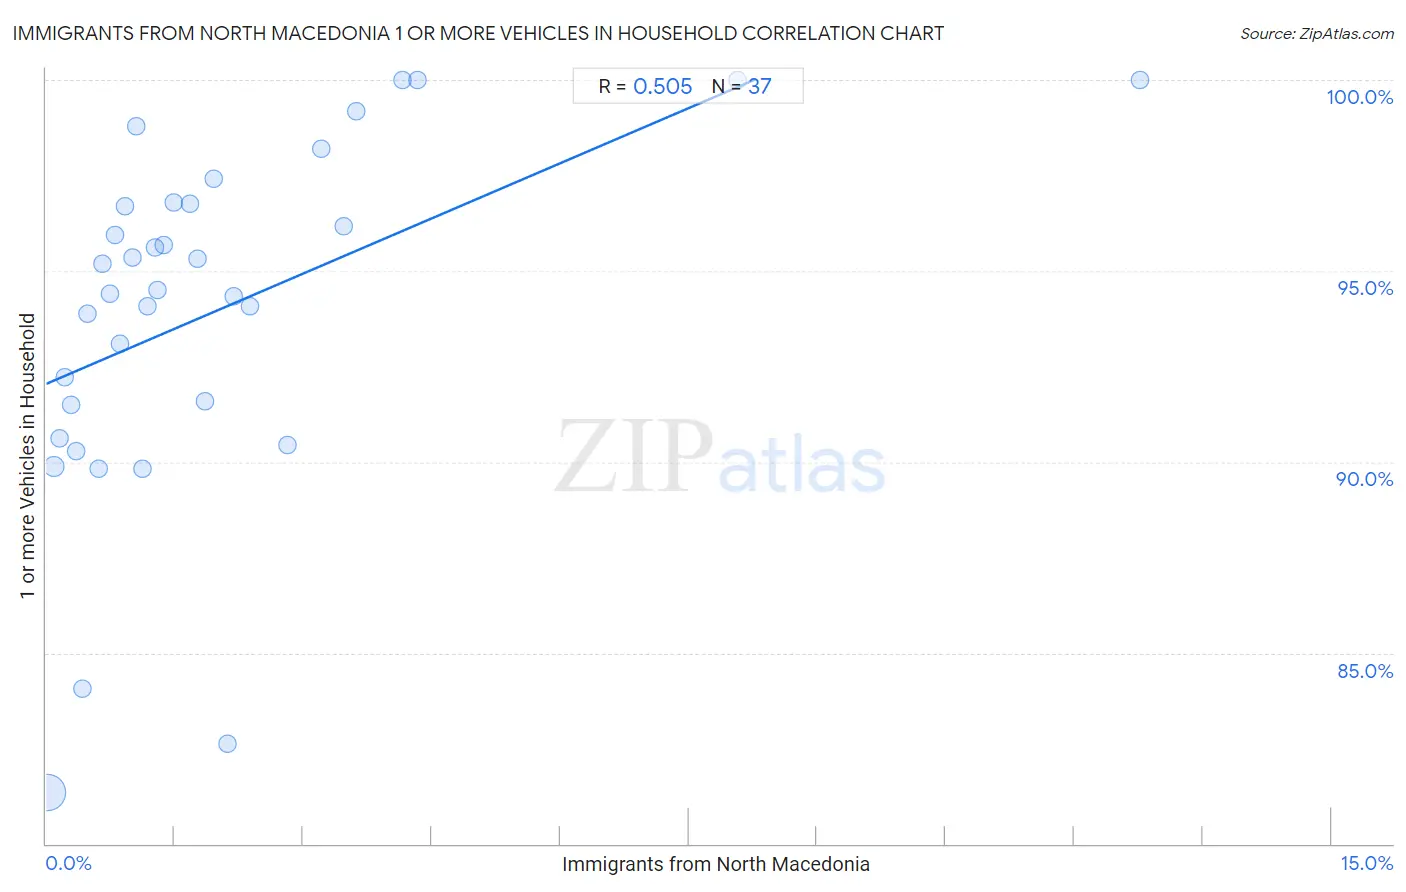
Immigrants from North Macedonia 1 or more Vehicles in Household Correlation Chart

The statistical analysis conducted on geographies consisting of 74,050,012 people shows a substantial positive correlation between the proportion of Immigrants from North Macedonia and percentage of households with 1 or more vehicles available in the United States with a correlation coefficient (R) of 0.505 and weighted average of 89.5%. On average, for every 1% (one percent) increase in Immigrants from North Macedonia within a typical geography, there is an increase of 0.96% in percentage of households with 1 or more vehicles available.
Immigrants from North Macedonia 1 or more Vehicles in Household
It is essential to understand that the correlation between the percentage of Immigrants from North Macedonia and percentage of households with 1 or more vehicles available does not imply a direct cause-and-effect relationship. It remains uncertain whether the presence of Immigrants from North Macedonia influences an upward or downward trend in the level of percentage of households with 1 or more vehicles available within an area, or if Immigrants from North Macedonia simply ended up residing in those areas with higher or lower levels of percentage of households with 1 or more vehicles available due to other factors.

Demographics Similar to Immigrants from North Macedonia by 1 or more Vehicles in Household

In terms of 1 or more vehicles in household, the demographic groups most similar to Immigrants from North Macedonia are Immigrants from Poland (89.5%, a difference of 0.010%), Carpatho Rusyn (89.5%, a difference of 0.020%), Shoshone (89.5%, a difference of 0.020%), Immigrants from Northern Europe (89.5%, a difference of 0.020%), and Immigrants from Nepal (89.5%, a difference of 0.040%).
DemographicsRating | Rank1 or more Vehicles in Household
Immigrants from Brazil
40.1
/100
|
#185
Average
89.6%
Pueblo
39.9
/100
|
#186
Fair
89.6%
South Americans
39.6
/100
|
#187
Fair
89.5%
Immigrants from Nepal
38.9
/100
|
#188
Fair
89.5%
Carpatho Rusyns
37.8
/100
|
#189
Fair
89.5%
Shoshone
37.5
/100
|
#190
Fair
89.5%
Immigrants from Poland
37.1
/100
|
#191
Fair
89.5%
Immigrants from North Macedonia
36.5
/100
|
#192
Fair
89.5%
Immigrants from Northern Europe
35.5
/100
|
#193
Fair
89.5%
Immigrants from Eritrea
33.2
/100
|
#194
Fair
89.4%
Immigrants from Armenia
31.8
/100
|
#195
Fair
89.4%
Crow
24.3
/100
|
#196
Fair
89.3%
Immigrants from Sweden
23.6
/100
|
#197
Fair
89.3%
Pennsylvania Germans
22.9
/100
|
#198
Fair
89.3%
Immigrants from Asia
22.8
/100
|
#199
Fair
89.3%

Immigrants from North Macedonia 1 or more Vehicles in Household Correlation Summary

MeasurementImmigrants from North Macedonia Data1 or more Vehicles in Household Data
Minimum0.019%81.4%
Maximum12.8%100.0%
Range12.7%18.6%
Mean2.0%93.9%
Median1.3%94.5%
Interquartile 25% (IQ1)0.64%91.1%
Interquartile 75% (IQ3)2.3%96.8%
Interquartile Range (IQR)1.6%5.7%
Standard Deviation (Sample)2.4%4.6%
Standard Deviation (Population)2.4%4.5%

Correlation Details

Immigrants from North Macedonia PercentileSample Size1 or more Vehicles in Household
[
0.0%
-
0.5%
]
0.019%
59,714,26281.4%
[
0.0%
-
0.5%
]
0.093%
6,293,28389.9%
[
0.0%
-
0.5%
]
0.16%
2,698,99390.6%
[
0.0%
-
0.5%
]
0.22%
1,844,68892.2%
[
0.0%
-
0.5%
]
0.28%
899,21891.5%
[
0.0%
-
0.5%
]
0.35%
644,56490.3%
[
0.0%
-
0.5%
]
0.42%
283,41284.1%
[
0.0%
-
0.5%
]
0.48%
373,92093.9%
[
0.5%
-
1.0%
]
0.61%
240,33589.8%
[
0.5%
-
1.0%
]
0.66%
210,73795.2%
[
0.5%
-
1.0%
]
0.74%
96,67894.4%
[
0.5%
-
1.0%
]
0.80%
153,21096.0%
[
0.5%
-
1.0%
]
0.86%
25,28893.1%
[
0.5%
-
1.0%
]
0.92%
12,82396.7%
[
1.0%
-
1.5%
]
1.01%
32,85195.3%
[
1.0%
-
1.5%
]
1.04%
13,88298.8%
[
1.0%
-
1.5%
]
1.12%
52,03389.8%
[
1.0%
-
1.5%
]
1.18%
61,81594.1%
[
1.0%
-
1.5%
]
1.26%
34,75095.6%
[
1.0%
-
1.5%
]
1.30%
20,43494.5%
[
1.0%
-
1.5%
]
1.37%
82,20895.7%
[
1.0%
-
1.5%
]
1.48%
43,30496.8%
[
1.5%
-
2.0%
]
1.68%
3,03596.8%
[
1.5%
-
2.0%
]
1.76%
16,75195.3%
[
1.5%
-
2.0%
]
1.85%
42,52291.6%
[
1.5%
-
2.0%
]
1.95%
26,00397.4%
[
2.0%
-
2.5%
]
2.12%
16,84282.6%
[
2.0%
-
2.5%
]
2.19%
4,43994.3%
[
2.0%
-
2.5%
]
2.38%
3,78194.1%
[
2.5%
-
3.0%
]
2.82%
64,94490.5%
[
3.0%
-
3.5%
]
3.22%
10,94298.2%
[
3.0%
-
3.5%
]
3.47%
2,99996.2%
[
3.5%
-
4.0%
]
3.61%
21,80699.2%
[
4.0%
-
4.5%
]
4.16%
409100.0%
[
4.0%
-
4.5%
]
4.33%
1,409100.0%
[
8.0%
-
8.5%
]
8.07%
1,301100.0%
[
12.5%
-
13.0%
]
12.77%
141100.0%