Immigrants from North Macedonia vs Immigrants from Sweden Married-couple Households

COMPARE

Immigrants from North Macedonia
Race
Ancestry
AfghanAfricanAlaska NativeAlaskan AthabascanAlbanianAleutAlsatianAmericanApacheArabArapahoArgentineanArmenianAssyrian/Chaldean/SyriacAustralianAustrianBahamianBangladeshiBarbadianBasqueBelgianBelizeanBermudanBhutaneseBlackfeetBolivianBrazilianBritishBritish West IndianBulgarianBurmeseCajunCambodianCanadianCape VerdeanCarpatho RusynCelticCentral AmericanCentral American IndianCherokeeCheyenneChickasawChileanChineseChippewaChoctawColombianColvilleComancheCosta RicanCreeCreekCroatianCrowCubanCypriotCzechCzechoslovakianDanishDelawareDominicanDutchDutch West IndianEastern EuropeanEcuadorianEgyptianEnglishEstonianEthiopianEuropeanFijianFilipinoFinnishFrenchFrench American IndianFrench CanadianGermanGerman RussianGhanaianGreekGuamanian/ChamorroGuatemalanGuyaneseHaitianHmongHonduranHopiHoumaHungarianIcelanderIndian (Asian)IndonesianInupiatIranianIraqiIrishIroquoisIsraeliItalianJamaicanJapaneseJordanianKenyanKiowaKoreanLaotianLatvianLebaneseLiberianLithuanianLumbeeLuxembourgerMacedonianMalaysianMalteseMarshalleseMenomineeMexicanMexican American IndianMongolianMoroccanNative HawaiianNavajoNepaleseNew ZealanderNicaraguanNigerianNorthern EuropeanNorwegianOkinawanOsageOttawaPaiutePakistaniPalestinianPanamanianParaguayanPennsylvania GermanPeruvianPimaPolishPortuguesePotawatomiPuebloPuerto RicanPuget Sound SalishRomanianRussianSalvadoranSamoanScandinavianScotch-IrishScottishSeminoleSenegaleseSerbianShoshoneSierra LeoneanSiouxSlavicSlovakSloveneSomaliSouth AfricanSouth AmericanSouth American IndianSoviet UnionSpaniardSpanishSpanish AmericanSpanish American IndianSri LankanSubsaharan AfricanSudaneseSwedishSwissSyrianTaiwaneseThaiTlingit-HaidaTohono O'OdhamTonganTrinidadian and TobagonianTsimshianTurkishU.S. Virgin IslanderUgandanUkrainianUruguayanUteVenezuelanVietnameseWelshWest IndianYakamaYaquiYugoslavianYumanYup'ikZimbabwean
Immigration
NonimmigrantsImmigrantsAfghanistanAfricaAlbaniaArgentinaArmeniaAsiaAustraliaAustriaBahamasBangladeshBarbadosBelarusBelgiumBelizeBoliviaBosnia and HerzegovinaBrazilBulgariaBurma/MyanmarCabo VerdeCambodiaCameroonCanadaCaribbeanCentral AmericaChileChinaColombiaCongoCosta RicaCroatiaCubaCzechoslovakiaDenmarkDominicaDominican RepublicEastern AfricaEastern AsiaEastern EuropeEcuadorEgyptEl SalvadorEnglandEritreaEthiopiaEuropeFijiFranceGermanyGhanaGreeceGrenadaGuatemalaGuyanaHaitiHondurasHong KongHungaryIndiaIndonesiaIranIraqIrelandIsraelItalyJamaicaJapanJordanKazakhstanKenyaKoreaKuwaitLaosLatin AmericaLatviaLebanonLiberiaLithuaniaMalaysiaMexicoMicronesiaMiddle AfricaMoldovaMoroccoNepalNetherlandsNicaraguaNigeriaNorth AmericaNorth MacedoniaNorthern AfricaNorthern EuropeNorwayOceaniaPakistanPanamaPeruPhilippinesPolandPortugalRomaniaRussiaSaudi ArabiaScotlandSenegalSerbiaSierra LeoneSingaporeSomaliaSouth AfricaSouth AmericaSouth Central AsiaSouth Eastern AsiaSouthern EuropeSpainSri LankaSt. Vincent and the GrenadinesSudanSwitzerlandSyriaTaiwanThailandTrinidad and TobagoTurkeyUgandaUkraineUruguayUzbekistanVenezuelaVietnamWest IndiesWestern AfricaWestern AsiaWestern EuropeYemenZaireZimbabweAzores
Immigrants from Sweden
Race
Ancestry
AfghanAfricanAlaska NativeAlaskan AthabascanAlbanianAleutAlsatianAmericanApacheArabArapahoArgentineanArmenianAssyrian/Chaldean/SyriacAustralianAustrianBahamianBangladeshiBarbadianBasqueBelgianBelizeanBermudanBhutaneseBlackfeetBolivianBrazilianBritishBritish West IndianBulgarianBurmeseCajunCambodianCanadianCape VerdeanCarpatho RusynCelticCentral AmericanCentral American IndianCherokeeCheyenneChickasawChileanChineseChippewaChoctawColombianColvilleComancheCosta RicanCreeCreekCroatianCrowCubanCypriotCzechCzechoslovakianDanishDelawareDominicanDutchDutch West IndianEastern EuropeanEcuadorianEgyptianEnglishEstonianEthiopianEuropeanFijianFilipinoFinnishFrenchFrench American IndianFrench CanadianGermanGerman RussianGhanaianGreekGuamanian/ChamorroGuatemalanGuyaneseHaitianHmongHonduranHopiHoumaHungarianIcelanderIndian (Asian)IndonesianInupiatIranianIraqiIrishIroquoisIsraeliItalianJamaicanJapaneseJordanianKenyanKiowaKoreanLaotianLatvianLebaneseLiberianLithuanianLumbeeLuxembourgerMacedonianMalaysianMalteseMarshalleseMenomineeMexicanMexican American IndianMongolianMoroccanNative HawaiianNavajoNepaleseNew ZealanderNicaraguanNigerianNorthern EuropeanNorwegianOkinawanOsageOttawaPaiutePakistaniPalestinianPanamanianParaguayanPennsylvania GermanPeruvianPimaPolishPortuguesePotawatomiPuebloPuerto RicanPuget Sound SalishRomanianRussianSalvadoranSamoanScandinavianScotch-IrishScottishSeminoleSenegaleseSerbianShoshoneSierra LeoneanSiouxSlavicSlovakSloveneSomaliSouth AfricanSouth AmericanSouth American IndianSoviet UnionSpaniardSpanishSpanish AmericanSpanish American IndianSri LankanSubsaharan AfricanSudaneseSwedishSwissSyrianTaiwaneseThaiTlingit-HaidaTohono O'OdhamTonganTrinidadian and TobagonianTsimshianTurkishU.S. Virgin IslanderUgandanUkrainianUruguayanUteVenezuelanVietnameseWelshWest IndianYakamaYaquiYugoslavianYumanYup'ikZimbabwean
Immigration
NonimmigrantsImmigrantsAfghanistanAfricaAlbaniaArgentinaArmeniaAsiaAustraliaAustriaBahamasBangladeshBarbadosBelarusBelgiumBelizeBoliviaBosnia and HerzegovinaBrazilBulgariaBurma/MyanmarCabo VerdeCambodiaCameroonCanadaCaribbeanCentral AmericaChileChinaColombiaCongoCosta RicaCroatiaCubaCzechoslovakiaDenmarkDominicaDominican RepublicEastern AfricaEastern AsiaEastern EuropeEcuadorEgyptEl SalvadorEnglandEritreaEthiopiaEuropeFijiFranceGermanyGhanaGreeceGrenadaGuatemalaGuyanaHaitiHondurasHong KongHungaryIndiaIndonesiaIranIraqIrelandIsraelItalyJamaicaJapanJordanKazakhstanKenyaKoreaKuwaitLaosLatin AmericaLatviaLebanonLiberiaLithuaniaMalaysiaMexicoMicronesiaMiddle AfricaMoldovaMoroccoNepalNetherlandsNicaraguaNigeriaNorth AmericaNorthern AfricaNorthern EuropeNorwayOceaniaPakistanPanamaPeruPhilippinesPolandPortugalRomaniaRussiaSaudi ArabiaScotlandSenegalSerbiaSierra LeoneSingaporeSomaliaSouth AfricaSouth AmericaSouth Central AsiaSouth Eastern AsiaSouthern EuropeSpainSri LankaSt. Vincent and the GrenadinesSudanSwedenSwitzerlandSyriaTaiwanThailandTrinidad and TobagoTurkeyUgandaUkraineUruguayUzbekistanVenezuelaVietnamWest IndiesWestern AfricaWestern AsiaWestern EuropeYemenZaireZimbabweAzores
Married-couple Households
Income
Poverty
Unemployment
Labor Participation
Family Structure
Vehicle Availability
Education Level
Disability

Married-couple Households Comparison

Immigrants from North Macedonia

Immigrants from Sweden

Exceptional
Excellent
47.9%
MARRIED-COUPLE HOUSEHOLDS
96.4/ 100
METRIC RATING
98th/ 347
METRIC RANK
47.2%
MARRIED-COUPLE HOUSEHOLDS
84.7/ 100
METRIC RATING
139th/ 347
METRIC RANK

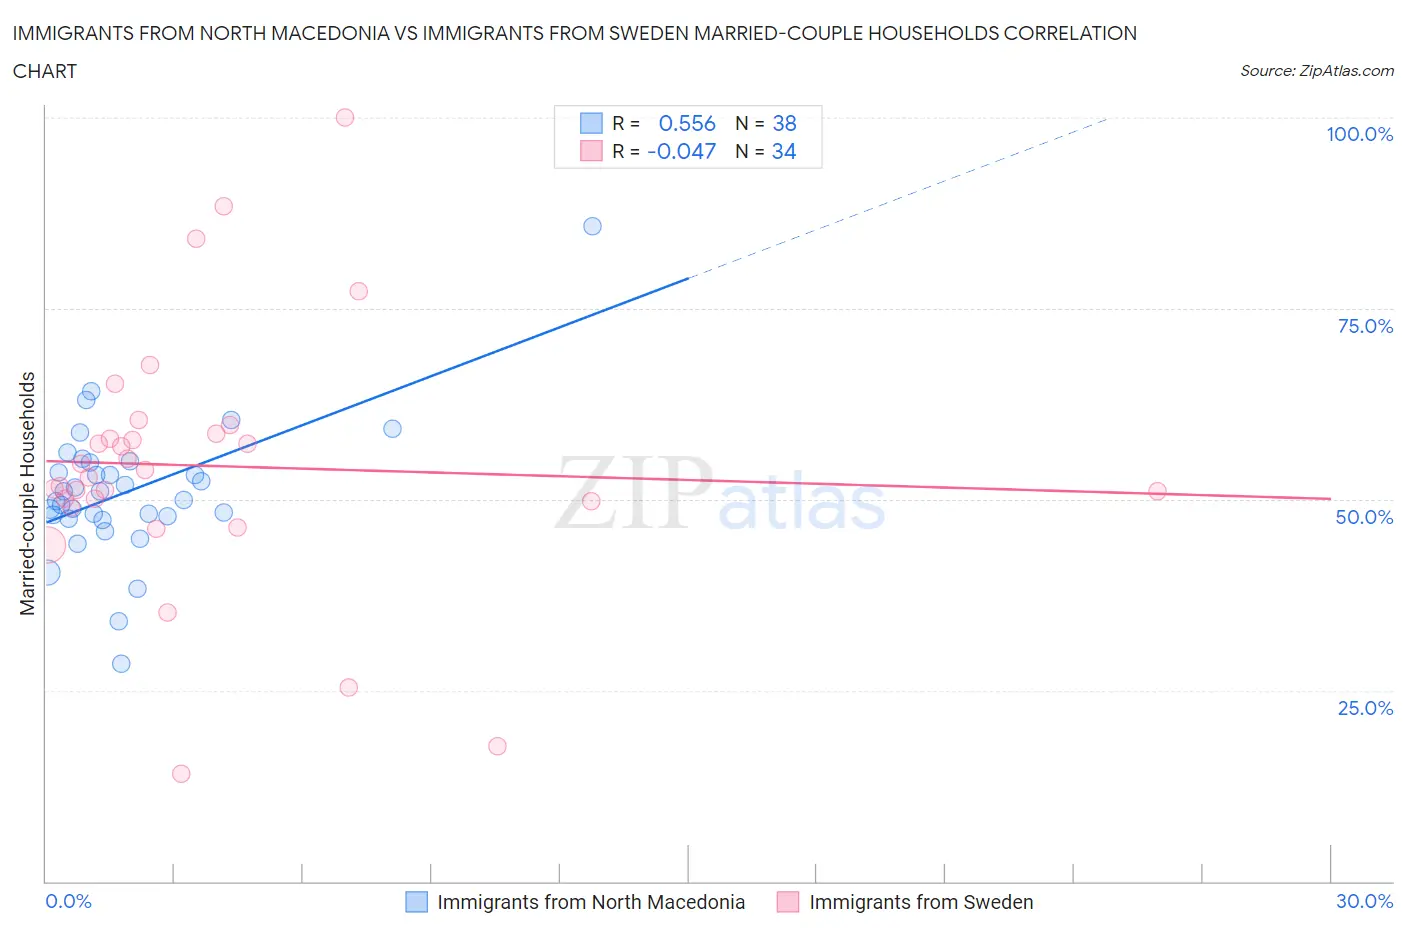
Immigrants from North Macedonia vs Immigrants from Sweden Married-couple Households Correlation Chart

The statistical analysis conducted on geographies consisting of 74,300,796 people shows a substantial positive correlation between the proportion of Immigrants from North Macedonia and percentage of married-couple family households in the United States with a correlation coefficient (R) of 0.556 and weighted average of 47.9%. Similarly, the statistical analysis conducted on geographies consisting of 164,705,416 people shows no correlation between the proportion of Immigrants from Sweden and percentage of married-couple family households in the United States with a correlation coefficient (R) of -0.047 and weighted average of 47.2%, a difference of 1.5%.
Immigrants from North Macedonia vs Immigrants from Sweden Married-couple Households

Married-couple Households Correlation Summary

MeasurementImmigrants from North MacedoniaImmigrants from Sweden
Minimum28.5%14.1%
Maximum85.7%100.0%
Range57.2%85.9%
Mean51.1%54.4%
Median50.5%53.4%
Interquartile 25% (IQ1)47.9%49.7%
Interquartile 75% (IQ3)54.8%58.6%
Interquartile Range (IQR)6.9%8.9%
Standard Deviation (Sample)9.2%17.1%
Standard Deviation (Population)9.0%16.8%

Similar Demographics by Married-couple Households

Demographics Similar to Immigrants from North Macedonia by Married-couple Households

In terms of married-couple households, the demographic groups most similar to Immigrants from North Macedonia are Latvian (47.9%, a difference of 0.010%), Immigrants from Austria (47.9%, a difference of 0.010%), Immigrants from Italy (47.9%, a difference of 0.020%), Immigrants from Egypt (47.9%, a difference of 0.040%), and Turkish (47.8%, a difference of 0.080%).
DemographicsRating | RankMarried-couple Households
Immigrants | Moldova
97.0
/100
|
#91
Exceptional
48.0%
Palestinians
96.9
/100
|
#92
Exceptional
48.0%
Lebanese
96.9
/100
|
#93
Exceptional
47.9%
Americans
96.9
/100
|
#94
Exceptional
47.9%
Immigrants | Belgium
96.8
/100
|
#95
Exceptional
47.9%
Immigrants | Egypt
96.6
/100
|
#96
Exceptional
47.9%
Latvians
96.5
/100
|
#97
Exceptional
47.9%
Immigrants | North Macedonia
96.4
/100
|
#98
Exceptional
47.9%
Immigrants | Austria
96.4
/100
|
#99
Exceptional
47.9%
Immigrants | Italy
96.3
/100
|
#100
Exceptional
47.9%
Turks
96.1
/100
|
#101
Exceptional
47.8%
Slavs
96.0
/100
|
#102
Exceptional
47.8%
Hawaiians
96.0
/100
|
#103
Exceptional
47.8%
Immigrants | South Africa
96.0
/100
|
#104
Exceptional
47.8%
Immigrants | Czechoslovakia
95.5
/100
|
#105
Exceptional
47.8%

Demographics Similar to Immigrants from Sweden by Married-couple Households

In terms of married-couple households, the demographic groups most similar to Immigrants from Sweden are Spanish (47.2%, a difference of 0.020%), Costa Rican (47.2%, a difference of 0.020%), Immigrants from Afghanistan (47.2%, a difference of 0.030%), New Zealander (47.2%, a difference of 0.040%), and Immigrants from Malaysia (47.2%, a difference of 0.040%).
DemographicsRating | RankMarried-couple Households
Immigrants | Ukraine
86.7
/100
|
#132
Excellent
47.3%
South Africans
86.4
/100
|
#133
Excellent
47.3%
Immigrants | Greece
86.0
/100
|
#134
Excellent
47.2%
Immigrants | Argentina
86.0
/100
|
#135
Excellent
47.2%
New Zealanders
85.3
/100
|
#136
Excellent
47.2%
Immigrants | Malaysia
85.2
/100
|
#137
Excellent
47.2%
Immigrants | Afghanistan
85.1
/100
|
#138
Excellent
47.2%
Immigrants | Sweden
84.7
/100
|
#139
Excellent
47.2%
Spanish
84.5
/100
|
#140
Excellent
47.2%
Costa Ricans
84.4
/100
|
#141
Excellent
47.2%
Spaniards
84.1
/100
|
#142
Excellent
47.2%
Immigrants | Belarus
83.8
/100
|
#143
Excellent
47.2%
Mexicans
83.4
/100
|
#144
Excellent
47.1%
Slovenes
81.7
/100
|
#145
Excellent
47.1%
Immigrants | Western Europe
81.6
/100
|
#146
Excellent
47.1%