Immigrants from Armenia Wage/Income Gap
COMPARE
Immigrants from Armenia
Select to Compare
Wage/Income Gap
Immigrants from Armenia Wage/Income Gap
20.7%
WAGE/INCOME GAP
100.0/ 100
METRIC RATING
27th/ 347
METRIC RANK
Immigrants from Armenia Wage/Income Gap Correlation Chart
The statistical analysis conducted on geographies consisting of 97,698,839 people shows a poor negative correlation between the proportion of Immigrants from Armenia and wage/income gap percentage in the United States with a correlation coefficient (R) of -0.101 and weighted average of 20.7%. On average, for every 1% (one percent) increase in Immigrants from Armenia within a typical geography, there is a decrease of 0.18% in wage/income gap percentage.
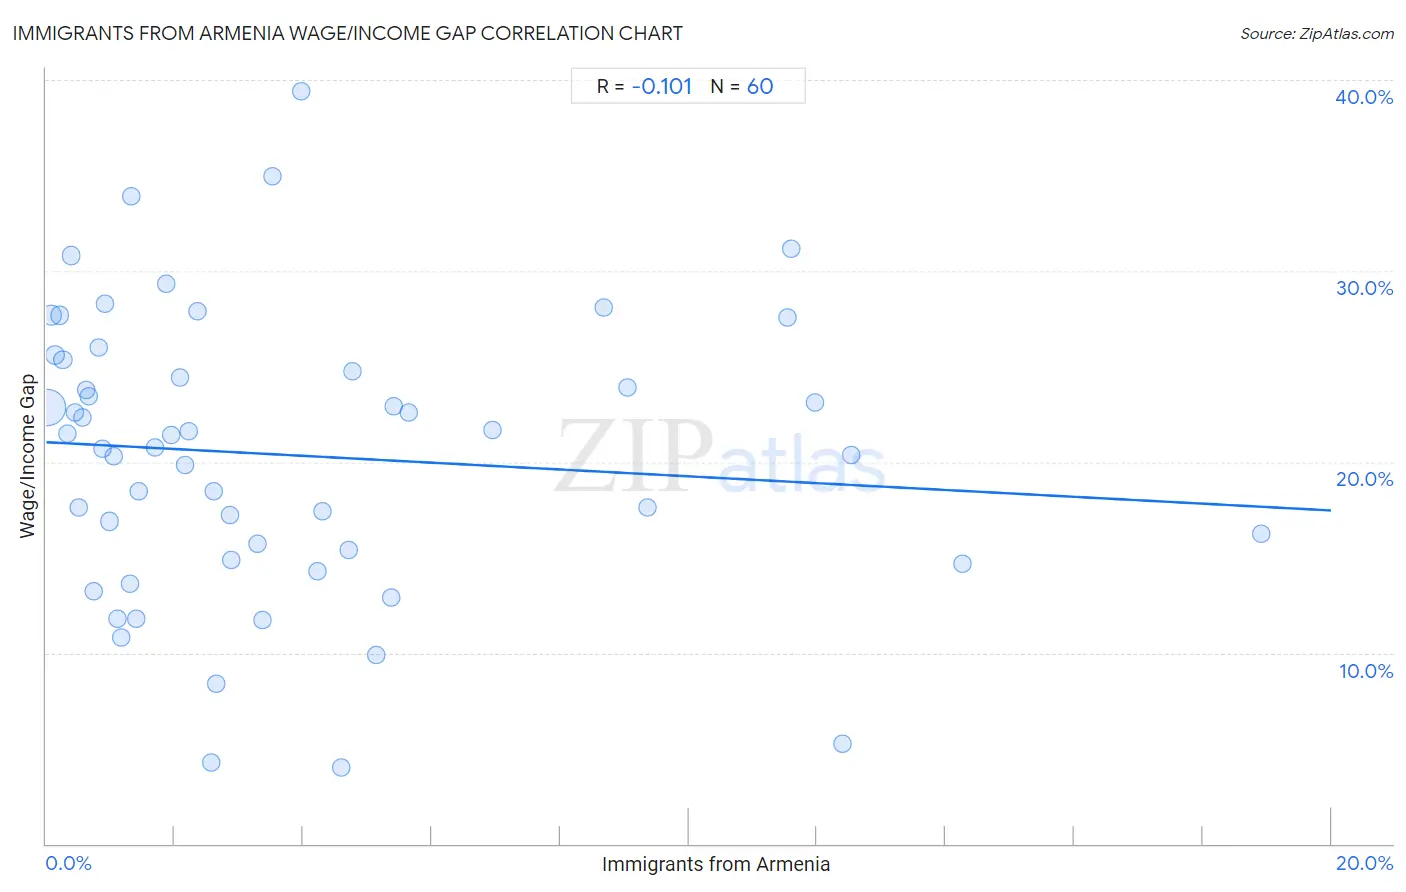
It is essential to understand that the correlation between the percentage of Immigrants from Armenia and wage/income gap percentage does not imply a direct cause-and-effect relationship. It remains uncertain whether the presence of Immigrants from Armenia influences an upward or downward trend in the level of wage/income gap percentage within an area, or if Immigrants from Armenia simply ended up residing in those areas with higher or lower levels of wage/income gap percentage due to other factors.
Demographics Similar to Immigrants from Armenia by Wage/Income Gap
In terms of wage/income gap, the demographic groups most similar to Immigrants from Armenia are Pueblo (20.7%, a difference of 0.20%), Inupiat (20.8%, a difference of 0.23%), Senegalese (20.7%, a difference of 0.31%), Dominican (20.6%, a difference of 0.62%), and Immigrants from Dominican Republic (20.6%, a difference of 0.78%).
| Demographics | Rating | Rank | Wage/Income Gap |
| Bahamians | 100.0 /100 | #20 | Exceptional 20.2% |
| Immigrants from Caribbean | 100.0 /100 | #21 | Exceptional 20.4% |
| Immigrants from Liberia | 100.0 /100 | #22 | Exceptional 20.6% |
| Immigrants from Dominican Republic | 100.0 /100 | #23 | Exceptional 20.6% |
| Dominicans | 100.0 /100 | #24 | Exceptional 20.6% |
| Senegalese | 100.0 /100 | #25 | Exceptional 20.7% |
| Pueblo | 100.0 /100 | #26 | Exceptional 20.7% |
| Immigrants from Armenia | 100.0 /100 | #27 | Exceptional 20.7% |
| Inupiat | 100.0 /100 | #28 | Exceptional 20.8% |
| Immigrants from Senegal | 100.0 /100 | #29 | Exceptional 20.9% |
| Immigrants from Bangladesh | 100.0 /100 | #30 | Exceptional 20.9% |
| Vietnamese | 100.0 /100 | #31 | Exceptional 21.0% |
| Immigrants from Yemen | 100.0 /100 | #32 | Exceptional 21.1% |
| Immigrants from Bahamas | 100.0 /100 | #33 | Exceptional 21.1% |
| Pima | 100.0 /100 | #34 | Exceptional 21.1% |
Immigrants from Armenia Wage/Income Gap Correlation Summary
| Measurement | Immigrants from Armenia Data | Wage/Income Gap Data |
| Minimum | 0.020% | 4.0% |
| Maximum | 18.9% | 39.4% |
| Range | 18.9% | 35.4% |
| Mean | 3.8% | 20.3% |
| Median | 2.3% | 21.1% |
| Interquartile 25% (IQ1) | 0.89% | 15.1% |
| Interquartile 75% (IQ3) | 5.0% | 25.0% |
| Interquartile Range (IQR) | 4.1% | 9.9% |
| Standard Deviation (Sample) | 4.2% | 7.5% |
| Standard Deviation (Population) | 4.2% | 7.4% |
Correlation Details
| Immigrants from Armenia Percentile | Sample Size | Wage/Income Gap |
[ 0.0% - 0.5% ] 0.020% | 71,855,748 | 22.9% |
[ 0.0% - 0.5% ] 0.084% | 8,243,016 | 27.7% |
[ 0.0% - 0.5% ] 0.14% | 4,413,419 | 25.6% |
[ 0.0% - 0.5% ] 0.21% | 2,318,150 | 27.7% |
[ 0.0% - 0.5% ] 0.26% | 1,852,360 | 25.4% |
[ 0.0% - 0.5% ] 0.33% | 674,943 | 21.5% |
[ 0.0% - 0.5% ] 0.39% | 615,896 | 30.8% |
[ 0.0% - 0.5% ] 0.45% | 469,570 | 22.6% |
[ 0.5% - 1.0% ] 0.51% | 96,691 | 17.6% |
[ 0.5% - 1.0% ] 0.57% | 174,401 | 22.3% |
[ 0.5% - 1.0% ] 0.62% | 399,573 | 23.8% |
[ 0.5% - 1.0% ] 0.66% | 118,743 | 23.4% |
[ 0.5% - 1.0% ] 0.74% | 225,375 | 13.2% |
[ 0.5% - 1.0% ] 0.82% | 97,562 | 26.0% |
[ 0.5% - 1.0% ] 0.87% | 32,730 | 20.7% |
[ 0.5% - 1.0% ] 0.92% | 104,155 | 28.3% |
[ 0.5% - 1.0% ] 0.98% | 3,932,718 | 16.9% |
[ 1.0% - 1.5% ] 1.06% | 160,333 | 20.3% |
[ 1.0% - 1.5% ] 1.11% | 126,181 | 11.8% |
[ 1.0% - 1.5% ] 1.17% | 121,433 | 10.8% |
[ 1.0% - 1.5% ] 1.30% | 42,915 | 13.6% |
[ 1.0% - 1.5% ] 1.32% | 20,092 | 33.9% |
[ 1.0% - 1.5% ] 1.41% | 91,800 | 11.8% |
[ 1.0% - 1.5% ] 1.44% | 64,674 | 18.5% |
[ 1.5% - 2.0% ] 1.70% | 63,193 | 20.7% |
[ 1.5% - 2.0% ] 1.87% | 7,126 | 29.3% |
[ 1.5% - 2.0% ] 1.95% | 120,343 | 21.4% |
[ 2.0% - 2.5% ] 2.08% | 42,719 | 24.4% |
[ 2.0% - 2.5% ] 2.16% | 34,649 | 19.8% |
[ 2.0% - 2.5% ] 2.22% | 60,245 | 21.6% |
[ 2.0% - 2.5% ] 2.36% | 87,047 | 27.9% |
[ 2.5% - 3.0% ] 2.56% | 36,619 | 4.2% |
[ 2.5% - 3.0% ] 2.60% | 67,937 | 18.5% |
[ 2.5% - 3.0% ] 2.65% | 5,474 | 8.4% |
[ 2.5% - 3.0% ] 2.86% | 2,451 | 17.2% |
[ 2.5% - 3.0% ] 2.88% | 30,333 | 14.8% |
[ 3.0% - 3.5% ] 3.29% | 30,982 | 15.7% |
[ 3.0% - 3.5% ] 3.36% | 2,529 | 11.7% |
[ 3.5% - 4.0% ] 3.52% | 3,322 | 35.0% |
[ 3.5% - 4.0% ] 3.97% | 27,479 | 39.4% |
[ 4.0% - 4.5% ] 4.23% | 76,335 | 14.3% |
[ 4.0% - 4.5% ] 4.29% | 53,862 | 17.4% |
[ 4.5% - 5.0% ] 4.58% | 15,377 | 4.0% |
[ 4.5% - 5.0% ] 4.71% | 60,090 | 15.4% |
[ 4.5% - 5.0% ] 4.77% | 55,451 | 24.7% |
[ 5.0% - 5.5% ] 5.14% | 45,764 | 9.9% |
[ 5.0% - 5.5% ] 5.38% | 93 | 12.9% |
[ 5.0% - 5.5% ] 5.41% | 7,509 | 22.9% |
[ 5.5% - 6.0% ] 5.64% | 14,386 | 22.6% |
[ 6.5% - 7.0% ] 6.95% | 54,643 | 21.7% |
[ 8.5% - 9.0% ] 8.68% | 27,119 | 28.1% |
[ 9.0% - 9.5% ] 9.04% | 51,654 | 23.9% |
[ 9.0% - 9.5% ] 9.35% | 18,951 | 17.6% |
[ 11.5% - 12.0% ] 11.54% | 18,445 | 27.6% |
[ 11.5% - 12.0% ] 11.59% | 22,831 | 31.2% |
[ 11.5% - 12.0% ] 11.97% | 194,512 | 23.1% |
[ 12.0% - 12.5% ] 12.39% | 16,679 | 5.2% |
[ 12.5% - 13.0% ] 12.54% | 32,294 | 20.4% |
[ 14.0% - 14.5% ] 14.26% | 22,163 | 14.6% |
[ 18.5% - 19.0% ] 18.91% | 35,755 | 16.2% |