Immigrants from Armenia Married-Couple Family Poverty
COMPARE
Immigrants from Armenia
Select to Compare
Married-Couple Family Poverty
Immigrants from Armenia Married-Couple Family Poverty
7.1%
POVERTY | MARRIED-COUPLE FAMILIES
0.0/ 100
METRIC RATING
312th/ 347
METRIC RANK
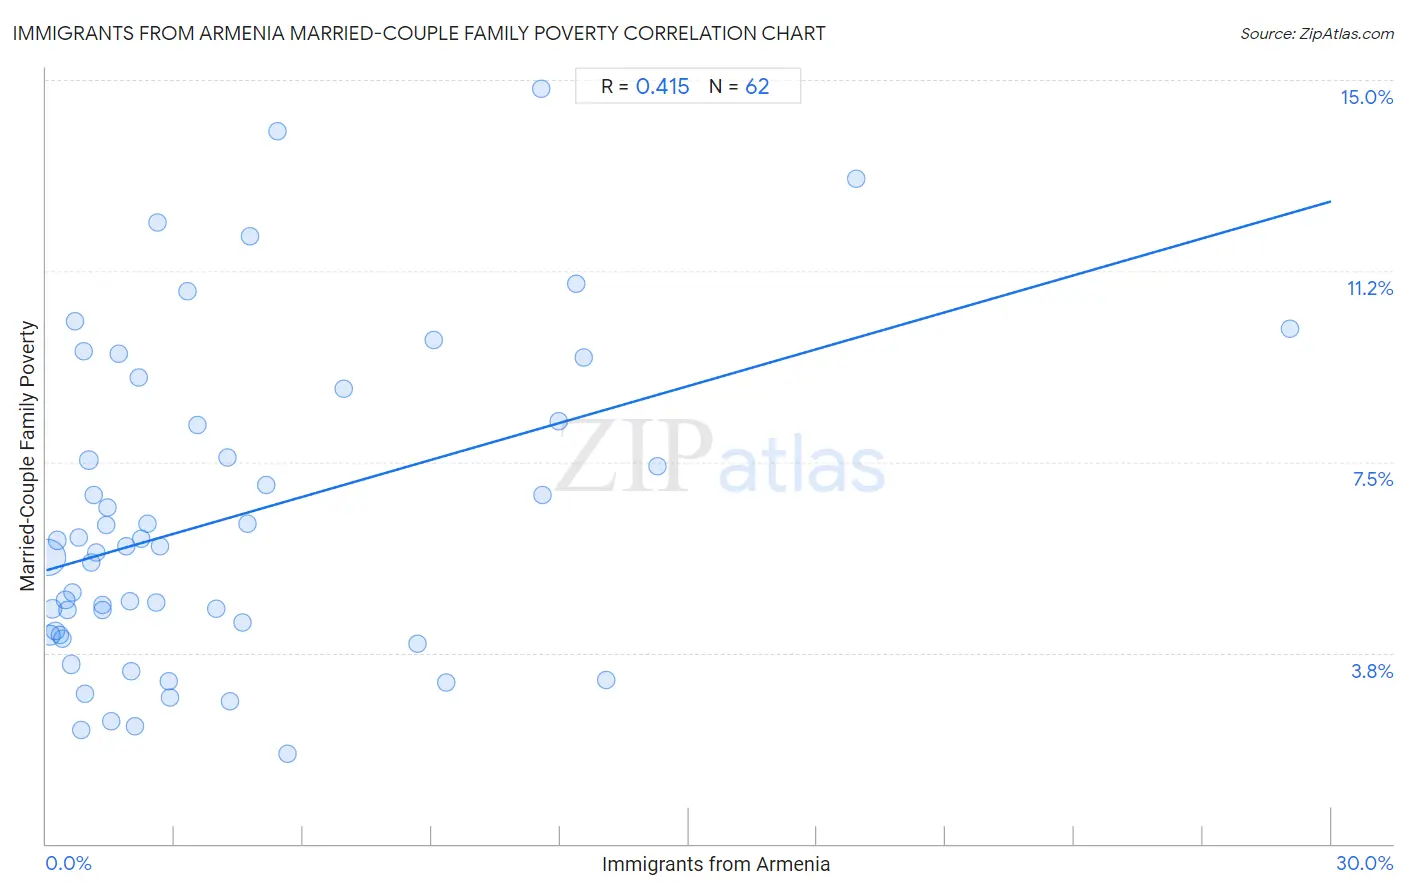
Immigrants from Armenia Married-Couple Family Poverty Correlation Chart
The statistical analysis conducted on geographies consisting of 97,477,014 people shows a moderate positive correlation between the proportion of Immigrants from Armenia and poverty level among married-couple families in the United States with a correlation coefficient (R) of 0.415 and weighted average of 7.1%. On average, for every 1% (one percent) increase in Immigrants from Armenia within a typical geography, there is an increase of 0.24% in poverty level among married-couple families.
It is essential to understand that the correlation between the percentage of Immigrants from Armenia and poverty level among married-couple families does not imply a direct cause-and-effect relationship. It remains uncertain whether the presence of Immigrants from Armenia influences an upward or downward trend in the level of poverty level among married-couple families within an area, or if Immigrants from Armenia simply ended up residing in those areas with higher or lower levels of poverty level among married-couple families due to other factors.
Demographics Similar to Immigrants from Armenia by Married-Couple Family Poverty
In terms of married-couple family poverty, the demographic groups most similar to Immigrants from Armenia are Immigrants from Dominica (7.1%, a difference of 0.0%), Immigrants from Nicaragua (7.1%, a difference of 0.050%), Hopi (7.1%, a difference of 0.080%), Immigrants from St. Vincent and the Grenadines (7.1%, a difference of 0.11%), and British West Indian (7.1%, a difference of 0.41%).
| Demographics | Rating | Rank | Married-Couple Family Poverty |
| Haitians | 0.0 /100 | #305 | Tragic 6.8% |
| Immigrants from Haiti | 0.0 /100 | #306 | Tragic 7.0% |
| Guatemalans | 0.0 /100 | #307 | Tragic 7.0% |
| Spanish American Indians | 0.0 /100 | #308 | Tragic 7.1% |
| Hopi | 0.0 /100 | #309 | Tragic 7.1% |
| Immigrants from Nicaragua | 0.0 /100 | #310 | Tragic 7.1% |
| Immigrants from Dominica | 0.0 /100 | #311 | Tragic 7.1% |
| Immigrants from Armenia | 0.0 /100 | #312 | Tragic 7.1% |
| Immigrants from St. Vincent and the Grenadines | 0.0 /100 | #313 | Tragic 7.1% |
| British West Indians | 0.0 /100 | #314 | Tragic 7.1% |
| Inupiat | 0.0 /100 | #315 | Tragic 7.1% |
| Hondurans | 0.0 /100 | #316 | Tragic 7.2% |
| Mexicans | 0.0 /100 | #317 | Tragic 7.2% |
| Immigrants from Guatemala | 0.0 /100 | #318 | Tragic 7.2% |
| Immigrants from Latin America | 0.0 /100 | #319 | Tragic 7.2% |
Immigrants from Armenia Married-Couple Family Poverty Correlation Summary
| Measurement | Immigrants from Armenia Data | Married-Couple Family Poverty Data |
| Minimum | 0.020% | 1.8% |
| Maximum | 29.0% | 14.8% |
| Range | 29.0% | 13.1% |
| Mean | 4.3% | 6.4% |
| Median | 2.2% | 5.9% |
| Interquartile 25% (IQ1) | 0.92% | 4.1% |
| Interquartile 75% (IQ3) | 5.1% | 8.3% |
| Interquartile Range (IQR) | 4.2% | 4.2% |
| Standard Deviation (Sample) | 5.4% | 3.1% |
| Standard Deviation (Population) | 5.3% | 3.1% |
Correlation Details
| Immigrants from Armenia Percentile | Sample Size | Married-Couple Family Poverty |
[ 0.0% - 0.5% ] 0.020% | 71,820,711 | 5.6% |
[ 0.0% - 0.5% ] 0.084% | 8,182,041 | 4.1% |
[ 0.0% - 0.5% ] 0.14% | 4,355,071 | 4.6% |
[ 0.0% - 0.5% ] 0.21% | 2,320,395 | 4.2% |
[ 0.0% - 0.5% ] 0.26% | 1,834,823 | 6.0% |
[ 0.0% - 0.5% ] 0.33% | 670,290 | 4.1% |
[ 0.0% - 0.5% ] 0.39% | 609,780 | 4.0% |
[ 0.0% - 0.5% ] 0.45% | 465,230 | 4.8% |
[ 0.5% - 1.0% ] 0.51% | 96,691 | 4.6% |
[ 0.5% - 1.0% ] 0.57% | 158,089 | 3.5% |
[ 0.5% - 1.0% ] 0.62% | 397,970 | 4.9% |
[ 0.5% - 1.0% ] 0.66% | 114,449 | 10.3% |
[ 0.5% - 1.0% ] 0.74% | 222,748 | 6.0% |
[ 0.5% - 1.0% ] 0.82% | 99,576 | 2.2% |
[ 0.5% - 1.0% ] 0.87% | 32,730 | 9.7% |
[ 0.5% - 1.0% ] 0.92% | 104,155 | 3.0% |
[ 0.5% - 1.0% ] 0.98% | 3,932,408 | 7.5% |
[ 1.0% - 1.5% ] 1.06% | 154,640 | 5.5% |
[ 1.0% - 1.5% ] 1.11% | 126,181 | 6.9% |
[ 1.0% - 1.5% ] 1.17% | 121,433 | 5.7% |
[ 1.0% - 1.5% ] 1.30% | 35,615 | 4.7% |
[ 1.0% - 1.5% ] 1.32% | 20,092 | 4.6% |
[ 1.0% - 1.5% ] 1.41% | 91,800 | 6.3% |
[ 1.0% - 1.5% ] 1.44% | 63,646 | 6.6% |
[ 1.5% - 2.0% ] 1.51% | 2,988 | 2.4% |
[ 1.5% - 2.0% ] 1.70% | 63,193 | 9.6% |
[ 1.5% - 2.0% ] 1.87% | 7,126 | 5.9% |
[ 1.5% - 2.0% ] 1.95% | 120,343 | 4.8% |
[ 1.5% - 2.0% ] 1.99% | 2,264 | 3.4% |
[ 2.0% - 2.5% ] 2.08% | 42,719 | 2.3% |
[ 2.0% - 2.5% ] 2.16% | 34,649 | 9.2% |
[ 2.0% - 2.5% ] 2.22% | 60,245 | 6.0% |
[ 2.0% - 2.5% ] 2.36% | 85,620 | 6.3% |
[ 2.5% - 3.0% ] 2.56% | 36,619 | 4.7% |
[ 2.5% - 3.0% ] 2.60% | 67,937 | 12.2% |
[ 2.5% - 3.0% ] 2.65% | 5,474 | 5.9% |
[ 2.5% - 3.0% ] 2.86% | 2,451 | 3.2% |
[ 2.5% - 3.0% ] 2.88% | 30,333 | 2.9% |
[ 3.0% - 3.5% ] 3.29% | 30,982 | 10.8% |
[ 3.5% - 4.0% ] 3.52% | 3,322 | 8.2% |
[ 3.5% - 4.0% ] 3.97% | 27,479 | 4.6% |
[ 4.0% - 4.5% ] 4.23% | 76,335 | 7.6% |
[ 4.0% - 4.5% ] 4.29% | 53,862 | 2.8% |
[ 4.5% - 5.0% ] 4.58% | 15,377 | 4.3% |
[ 4.5% - 5.0% ] 4.71% | 60,090 | 6.3% |
[ 4.5% - 5.0% ] 4.77% | 55,451 | 11.9% |
[ 5.0% - 5.5% ] 5.14% | 45,764 | 7.1% |
[ 5.0% - 5.5% ] 5.41% | 7,509 | 14.0% |
[ 5.5% - 6.0% ] 5.64% | 12,312 | 1.8% |
[ 6.5% - 7.0% ] 6.95% | 54,643 | 8.9% |
[ 8.5% - 9.0% ] 8.68% | 27,119 | 3.9% |
[ 9.0% - 9.5% ] 9.04% | 51,654 | 9.9% |
[ 9.0% - 9.5% ] 9.35% | 18,951 | 3.2% |
[ 11.5% - 12.0% ] 11.54% | 18,445 | 14.8% |
[ 11.5% - 12.0% ] 11.59% | 22,831 | 6.8% |
[ 11.5% - 12.0% ] 11.97% | 194,512 | 8.3% |
[ 12.0% - 12.5% ] 12.39% | 16,679 | 11.0% |
[ 12.5% - 13.0% ] 12.54% | 32,294 | 9.6% |
[ 13.0% - 13.5% ] 13.08% | 650 | 3.2% |
[ 14.0% - 14.5% ] 14.26% | 22,163 | 7.4% |
[ 18.5% - 19.0% ] 18.91% | 35,755 | 13.1% |
[ 29.0% - 29.5% ] 29.03% | 310 | 10.1% |