Immigrants from Armenia Disability
COMPARE
Immigrants from Armenia
Select to Compare
Disability
Immigrants from Armenia Disability
11.7%
DISABILITY
41.9/ 100
METRIC RATING
179th/ 347
METRIC RANK
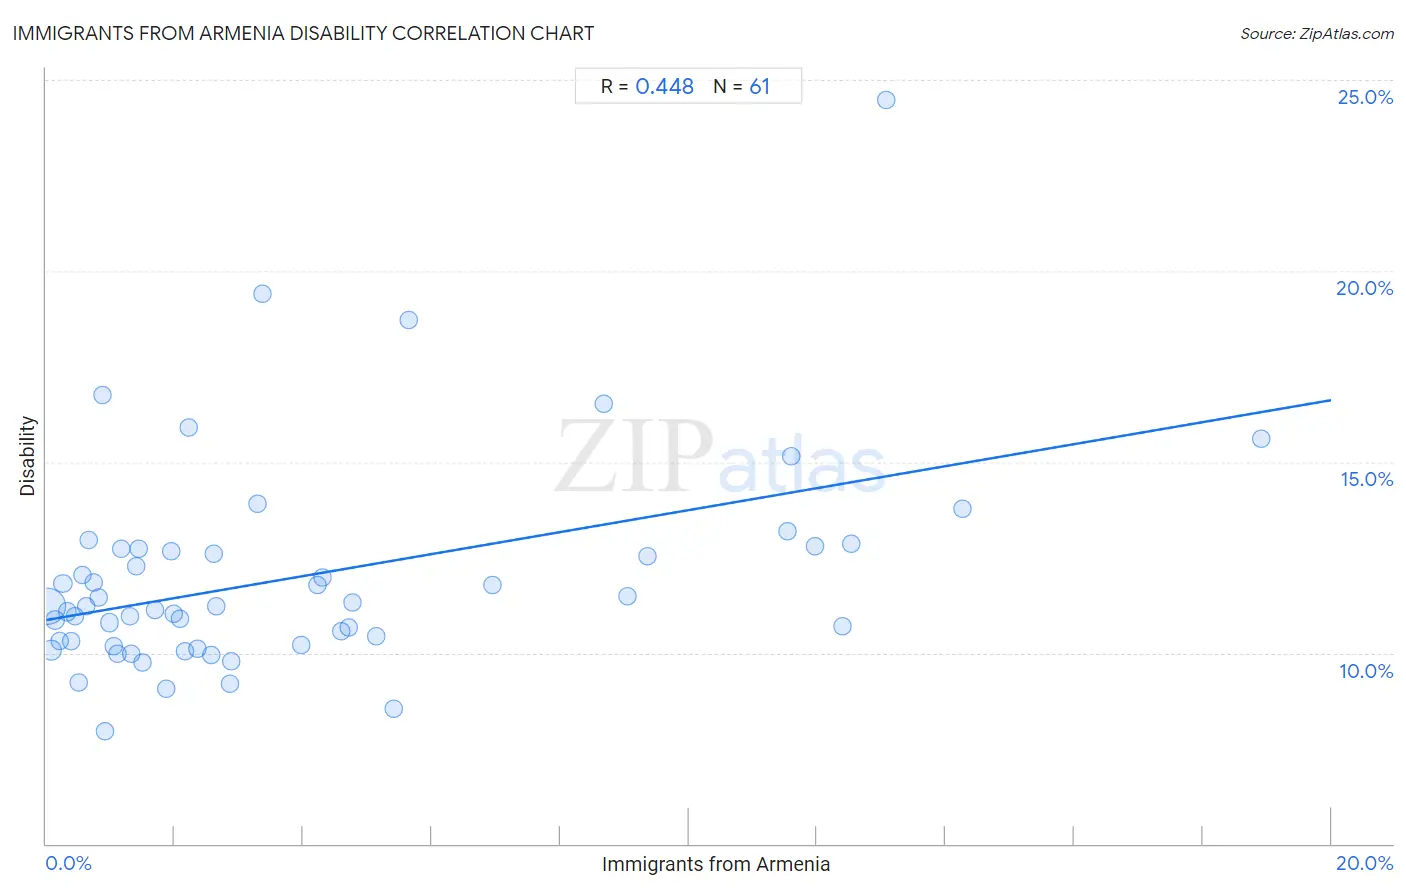
Immigrants from Armenia Disability Correlation Chart
The statistical analysis conducted on geographies consisting of 97,710,593 people shows a moderate positive correlation between the proportion of Immigrants from Armenia and percentage of population with a disability in the United States with a correlation coefficient (R) of 0.448 and weighted average of 11.7%. On average, for every 1% (one percent) increase in Immigrants from Armenia within a typical geography, there is an increase of 0.29% in percentage of population with a disability.
It is essential to understand that the correlation between the percentage of Immigrants from Armenia and percentage of population with a disability does not imply a direct cause-and-effect relationship. It remains uncertain whether the presence of Immigrants from Armenia influences an upward or downward trend in the level of percentage of population with a disability within an area, or if Immigrants from Armenia simply ended up residing in those areas with higher or lower levels of percentage of population with a disability due to other factors.
Demographics Similar to Immigrants from Armenia by Disability
In terms of disability, the demographic groups most similar to Immigrants from Armenia are Greek (11.7%, a difference of 0.19%), Immigrants from Honduras (11.8%, a difference of 0.19%), Immigrants from Central America (11.7%, a difference of 0.21%), Immigrants from Western Africa (11.7%, a difference of 0.25%), and Haitian (11.7%, a difference of 0.30%).
| Demographics | Rating | Rank | Disability |
| Trinidadians and Tobagonians | 52.7 /100 | #172 | Average 11.7% |
| Maltese | 50.6 /100 | #173 | Average 11.7% |
| Albanians | 50.0 /100 | #174 | Average 11.7% |
| Haitians | 48.6 /100 | #175 | Average 11.7% |
| Immigrants from Western Africa | 47.5 /100 | #176 | Average 11.7% |
| Immigrants from Central America | 46.6 /100 | #177 | Average 11.7% |
| Greeks | 46.2 /100 | #178 | Average 11.7% |
| Immigrants from Armenia | 41.9 /100 | #179 | Average 11.7% |
| Immigrants from Honduras | 37.8 /100 | #180 | Fair 11.8% |
| Immigrants from Oceania | 34.3 /100 | #181 | Fair 11.8% |
| Icelanders | 34.0 /100 | #182 | Fair 11.8% |
| Hondurans | 31.2 /100 | #183 | Fair 11.8% |
| Iraqis | 30.0 /100 | #184 | Fair 11.8% |
| Immigrants from Burma/Myanmar | 28.5 /100 | #185 | Fair 11.8% |
| Immigrants from Scotland | 28.2 /100 | #186 | Fair 11.8% |
Immigrants from Armenia Disability Correlation Summary
| Measurement | Immigrants from Armenia Data | Disability Data |
| Minimum | 0.020% | 7.9% |
| Maximum | 18.9% | 24.5% |
| Range | 18.9% | 16.5% |
| Mean | 3.9% | 12.0% |
| Median | 2.2% | 11.2% |
| Interquartile 25% (IQ1) | 0.89% | 10.3% |
| Interquartile 75% (IQ3) | 5.0% | 12.7% |
| Interquartile Range (IQR) | 4.1% | 2.5% |
| Standard Deviation (Sample) | 4.3% | 2.8% |
| Standard Deviation (Population) | 4.3% | 2.8% |
Correlation Details
| Immigrants from Armenia Percentile | Sample Size | Disability |
[ 0.0% - 0.5% ] 0.020% | 71,855,748 | 11.2% |
[ 0.0% - 0.5% ] 0.084% | 8,244,030 | 10.1% |
[ 0.0% - 0.5% ] 0.14% | 4,414,104 | 10.9% |
[ 0.0% - 0.5% ] 0.21% | 2,322,596 | 10.3% |
[ 0.0% - 0.5% ] 0.26% | 1,852,360 | 11.8% |
[ 0.0% - 0.5% ] 0.33% | 675,511 | 11.1% |
[ 0.0% - 0.5% ] 0.39% | 612,548 | 10.3% |
[ 0.0% - 0.5% ] 0.45% | 469,570 | 11.0% |
[ 0.5% - 1.0% ] 0.51% | 96,691 | 9.2% |
[ 0.5% - 1.0% ] 0.57% | 174,401 | 12.0% |
[ 0.5% - 1.0% ] 0.62% | 402,936 | 11.2% |
[ 0.5% - 1.0% ] 0.66% | 118,743 | 12.9% |
[ 0.5% - 1.0% ] 0.74% | 225,375 | 11.8% |
[ 0.5% - 1.0% ] 0.82% | 99,576 | 11.5% |
[ 0.5% - 1.0% ] 0.87% | 32,730 | 16.7% |
[ 0.5% - 1.0% ] 0.92% | 104,155 | 7.9% |
[ 0.5% - 1.0% ] 0.98% | 3,932,718 | 10.8% |
[ 1.0% - 1.5% ] 1.06% | 160,333 | 10.2% |
[ 1.0% - 1.5% ] 1.11% | 126,181 | 10.0% |
[ 1.0% - 1.5% ] 1.17% | 121,433 | 12.7% |
[ 1.0% - 1.5% ] 1.30% | 42,915 | 11.0% |
[ 1.0% - 1.5% ] 1.32% | 20,092 | 10.0% |
[ 1.0% - 1.5% ] 1.41% | 91,800 | 12.3% |
[ 1.0% - 1.5% ] 1.44% | 64,945 | 12.7% |
[ 1.5% - 2.0% ] 1.51% | 2,988 | 9.7% |
[ 1.5% - 2.0% ] 1.70% | 63,193 | 11.1% |
[ 1.5% - 2.0% ] 1.87% | 7,126 | 9.1% |
[ 1.5% - 2.0% ] 1.95% | 120,343 | 12.7% |
[ 1.5% - 2.0% ] 1.99% | 2,264 | 11.0% |
[ 2.0% - 2.5% ] 2.08% | 42,719 | 10.9% |
[ 2.0% - 2.5% ] 2.16% | 34,649 | 10.0% |
[ 2.0% - 2.5% ] 2.22% | 60,245 | 15.9% |
[ 2.0% - 2.5% ] 2.36% | 87,047 | 10.1% |
[ 2.5% - 3.0% ] 2.56% | 36,619 | 9.9% |
[ 2.5% - 3.0% ] 2.60% | 67,937 | 12.6% |
[ 2.5% - 3.0% ] 2.65% | 5,474 | 11.2% |
[ 2.5% - 3.0% ] 2.86% | 2,451 | 9.2% |
[ 2.5% - 3.0% ] 2.88% | 30,333 | 9.8% |
[ 3.0% - 3.5% ] 3.29% | 30,982 | 13.9% |
[ 3.0% - 3.5% ] 3.36% | 2,529 | 19.4% |
[ 3.5% - 4.0% ] 3.97% | 27,479 | 10.2% |
[ 4.0% - 4.5% ] 4.23% | 76,335 | 11.8% |
[ 4.0% - 4.5% ] 4.29% | 53,862 | 12.0% |
[ 4.5% - 5.0% ] 4.58% | 15,377 | 10.6% |
[ 4.5% - 5.0% ] 4.71% | 60,344 | 10.7% |
[ 4.5% - 5.0% ] 4.77% | 55,451 | 11.3% |
[ 5.0% - 5.5% ] 5.14% | 45,764 | 10.4% |
[ 5.0% - 5.5% ] 5.41% | 7,509 | 8.5% |
[ 5.5% - 6.0% ] 5.64% | 14,386 | 18.7% |
[ 6.5% - 7.0% ] 6.95% | 54,643 | 11.8% |
[ 8.5% - 9.0% ] 8.68% | 27,119 | 16.5% |
[ 9.0% - 9.5% ] 9.04% | 51,654 | 11.5% |
[ 9.0% - 9.5% ] 9.35% | 18,951 | 12.5% |
[ 11.5% - 12.0% ] 11.54% | 18,445 | 13.2% |
[ 11.5% - 12.0% ] 11.59% | 22,831 | 15.1% |
[ 11.5% - 12.0% ] 11.97% | 194,512 | 12.8% |
[ 12.0% - 12.5% ] 12.39% | 16,679 | 10.7% |
[ 12.5% - 13.0% ] 12.54% | 32,294 | 12.8% |
[ 13.0% - 13.5% ] 13.08% | 650 | 24.5% |
[ 14.0% - 14.5% ] 14.26% | 22,163 | 13.8% |
[ 18.5% - 19.0% ] 18.91% | 35,755 | 15.6% |