French American Indian Wage/Income Gap

COMPARE

French American Indian
Race
Ancestry
AfghanAfricanAlaska NativeAlaskan AthabascanAlbanianAleutAlsatianAmericanApacheArabArapahoArgentineanArmenianAssyrian/Chaldean/SyriacAustralianAustrianBahamianBangladeshiBarbadianBasqueBelgianBelizeanBermudanBhutaneseBlackfeetBolivianBrazilianBritishBritish West IndianBulgarianBurmeseCajunCambodianCanadianCape VerdeanCarpatho RusynCelticCentral AmericanCentral American IndianCherokeeCheyenneChickasawChileanChineseChippewaChoctawColombianColvilleComancheCosta RicanCreeCreekCroatianCrowCubanCypriotCzechCzechoslovakianDanishDelawareDominicanDutchDutch West IndianEastern EuropeanEcuadorianEgyptianEnglishEstonianEthiopianEuropeanFijianFilipinoFinnishFrenchFrench American IndianFrench CanadianGermanGerman RussianGhanaianGreekGuamanian/ChamorroGuatemalanGuyaneseHaitianHmongHonduranHopiHoumaHungarianIcelanderIndian (Asian)IndonesianInupiatIranianIraqiIrishIroquoisIsraeliItalianJamaicanJapaneseJordanianKenyanKiowaKoreanLaotianLatvianLebaneseLiberianLithuanianLumbeeLuxembourgerMacedonianMalaysianMalteseMarshalleseMenomineeMexicanMexican American IndianMongolianMoroccanNative HawaiianNavajoNepaleseNew ZealanderNicaraguanNigerianNorthern EuropeanNorwegianOkinawanOsageOttawaPaiutePakistaniPalestinianPanamanianParaguayanPennsylvania GermanPeruvianPimaPolishPortuguesePotawatomiPuebloPuerto RicanPuget Sound SalishRomanianRussianSalvadoranSamoanScandinavianScotch-IrishScottishSeminoleSenegaleseSerbianShoshoneSierra LeoneanSiouxSlavicSlovakSloveneSomaliSouth AfricanSouth AmericanSouth American IndianSoviet UnionSpaniardSpanishSpanish AmericanSpanish American IndianSri LankanSubsaharan AfricanSudaneseSwedishSwissSyrianTaiwaneseThaiTlingit-HaidaTohono O'OdhamTonganTrinidadian and TobagonianTsimshianTurkishU.S. Virgin IslanderUgandanUkrainianUruguayanUteVenezuelanVietnameseWelshWest IndianYakamaYaquiYugoslavianYumanYup'ikZimbabwean
Immigration
NonimmigrantsImmigrantsAfghanistanAfricaAlbaniaArgentinaArmeniaAsiaAustraliaAustriaBahamasBangladeshBarbadosBelarusBelgiumBelizeBoliviaBosnia and HerzegovinaBrazilBulgariaBurma/MyanmarCabo VerdeCambodiaCameroonCanadaCaribbeanCentral AmericaChileChinaColombiaCongoCosta RicaCroatiaCubaCzechoslovakiaDenmarkDominicaDominican RepublicEastern AfricaEastern AsiaEastern EuropeEcuadorEgyptEl SalvadorEnglandEritreaEthiopiaEuropeFijiFranceGermanyGhanaGreeceGrenadaGuatemalaGuyanaHaitiHondurasHong KongHungaryIndiaIndonesiaIranIraqIrelandIsraelItalyJamaicaJapanJordanKazakhstanKenyaKoreaKuwaitLaosLatin AmericaLatviaLebanonLiberiaLithuaniaMalaysiaMexicoMicronesiaMiddle AfricaMoldovaMoroccoNepalNetherlandsNicaraguaNigeriaNorth AmericaNorth MacedoniaNorthern AfricaNorthern EuropeNorwayOceaniaPakistanPanamaPeruPhilippinesPolandPortugalRomaniaRussiaSaudi ArabiaScotlandSenegalSerbiaSierra LeoneSingaporeSomaliaSouth AfricaSouth AmericaSouth Central AsiaSouth Eastern AsiaSouthern EuropeSpainSri LankaSt. Vincent and the GrenadinesSudanSwedenSwitzerlandSyriaTaiwanThailandTrinidad and TobagoTurkeyUgandaUkraineUruguayUzbekistanVenezuelaVietnamWest IndiesWestern AfricaWestern AsiaWestern EuropeYemenZaireZimbabweAzores
Select to Compare
Race
Ancestry
AfghanAfricanAlaska NativeAlaskan AthabascanAlbanianAleutAlsatianAmericanApacheArabArapahoArgentineanArmenianAssyrian/Chaldean/SyriacAustralianAustrianBahamianBangladeshiBarbadianBasqueBelgianBelizeanBermudanBhutaneseBlackfeetBolivianBrazilianBritishBritish West IndianBulgarianBurmeseCajunCambodianCanadianCape VerdeanCarpatho RusynCelticCentral AmericanCentral American IndianCherokeeCheyenneChickasawChileanChineseChippewaChoctawColombianColvilleComancheCosta RicanCreeCreekCroatianCrowCubanCypriotCzechCzechoslovakianDanishDelawareDominicanDutchDutch West IndianEastern EuropeanEcuadorianEgyptianEnglishEstonianEthiopianEuropeanFijianFilipinoFinnishFrenchFrench CanadianGermanGerman RussianGhanaianGreekGuamanian/ChamorroGuatemalanGuyaneseHaitianHmongHonduranHopiHoumaHungarianIcelanderIndian (Asian)IndonesianInupiatIranianIraqiIrishIroquoisIsraeliItalianJamaicanJapaneseJordanianKenyanKiowaKoreanLaotianLatvianLebaneseLiberianLithuanianLumbeeLuxembourgerMacedonianMalaysianMalteseMarshalleseMenomineeMexicanMexican American IndianMongolianMoroccanNative HawaiianNavajoNepaleseNew ZealanderNicaraguanNigerianNorthern EuropeanNorwegianOkinawanOsageOttawaPaiutePakistaniPalestinianPanamanianParaguayanPennsylvania GermanPeruvianPimaPolishPortuguesePotawatomiPuebloPuerto RicanPuget Sound SalishRomanianRussianSalvadoranSamoanScandinavianScotch-IrishScottishSeminoleSenegaleseSerbianShoshoneSierra LeoneanSiouxSlavicSlovakSloveneSomaliSouth AfricanSouth AmericanSouth American IndianSoviet UnionSpaniardSpanishSpanish AmericanSpanish American IndianSri LankanSubsaharan AfricanSudaneseSwedishSwissSyrianTaiwaneseThaiTlingit-HaidaTohono O'OdhamTonganTrinidadian and TobagonianTsimshianTurkishU.S. Virgin IslanderUgandanUkrainianUruguayanUteVenezuelanVietnameseWelshWest IndianYakamaYaquiYugoslavianYumanYup'ikZimbabwean
Immigration
NonimmigrantsImmigrantsAfghanistanAfricaAlbaniaArgentinaArmeniaAsiaAustraliaAustriaBahamasBangladeshBarbadosBelarusBelgiumBelizeBoliviaBosnia and HerzegovinaBrazilBulgariaBurma/MyanmarCabo VerdeCambodiaCameroonCanadaCaribbeanCentral AmericaChileChinaColombiaCongoCosta RicaCroatiaCubaCzechoslovakiaDenmarkDominicaDominican RepublicEastern AfricaEastern AsiaEastern EuropeEcuadorEgyptEl SalvadorEnglandEritreaEthiopiaEuropeFijiFranceGermanyGhanaGreeceGrenadaGuatemalaGuyanaHaitiHondurasHong KongHungaryIndiaIndonesiaIranIraqIrelandIsraelItalyJamaicaJapanJordanKazakhstanKenyaKoreaKuwaitLaosLatin AmericaLatviaLebanonLiberiaLithuaniaMalaysiaMexicoMicronesiaMiddle AfricaMoldovaMoroccoNepalNetherlandsNicaraguaNigeriaNorth AmericaNorth MacedoniaNorthern AfricaNorthern EuropeNorwayOceaniaPakistanPanamaPeruPhilippinesPolandPortugalRomaniaRussiaSaudi ArabiaScotlandSenegalSerbiaSierra LeoneSingaporeSomaliaSouth AfricaSouth AmericaSouth Central AsiaSouth Eastern AsiaSouthern EuropeSpainSri LankaSt. Vincent and the GrenadinesSudanSwedenSwitzerlandSyriaTaiwanThailandTrinidad and TobagoTurkeyUgandaUkraineUruguayUzbekistanVenezuelaVietnamWest IndiesWestern AfricaWestern AsiaWestern EuropeYemenZaireZimbabweAzores
Wage/Income Gap
Income
Poverty
Unemployment
Labor Participation
Family Structure
Vehicle Availability
Education Level
Disability

French American Indian Wage/Income Gap
Good

25.4%
WAGE/INCOME GAP
72.5/ 100
METRIC RATING
160th/ 347
METRIC RANK

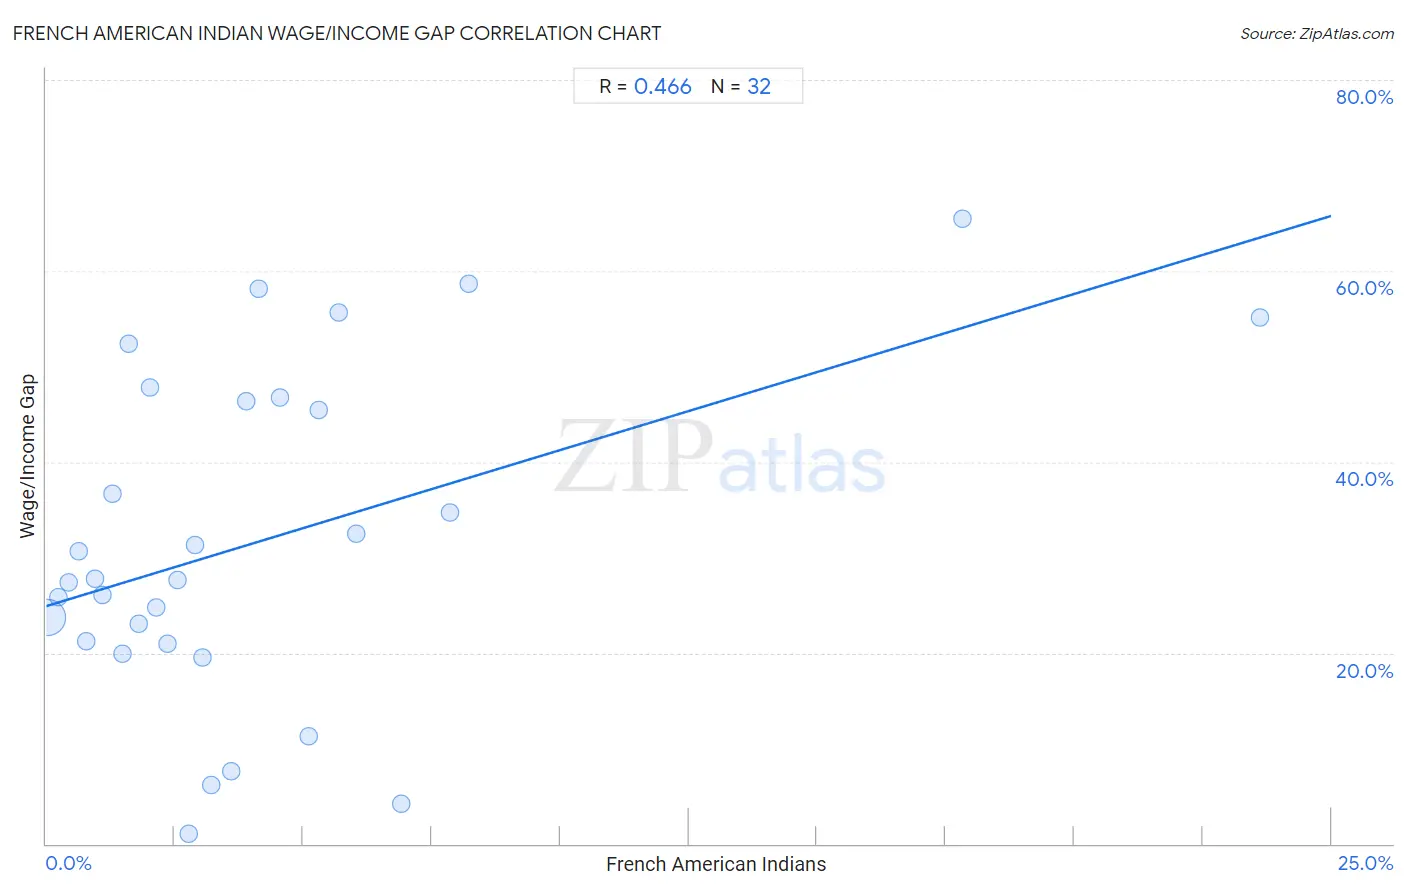
French American Indian Wage/Income Gap Correlation Chart

The statistical analysis conducted on geographies consisting of 131,928,964 people shows a moderate positive correlation between the proportion of French American Indians and wage/income gap percentage in the United States with a correlation coefficient (R) of 0.466 and weighted average of 25.4%. On average, for every 1% (one percent) increase in French American Indians within a typical geography, there is an increase of 1.6% in wage/income gap percentage.
French American Indian Wage/Income Gap
It is essential to understand that the correlation between the percentage of French American Indians and wage/income gap percentage does not imply a direct cause-and-effect relationship. It remains uncertain whether the presence of French American Indians influences an upward or downward trend in the level of wage/income gap percentage within an area, or if French American Indians simply ended up residing in those areas with higher or lower levels of wage/income gap percentage due to other factors.

Demographics Similar to French American Indians by Wage/Income Gap

In terms of wage/income gap, the demographic groups most similar to French American Indians are Puget Sound Salish (25.3%, a difference of 0.040%), Immigrants from Zimbabwe (25.3%, a difference of 0.10%), Albanian (25.4%, a difference of 0.26%), Costa Rican (25.3%, a difference of 0.28%), and Shoshone (25.4%, a difference of 0.28%).
DemographicsRating | RankWage/Income Gap
Blackfeet
78.1
/100
|
#153
Good
25.2%
Immigrants from Northern Africa
78.1
/100
|
#154
Good
25.2%
Immigrants from Vietnam
77.7
/100
|
#155
Good
25.2%
Immigrants from Mexico
76.4
/100
|
#156
Good
25.3%
Costa Ricans
75.8
/100
|
#157
Good
25.3%
Immigrants from Zimbabwe
73.7
/100
|
#158
Good
25.3%
Puget Sound Salish
73.0
/100
|
#159
Good
25.3%
French American Indians
72.5
/100
|
#160
Good
25.4%
Albanians
69.4
/100
|
#161
Good
25.4%
Shoshone
69.0
/100
|
#162
Good
25.4%
Native Hawaiians
69.0
/100
|
#163
Good
25.4%
Koreans
68.6
/100
|
#164
Good
25.4%
Immigrants from Hong Kong
64.0
/100
|
#165
Good
25.5%
Immigrants from Ukraine
63.8
/100
|
#166
Good
25.5%
Paiute
62.9
/100
|
#167
Good
25.5%

French American Indian Wage/Income Gap Correlation Summary

MeasurementFrench American Indian DataWage/Income Gap Data
Minimum0.025%1.1%
Maximum23.6%65.5%
Range23.6%64.4%
Mean4.2%31.7%
Median2.8%27.7%
Interquartile 25% (IQ1)1.4%21.1%
Interquartile 75% (IQ3)5.2%46.5%
Interquartile Range (IQR)3.8%25.5%
Standard Deviation (Sample)4.9%17.2%
Standard Deviation (Population)4.8%17.0%

Correlation Details

French American Indian PercentileSample SizeWage/Income Gap
[
0.0%
-
0.5%
]
0.025%
124,970,19623.7%
[
0.0%
-
0.5%
]
0.24%
4,847,53025.9%
[
0.0%
-
0.5%
]
0.43%
1,187,82327.4%
[
0.5%
-
1.0%
]
0.63%
367,28730.7%
[
0.5%
-
1.0%
]
0.78%
160,32821.2%
[
0.5%
-
1.0%
]
0.96%
76,86427.8%
[
1.0%
-
1.5%
]
1.09%
141,12526.0%
[
1.0%
-
1.5%
]
1.29%
54,06536.7%
[
1.0%
-
1.5%
]
1.48%
27,28519.9%
[
1.5%
-
2.0%
]
1.60%
12,88852.4%
[
1.5%
-
2.0%
]
1.80%
27,65423.0%
[
2.0%
-
2.5%
]
2.03%
3,44847.8%
[
2.0%
-
2.5%
]
2.15%
10,72224.7%
[
2.0%
-
2.5%
]
2.35%
12,52420.9%
[
2.5%
-
3.0%
]
2.56%
4,45027.6%
[
2.5%
-
3.0%
]
2.76%
3621.1%
[
2.5%
-
3.0%
]
2.89%
6,06231.4%
[
3.0%
-
3.5%
]
3.05%
3,60619.5%
[
3.0%
-
3.5%
]
3.22%
2,3316.2%
[
3.5%
-
4.0%
]
3.61%
1,0267.6%
[
3.5%
-
4.0%
]
3.89%
72046.4%
[
4.0%
-
4.5%
]
4.14%
29058.2%
[
4.5%
-
5.0%
]
4.55%
68246.7%
[
5.0%
-
5.5%
]
5.11%
54811.3%
[
5.0%
-
5.5%
]
5.31%
1,30045.4%
[
5.5%
-
6.0%
]
5.68%
38755.6%
[
6.0%
-
6.5%
]
6.04%
3,34632.5%
[
6.5%
-
7.0%
]
6.90%
1744.3%
[
7.5%
-
8.0%
]
7.85%
1,55434.7%
[
8.0%
-
8.5%
]
8.22%
1,59358.7%
[
17.5%
-
18.0%
]
17.82%
57865.5%
[
23.5%
-
24.0%
]
23.61%
21655.1%