French American Indian 2 or more Vehicles in Household

COMPARE

French American Indian
Race
Ancestry
AfghanAfricanAlaska NativeAlaskan AthabascanAlbanianAleutAlsatianAmericanApacheArabArapahoArgentineanArmenianAssyrian/Chaldean/SyriacAustralianAustrianBahamianBangladeshiBarbadianBasqueBelgianBelizeanBermudanBhutaneseBlackfeetBolivianBrazilianBritishBritish West IndianBulgarianBurmeseCajunCambodianCanadianCape VerdeanCarpatho RusynCelticCentral AmericanCentral American IndianCherokeeCheyenneChickasawChileanChineseChippewaChoctawColombianColvilleComancheCosta RicanCreeCreekCroatianCrowCubanCypriotCzechCzechoslovakianDanishDelawareDominicanDutchDutch West IndianEastern EuropeanEcuadorianEgyptianEnglishEstonianEthiopianEuropeanFijianFilipinoFinnishFrenchFrench American IndianFrench CanadianGermanGerman RussianGhanaianGreekGuamanian/ChamorroGuatemalanGuyaneseHaitianHmongHonduranHopiHoumaHungarianIcelanderIndian (Asian)IndonesianInupiatIranianIraqiIrishIroquoisIsraeliItalianJamaicanJapaneseJordanianKenyanKiowaKoreanLaotianLatvianLebaneseLiberianLithuanianLumbeeLuxembourgerMacedonianMalaysianMalteseMarshalleseMenomineeMexicanMexican American IndianMongolianMoroccanNative HawaiianNavajoNepaleseNew ZealanderNicaraguanNigerianNorthern EuropeanNorwegianOkinawanOsageOttawaPaiutePakistaniPalestinianPanamanianParaguayanPennsylvania GermanPeruvianPimaPolishPortuguesePotawatomiPuebloPuerto RicanPuget Sound SalishRomanianRussianSalvadoranSamoanScandinavianScotch-IrishScottishSeminoleSenegaleseSerbianShoshoneSierra LeoneanSiouxSlavicSlovakSloveneSomaliSouth AfricanSouth AmericanSouth American IndianSoviet UnionSpaniardSpanishSpanish AmericanSpanish American IndianSri LankanSubsaharan AfricanSudaneseSwedishSwissSyrianTaiwaneseThaiTlingit-HaidaTohono O'OdhamTonganTrinidadian and TobagonianTsimshianTurkishU.S. Virgin IslanderUgandanUkrainianUruguayanUteVenezuelanVietnameseWelshWest IndianYakamaYaquiYugoslavianYumanYup'ikZimbabwean
Immigration
NonimmigrantsImmigrantsAfghanistanAfricaAlbaniaArgentinaArmeniaAsiaAustraliaAustriaBahamasBangladeshBarbadosBelarusBelgiumBelizeBoliviaBosnia and HerzegovinaBrazilBulgariaBurma/MyanmarCabo VerdeCambodiaCameroonCanadaCaribbeanCentral AmericaChileChinaColombiaCongoCosta RicaCroatiaCubaCzechoslovakiaDenmarkDominicaDominican RepublicEastern AfricaEastern AsiaEastern EuropeEcuadorEgyptEl SalvadorEnglandEritreaEthiopiaEuropeFijiFranceGermanyGhanaGreeceGrenadaGuatemalaGuyanaHaitiHondurasHong KongHungaryIndiaIndonesiaIranIraqIrelandIsraelItalyJamaicaJapanJordanKazakhstanKenyaKoreaKuwaitLaosLatin AmericaLatviaLebanonLiberiaLithuaniaMalaysiaMexicoMicronesiaMiddle AfricaMoldovaMoroccoNepalNetherlandsNicaraguaNigeriaNorth AmericaNorth MacedoniaNorthern AfricaNorthern EuropeNorwayOceaniaPakistanPanamaPeruPhilippinesPolandPortugalRomaniaRussiaSaudi ArabiaScotlandSenegalSerbiaSierra LeoneSingaporeSomaliaSouth AfricaSouth AmericaSouth Central AsiaSouth Eastern AsiaSouthern EuropeSpainSri LankaSt. Vincent and the GrenadinesSudanSwedenSwitzerlandSyriaTaiwanThailandTrinidad and TobagoTurkeyUgandaUkraineUruguayUzbekistanVenezuelaVietnamWest IndiesWestern AfricaWestern AsiaWestern EuropeYemenZaireZimbabweAzores
Select to Compare
Race
Ancestry
AfghanAfricanAlaska NativeAlaskan AthabascanAlbanianAleutAlsatianAmericanApacheArabArapahoArgentineanArmenianAssyrian/Chaldean/SyriacAustralianAustrianBahamianBangladeshiBarbadianBasqueBelgianBelizeanBermudanBhutaneseBlackfeetBolivianBrazilianBritishBritish West IndianBulgarianBurmeseCajunCambodianCanadianCape VerdeanCarpatho RusynCelticCentral AmericanCentral American IndianCherokeeCheyenneChickasawChileanChineseChippewaChoctawColombianColvilleComancheCosta RicanCreeCreekCroatianCrowCubanCypriotCzechCzechoslovakianDanishDelawareDominicanDutchDutch West IndianEastern EuropeanEcuadorianEgyptianEnglishEstonianEthiopianEuropeanFijianFilipinoFinnishFrenchFrench CanadianGermanGerman RussianGhanaianGreekGuamanian/ChamorroGuatemalanGuyaneseHaitianHmongHonduranHopiHoumaHungarianIcelanderIndian (Asian)IndonesianInupiatIranianIraqiIrishIroquoisIsraeliItalianJamaicanJapaneseJordanianKenyanKiowaKoreanLaotianLatvianLebaneseLiberianLithuanianLumbeeLuxembourgerMacedonianMalaysianMalteseMarshalleseMenomineeMexicanMexican American IndianMongolianMoroccanNative HawaiianNavajoNepaleseNew ZealanderNicaraguanNigerianNorthern EuropeanNorwegianOkinawanOsageOttawaPaiutePakistaniPalestinianPanamanianParaguayanPennsylvania GermanPeruvianPimaPolishPortuguesePotawatomiPuebloPuerto RicanPuget Sound SalishRomanianRussianSalvadoranSamoanScandinavianScotch-IrishScottishSeminoleSenegaleseSerbianShoshoneSierra LeoneanSiouxSlavicSlovakSloveneSomaliSouth AfricanSouth AmericanSouth American IndianSoviet UnionSpaniardSpanishSpanish AmericanSpanish American IndianSri LankanSubsaharan AfricanSudaneseSwedishSwissSyrianTaiwaneseThaiTlingit-HaidaTohono O'OdhamTonganTrinidadian and TobagonianTsimshianTurkishU.S. Virgin IslanderUgandanUkrainianUruguayanUteVenezuelanVietnameseWelshWest IndianYakamaYaquiYugoslavianYumanYup'ikZimbabwean
Immigration
NonimmigrantsImmigrantsAfghanistanAfricaAlbaniaArgentinaArmeniaAsiaAustraliaAustriaBahamasBangladeshBarbadosBelarusBelgiumBelizeBoliviaBosnia and HerzegovinaBrazilBulgariaBurma/MyanmarCabo VerdeCambodiaCameroonCanadaCaribbeanCentral AmericaChileChinaColombiaCongoCosta RicaCroatiaCubaCzechoslovakiaDenmarkDominicaDominican RepublicEastern AfricaEastern AsiaEastern EuropeEcuadorEgyptEl SalvadorEnglandEritreaEthiopiaEuropeFijiFranceGermanyGhanaGreeceGrenadaGuatemalaGuyanaHaitiHondurasHong KongHungaryIndiaIndonesiaIranIraqIrelandIsraelItalyJamaicaJapanJordanKazakhstanKenyaKoreaKuwaitLaosLatin AmericaLatviaLebanonLiberiaLithuaniaMalaysiaMexicoMicronesiaMiddle AfricaMoldovaMoroccoNepalNetherlandsNicaraguaNigeriaNorth AmericaNorth MacedoniaNorthern AfricaNorthern EuropeNorwayOceaniaPakistanPanamaPeruPhilippinesPolandPortugalRomaniaRussiaSaudi ArabiaScotlandSenegalSerbiaSierra LeoneSingaporeSomaliaSouth AfricaSouth AmericaSouth Central AsiaSouth Eastern AsiaSouthern EuropeSpainSri LankaSt. Vincent and the GrenadinesSudanSwedenSwitzerlandSyriaTaiwanThailandTrinidad and TobagoTurkeyUgandaUkraineUruguayUzbekistanVenezuelaVietnamWest IndiesWestern AfricaWestern AsiaWestern EuropeYemenZaireZimbabweAzores
2 or more Vehicles in Household
Income
Poverty
Unemployment
Labor Participation
Family Structure
Vehicle Availability
Education Level
Disability

French American Indian 2 or more Vehicles in Household
Average

55.5%
2+ VEHICLES AVAILABLE
56.7/ 100
METRIC RATING
168th/ 347
METRIC RANK

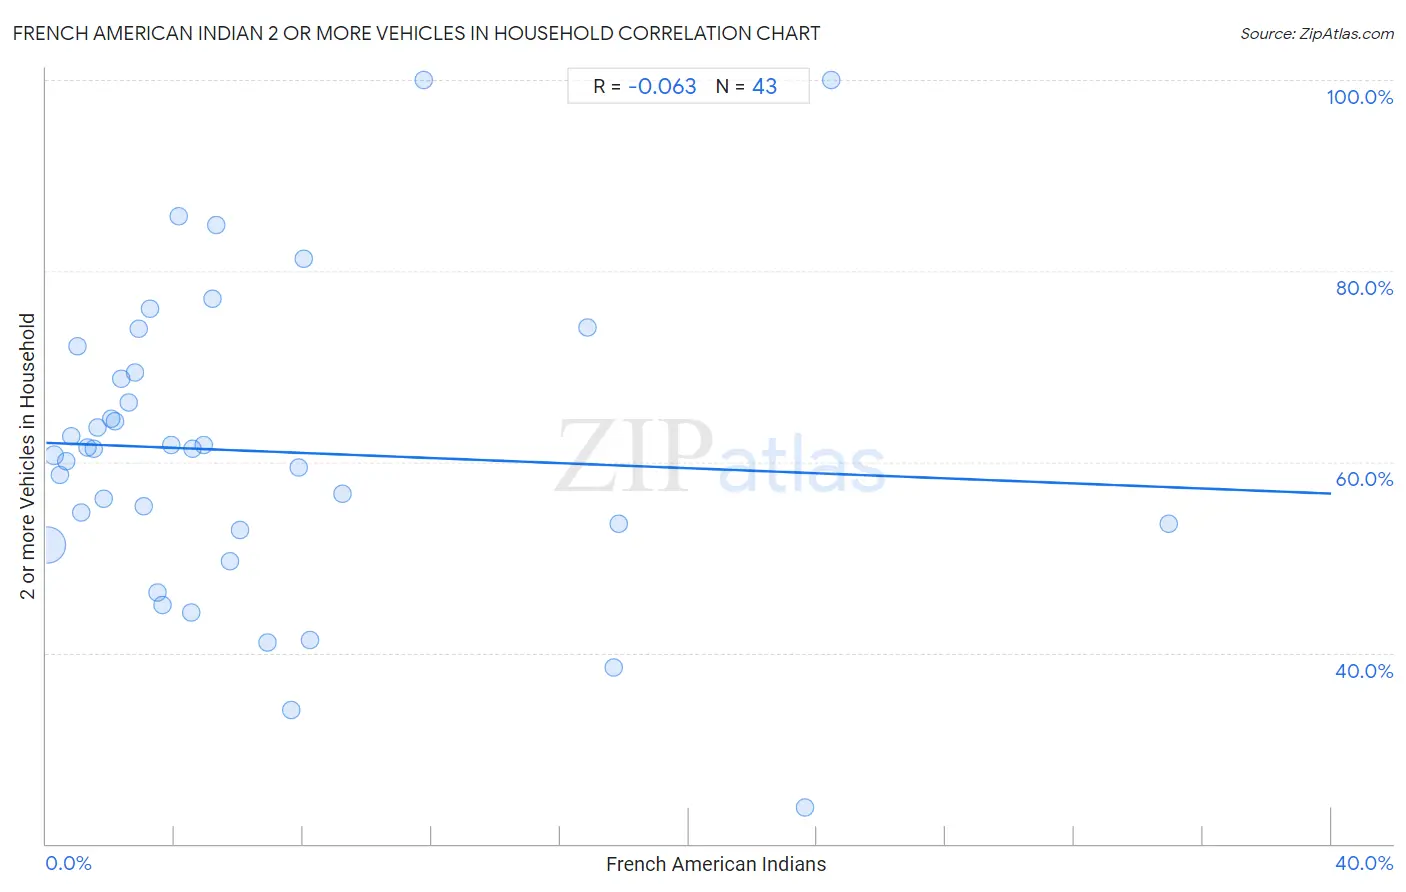
French American Indian 2 or more Vehicles in Household Correlation Chart

The statistical analysis conducted on geographies consisting of 131,972,181 people shows a slight negative correlation between the proportion of French American Indians and percentage of households with 2 or more vehicles available in the United States with a correlation coefficient (R) of -0.063 and weighted average of 55.5%. On average, for every 1% (one percent) increase in French American Indians within a typical geography, there is a decrease of 0.13% in percentage of households with 2 or more vehicles available.
French American Indian 2 or more Vehicles in Household
It is essential to understand that the correlation between the percentage of French American Indians and percentage of households with 2 or more vehicles available does not imply a direct cause-and-effect relationship. It remains uncertain whether the presence of French American Indians influences an upward or downward trend in the level of percentage of households with 2 or more vehicles available within an area, or if French American Indians simply ended up residing in those areas with higher or lower levels of percentage of households with 2 or more vehicles available due to other factors.

Demographics Similar to French American Indians by 2 or more Vehicles in Household

In terms of 2 or more vehicles in household, the demographic groups most similar to French American Indians are Immigrants from Austria (55.5%, a difference of 0.010%), Romanian (55.5%, a difference of 0.030%), Kenyan (55.5%, a difference of 0.060%), Immigrants from Sri Lanka (55.5%, a difference of 0.070%), and Immigrants from Costa Rica (55.4%, a difference of 0.090%).
DemographicsRating | Rank2 or more Vehicles in Household
Colville
61.1
/100
|
#161
Good
55.6%
German Russians
60.9
/100
|
#162
Good
55.6%
Immigrants from Zimbabwe
60.2
/100
|
#163
Good
55.6%
Dutch West Indians
59.8
/100
|
#164
Average
55.6%
Immigrants from El Salvador
59.4
/100
|
#165
Average
55.6%
Immigrants from Sri Lanka
58.3
/100
|
#166
Average
55.5%
Kenyans
58.1
/100
|
#167
Average
55.5%
French American Indians
56.7
/100
|
#168
Average
55.5%
Immigrants from Austria
56.3
/100
|
#169
Average
55.5%
Romanians
55.8
/100
|
#170
Average
55.5%
Immigrants from Costa Rica
54.4
/100
|
#171
Average
55.4%
Immigrants from Nicaragua
51.6
/100
|
#172
Average
55.4%
Immigrants from Western Europe
51.4
/100
|
#173
Average
55.4%
Navajo
50.0
/100
|
#174
Average
55.3%
Immigrants from Denmark
49.4
/100
|
#175
Average
55.3%

French American Indian 2 or more Vehicles in Household Correlation Summary

MeasurementFrench American Indian Data2 or more Vehicles in Household Data
Minimum0.025%23.7%
Maximum34.9%100.0%
Range34.9%76.2%
Mean6.5%61.1%
Median3.9%61.3%
Interquartile 25% (IQ1)1.8%52.9%
Interquartile 75% (IQ3)7.9%69.4%
Interquartile Range (IQR)6.0%16.5%
Standard Deviation (Sample)7.5%15.8%
Standard Deviation (Population)7.4%15.6%

Correlation Details

French American Indian PercentileSample Size2 or more Vehicles in Household
[
0.0%
-
0.5%
]
0.025%
124,988,24651.2%
[
0.0%
-
0.5%
]
0.24%
4,850,11260.7%
[
0.0%
-
0.5%
]
0.43%
1,192,67558.7%
[
0.5%
-
1.0%
]
0.63%
368,27360.1%
[
0.5%
-
1.0%
]
0.78%
161,76862.7%
[
0.5%
-
1.0%
]
0.96%
83,24072.1%
[
1.0%
-
1.5%
]
1.09%
141,74854.7%
[
1.0%
-
1.5%
]
1.30%
55,47261.5%
[
1.0%
-
1.5%
]
1.48%
28,77961.3%
[
1.5%
-
2.0%
]
1.60%
13,12663.5%
[
1.5%
-
2.0%
]
1.80%
27,71156.1%
[
2.0%
-
2.5%
]
2.03%
3,44864.6%
[
2.0%
-
2.5%
]
2.15%
10,90464.3%
[
2.0%
-
2.5%
]
2.35%
12,52468.7%
[
2.5%
-
3.0%
]
2.56%
4,52766.2%
[
2.5%
-
3.0%
]
2.76%
43569.4%
[
2.5%
-
3.0%
]
2.88%
6,24073.9%
[
3.0%
-
3.5%
]
3.05%
3,80855.3%
[
3.0%
-
3.5%
]
3.22%
2,33176.1%
[
3.0%
-
3.5%
]
3.47%
17346.3%
[
3.5%
-
4.0%
]
3.63%
1,68144.9%
[
3.5%
-
4.0%
]
3.88%
1,21061.7%
[
4.0%
-
4.5%
]
4.14%
29085.7%
[
4.0%
-
4.5%
]
4.49%
17844.2%
[
4.5%
-
5.0%
]
4.55%
68261.4%
[
4.5%
-
5.0%
]
4.89%
36861.8%
[
5.0%
-
5.5%
]
5.18%
1,23677.1%
[
5.0%
-
5.5%
]
5.31%
1,30084.8%
[
5.5%
-
6.0%
]
5.71%
66649.6%
[
6.0%
-
6.5%
]
6.04%
3,34652.9%
[
6.5%
-
7.0%
]
6.90%
17441.0%
[
7.5%
-
8.0%
]
7.63%
24934.0%
[
7.5%
-
8.0%
]
7.85%
1,55459.5%
[
8.0%
-
8.5%
]
8.00%
2581.2%
[
8.0%
-
8.5%
]
8.22%
1,59341.4%
[
9.0%
-
9.5%
]
9.23%
75856.6%
[
11.5%
-
12.0%
]
11.76%
34100.0%
[
16.5%
-
17.0%
]
16.86%
17274.1%
[
17.5%
-
18.0%
]
17.65%
6838.5%
[
17.5%
-
18.0%
]
17.82%
57853.6%
[
23.5%
-
24.0%
]
23.61%
21623.7%
[
24.0%
-
24.5%
]
24.44%
180100.0%
[
34.5%
-
35.0%
]
34.94%
8353.6%